 CrossRef
 CrossMark
 Mendeley
 Scholar
Introduction
The rising prevalence of antibiotic-resistant bacterial infections worldwide represents a major public health concern, with particular focus on resistant strains of Escherichia coli and Staphylococcus aureus. Multidrug-resistant E. coli and methicillin-resistant S. aureus (MRSA) are increasingly responsible for a range of infections, including those of the urinary tract, lungs, bloodstream and wounds. This growing resistance undermines the effectiveness of current antibiotics, leading to treatment failures, higher healthcare costs, and increased illness and death rates [1,2] .
Although new antibiotics continue to be developed, bacteria often evolve resistance faster than new drugs can be introduced. The widespread misuse and overuse of antibiotics have accelerated this issue, underscoring the urgent need to investigate alternative treatment strategies. Natural products with antibacterial properties, especially those derived from traditional medicinal plants, are gaining attention as promising sources of new antimicrobial agents [3]. These plants are rich in bioactive compounds and have a long-standing history in treating various infectious diseases [4].
One notable example is Guiera senegalensis, a plant traditionally used in African Sahelian medicine to treat conditions like diarrhea, respiratory infections, and wounds, indicating its potential broad-spectrum antimicrobial activity. Research has shown that extracts of G. senegalensis exhibit antibacterial effects against both Gram-positive and Gram-negative bacteria [5,6]. However, there is limited in-depth study on its effectiveness against clinically resistant strains of E. coli and S. aureus, and the mechanisms behind its antibacterial action remain unclear.
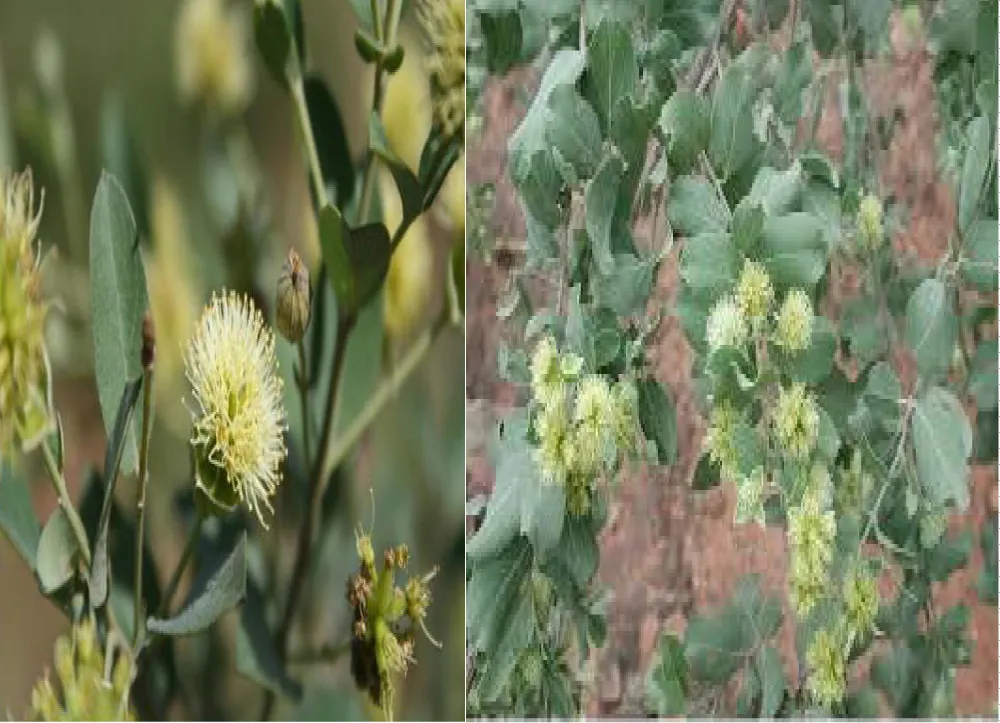
Furthermore, understanding the genetic characteristics of resistant strains is essential for effective infection control. Molecular analyses help identify important resistance and virulence genes, such as mecA in S. aureus (linked to methicillin resistance) and blaCTX-M in E. coli (associated with extended-spectrum beta-lactamase production) [6]. Combining traditional medicinal research with molecular biology could offer critical insights into the antibacterial capacity of G. senegalensis and its potential use against resistant pathogens. Investigating this plant's therapeutic potential is crucial in the broader effort to develop new strategies to combat antimicrobial resistance (Figure 1).
R: Close view of Guiera senegalensis.
Materials and Methods
Collection and identification
Fresh leaves of Guiera senegalensis was collected from Musa Musawa Farms located in Katsina State, Nigeria. The plant specimen was taken for taxonomic identification and verification by a botanist at the department of biological science of the Nigerian Defense Academy Kaduna with a voucher number of NDA/BIOH/2023/57 and deposited at the Herbarium [7].
Crude extraction procedures
The crude extraction followed the method outlined by [8]. Fresh Guiera senegalensis leaves was washed thoroughly to remove dirt, then ground using a mortar and pestle before being pressed into a clean, sterilized container. The resulting extract was stored in screw-capped bottles and properly labeled.
Ethanol extraction
For ethanol extraction, 40 g of powdered plant material was mixed with 300ml of ethanol. The solution was kept at room temperature in sealed containers for two days, with occasional stirring using a sterile glass rod. Afterward, the mixture was filtered through muslin cloth, and the filtrate was evaporated in a water bath maintained at 40 °C to remove the ethanol. This process was replicated in the aqueous extraction steps. The semi-solid residue was air-dried under a ceiling fan. Once dry, the extract will be weighed; part will be reserved for phytochemical screening, while the remainder will be used for susceptibility tests.
Methodology
Study design and setting
This laboratory-based experimental study was conducted at the department of biological science of the Nigerian Defense Academy Kaduna. The study involved phytochemical profiling of Guiera senegalensis leaf extracts and molecular characterization of clinically isolated Escherichia coli and Staphylococcus aureus.
Sample size and sampling technique
Inclusion criteria comprised confirmed clinical isolates of E. coli and S. aureus from patients with documented infections. Only viable, non-duplicate isolates with clear phenotypic characteristics were included. Exclusion criteria included contaminated samples, duplicate isolates from the same patient, and isolates with incomplete identification records.
Bacterial isolates and molecular characterization
Isolates were initially identified using standard microbiological techniques, including Gram staining, culture characteristics, and biochemical tests. Molecular confirmation was performed by polymerase chain reaction (PCR) targeting species-specific genes. Amplified products were analyzed by agarose gel electrophoresis to confirm expected band sizes.
Phytochemical and GC–MS analysis
Fresh leaves of Guiera senegalensis were air-dried, pulverized, and extracted using aqueous and ethanol solvents. Qualitative and quantitative phytochemical analyses were performed using standard procedures. Bioactive compounds were identified through Gas Chromatography–Mass Spectrometry (GC–MS) analysis.
Bias control measures
Standardized laboratory protocols were strictly followed throughout the study. All experiments were conducted in triplicate to ensure reproducibility. Positive and negative controls were included during PCR amplification. Laboratory personnel were blinded to sample grouping during molecular analysis to minimize detection bias.
Phytochemical screening
Ethanolic extracts of G. senegalensis will be analyzed for phytochemical components including saponins, flavonoids, phenolic compounds, and anthraquinones [9].
Qualitative phytochemical analysis
The secondary metabolites analyzed include:
- Alkaloids: For alkaloid detection, 0.1 mg of each plant extract was mixed with 6 ml of diluted hydrochloric acid. The mixture was heated at 85°C, cooled down to 40°C, and filtered through a small 1-inch sieve. The filtrate was then tested for alkaloids using Dragendorff’s, Meyer’s, and Wagner’s reagents, each in separate containers.
- Terpenoids: To test for terpenoids, 1 ml of the extract was added to 10 ml of deionized water, followed by three drops of ferric chloride.
- Flavonoids: Flavonoid content was tested by boiling 0.2 mg of each extract at 40°C for 3 minutes in 10 ml of ethyl acetate, cooling to room temperature, and filtering through a 1-inch sieve. Then, 4 ml of the filtrate was combined with 1 ml of dilute ammonia and shaken vigorously for one minute.
- Saponins: Saponins were detected by mixing 5 ml of each extract with 20 ml of deionized water and shaken vigorously.
- Phenols: For phenols, 0.1 g of sample was added to 10 ml of distilled water, heated in a water bath for 3 minutes, then filtered using a small sieve.
- Tannins: Tannins were tested by mixing 0.5 g of powdered sample with 20 ml of distilled water in a test tube, boiling for 5 minutes at 40°C, filtering through a 2-inch sieve, and then adding 0.1% ferric chloride.
- Glycosides: To detect glycosides, 1 ml of concentrated sulfuric acid was added to 5 ml of aqueous plant extract mixed with 2 ml of glacial acetic acid containing one drop of ferric chloride.
- Quantitative Phytochemical Analysis: The phytochemicals present in the aqueous leaf extract of Artemisia maciverae were quantified using standard methods.
- Total Phenols Determination: To measure total phenols, 100 mg of extract was dissolved in 100 ml of triple distilled water. Then, 1 ml of this solution was placed in a test tube, mixed with 0.5 ml of 2N Folin-Ciocalteu reagent and 1.5 ml of 20% sodium carbonate, and the volume adjusted to 8 ml with distilled water. After shaking and standing for 2 hours, absorbance was measured at 765 nm. Phenolic content was calculated using a gallic acid calibration curve.
- Total Flavonoids Determination: This method relies on forming a flavonoid-aluminum complex with peak absorbance at 415 nm. To determine total flavonoids, 100 µl of extract (10 mg/ml) was mixed with 100 µl of 20% aluminum trichloride in methanol and a drop of acetic acid, then diluted to 5 ml with methanol. Absorbance was recorded at 415 nm after 40 minutes. A blank was prepared similarly without aluminum trichloride. Rutin (0.5 mg/ml) in methanol was used as standard. Measurements were done in triplicate.
- Total Alkaloids Determination: Five grams of sample was placed in a 250 ml beaker with 200 ml of 10% acetic acid in ethanol, covered, and left for 4 hours. The mixture was filtered and concentrated by heating to one-quarter volume. Ammonium hydroxide was added dropwise until precipitation was complete. The precipitate was allowed to settle, collected, washed with dilute ammonium hydroxide, filtered, dried, and weighed [9] .
- Total Tannins Determination: Five hundred milligrams of sample was shaken with 50 ml of distilled water for 1 hour using a mechanical shaker. The mixture was filtered and diluted to 50 ml. Then, 5 ml of filtrate was mixed with 2 ml of 0.1 M ferric chloride in 0.1 N hydrochloric acid and 0.008 M potassium ferrocyanide. Absorbance was measured at 120 nm within 10 minutes.
- Determination of Total Saponins: A 20-gram sample was placed in a conical flask, and 100 cm³ of 20% aqueous ethanol was added. The mixture was heated in a water bath at approximately 55°C for 4 hours with continuous stirring. After heating, the mixture was filtered, and the residue was extracted again with 200 ml of 20% ethanol. The combined extracts were then concentrated to 40 ml using a water bath at around 90°C. This concentrate was transferred into a 250 ml separatory funnel, and 20 ml of diethyl ether was added and shaken vigorously. The aqueous layer was collected, and the ether layer was discarded. This purification step was repeated, followed by the addition of 60 ml n-butanol. The n-butanol extract was washed twice with 10 ml of 5% aqueous sodium chloride. The remaining solution was heated in a water bath, and after evaporation, the samples were dried in an oven to a constant weight. The saponin content was then calculated.
- Determination of Glycosides: The cardiac glycoside content was assessed using Buljet’s reagent. One gram of finely powdered Artemisia maciverae leaves was soaked in 10 ml of 70% alcohol for 2 hours and filtered. The extract was purified using lead acetate and Na₂HPO₄ solutions before adding freshly prepared Buljet’s reagent (95 ml aqueous picric acid mixed with 5 ml 10% aqueous NaOH). The difference in color intensity between the sample and the blank (distilled water with Buljet’s reagent) was measured as absorbance, which is proportional to the glycoside concentration.
Biochemical Assay
Column chromatography: Fractionation of G. senegalensis leaf extract was conducted with slight modifications, 15 grams of G. senegalensis extract was separated by column chromatography. The stationary phase consisted of 30 grams of silica gel (60-120 mesh), while the mobile phase used varying proportions of 100% glacial acetic acid and 100% aqueous solution (ratios from 100:0 to 0:100) with increasing polarity. The lower end of a 5.5 x 80 cm glass column was packed with glass wool. A slurry of 30 grams silica gel in 50 ml n-hexane was gently poured into the column. The solvent flow was checked and then the tap closed. The silica gel surface solvent was allowed to drain, and the column was left to stabilize for 24 hours. The sample was prepared by mixing 15 grams of extract with 20 grams silica gel in 100% glacial acetic acid and dried thoroughly. The dried mixture was topped with a small amount of silica gel and carefully added to the column. The tap was opened to maintain an elution rate of 0.58 ml/s. Elution was performed using n-hexane and ethyl acetate solvent mixtures of increasing polarity, collected sequentially in 100 ml volumes, and poured carefully along the column sides to avoid disturbing the silica gel. Fractions were collected in 10 ml aliquots in test tubes.
Thin Layer Chromatography (TLC): Analytical TLC was performed using pre-coated silica gel aluminum plates (Xtra SIL G/UV254). Small samples from each test tube were spotted about 1 cm from the plate edge and allowed to dry at room temperature (~27°C). The plates were then placed in a chromatographic jar containing the solvent system of 100% glacial acetic acid and 100% aqueous solution (8:2) with a glass lid. The solvent was allowed to ascend until it reached approximately three-quarters of the plate length. After drying, the plates were sprayed with a freshly prepared solution of 0.5 ml p-anisaldehyde in 50 ml glacial acetic acid and 1 ml 97% sulfuric acid, then heated to 105°C to visualize spots, which appeared mainly in red, purple, and orange colors. The spots were measured, and the Retention factor (Rf) values were calculated using the formula:
Sub-fractions with similar retention factor (Rf) values were combined into fractions labeled A, B, C, D, E, and F, then stored at 4°C for further analyses such as GC-MS and antibacterial testing. The same procedure was applied to the aqueous extract, which yielded two sub-fractions, G and H.
GC-MS (Gas Chromatography-Mass Spectrometry) analysis of extracts: GC-MS analysis was conducted using a SCHIMADZU GCMS-QP2010 PLUS system equipped with a DB 5-MS (0.25 × 30 m × 0.25 µm) non-polar capillary column. The gas chromatograph was connected to a mass spectrometer, operating in electron ionization mode at 70 eV. Helium (99.999% purity) was used as the carrier gas at a constant flow rate of 1 mL/min. The oven temperature program started at 45°C (held for 4 minutes), then increased by 10°C per minute to 175°C, followed by a 5°C per minute increase to 240°C, where it was held isothermally for 9 minutes. Mass spectra were recorded at 70 eV with a scanning interval of 0.5 seconds over a mass range of 40–500 Da. The total run time was 60 minutes. Relative amounts of components were calculated by comparing individual peak areas to the total chromatogram area [10].
Identification of bioactive components: Mass spectra obtained from the GC-MS were interpreted by matching unknown compounds to reference spectra in databases including the National Institute of Standards and Technology (NIST08s), WILEY8, and FAME. This allowed for identification of the names, molecular weights, and structures of the bioactive components in the samples.
Genomic DNA Extraction and PCR Amplification: Genomic DNA from Staphylococcus aureus and Escherichia coli was extracted using the AccuPrep Genomic DNA Extraction Kit (Bioneer), following the manufacturers protocol. A standard PCR assay was carried out using a Mastercycler Gradient thermal cycler and the AccuPower HotStart PCR premix (Bioneer) to detect MRSA strains. DNA was isolated from overnight cultures of Staphylococci and E. coli grown on blood agar plates, using the Bioneer extraction kit (Korea), in accordance with the provided instructions. To amplify a 276 bp fragment specific to Staphylococci, the NUC primer set was used:
Forward primer 5′-GCGATTGATGGTGATACGGTT-3′ and Reverse primer 5′-AGCCAAGCCTTGACGAACTAAAGC-3′. For E. coli detection, the UidA gene was targeted using specific primers: UidA-F 5′-TGGTAATTACCGACGAAAACGGC-3′ and UidA-R 5′-ACGCGTGGTTACAGTCTTGCG-3′ to amplify a 168 bp product. Each 25 μL PCR reaction included 1 μL of DNA (0.5 μg), 10 μL of 2x Master Mix (Ampliqon, Denmark) containing PCR buffer, 1.5 mmol/L MgCl₂, 0.15 μL dNTP mix, and 1.25 U of Taq DNA polymerase. Additionally, 0.7 μL of each primer (0.8 μmol/L) and 12.6 μL of sterile distilled water were added. The PCR conditions consisted of an initial denaturation at 94 °C for 5 minutes, followed by 35 cycles of denaturation at 94 °C for 30 seconds, annealing at 94 °C for 30 seconds, and extension at 72 °C for 30 seconds, with a final extension step at 72 °C for 5 minutes. PCR products were analyzed by electrophoresis on a 2% agarose gel stained with 5 μL ethidium bromide.
Statistical Analysis
Data were analyzed using SPSS version 25. The chi-square test was used to evaluate relationships between variables. A p-value less than 0.05 was considered statistically significant.
Bioactive Components in G. senegalensis
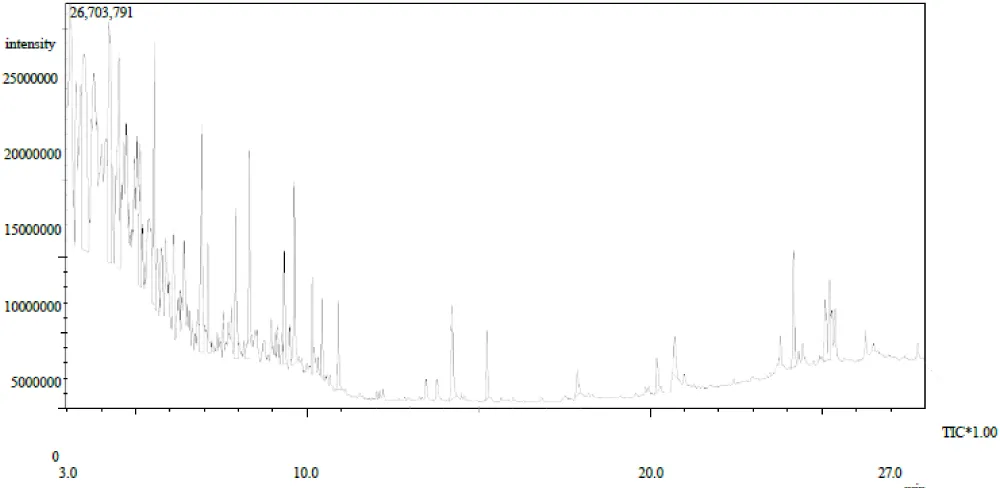
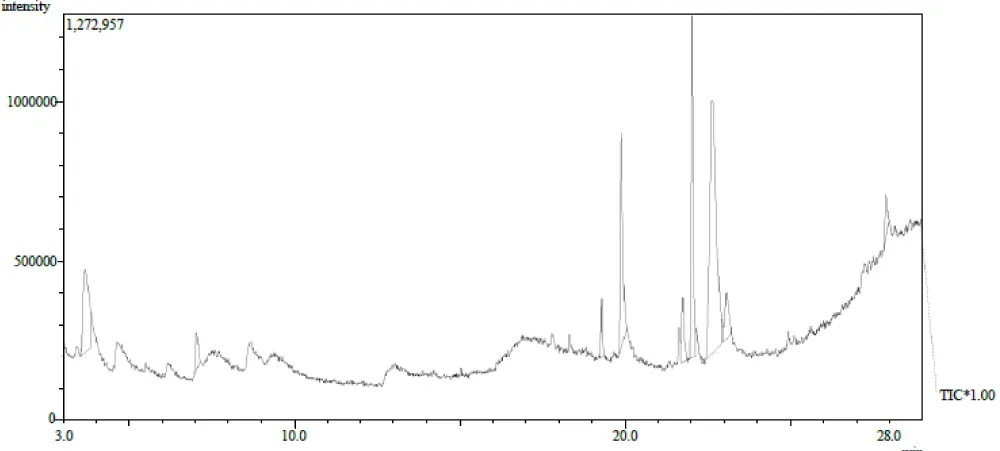
The bioactive compounds were analyzed by GC–MS system (Perkin Elmer (USA) make GC-MS instrument, Model: Clarus 680 GC & Clarus 600C MS comprising a liquid auto-sampler). The identified compounds with their retention time (RT), molecular formula, molecular weight (MW), and concentration (peak area %) for all the fractions F1, F2, and F3.
Major Bioactive Compounds Identified in F1 Ethanol Extract of G. senegalensis
GC–MS analysis of the F1 ethanol extract of G. senegalensis revealed 22 major bioactive compounds characterized by their retention time (RT), molecular formula, molecular weight (MW), and relative concentration (peak area percentage). These compounds span a range of chemical classes, predominantly aliphatic hydrocarbons, fatty acids, and aromatic compounds.
The most abundant compound detected was propylcyclohexane (C₉H₁₈), with a peak area percentage of 16.56%, followed by 2,7-dimethyloctane (C₁₀H₂₂) at 10.61%, 4-methyldecane (C₁₁H₂₄) at 9.21%, and tridecane (C₁₃H₂₈) at 9.40%. These high concentrations of alkanes suggest that they are the predominant chemical constituents in the ethanol fraction and may contribute significantly to its biological activity. Other notable hydrocarbons, such as dodecane (6.82%) and hendecane (5.19%), further contribute to the hydrophobic profile of the extract.
In addition to alkanes, fatty acids including hexadecanoic acid (palmitic acid, C₁₆H₃₂O₂) and linolenic acid (C₁₈H₃₀O₂) were identified at lower concentrations (1.34% and 1.70%, respectively). These fatty acids are known for their antioxidant and anti-inflammatory properties, suggesting a potential therapeutic benefit. Phytol (C₂₀H₄₀O), a diterpene alcohol with recognized antimicrobial and antioxidant activity, was also detected at 1.10%.
Aromatic and sulfur-containing compounds, such as (2-phenylcyclobutyl) benzene (3.68%) and (2-phenyl-3-[(phenylsulfinyl)methyl] cyclopropyl) benzene (2.22%), add chemical diversity to the extract and may be involved in specialized biological functions, including enzyme inhibition and cellular signaling modulation. Overall, the GC–MS profiling indicates that the F1 ethanol extract of G. senegalensis contains a complex mixture dominated by hydrophobic alkanes and bioactive fatty acids. This chemical composition supports the extract’s potential pharmacological effects, particularly antimicrobial, anti-inflammatory, and antioxidant activities. The distribution of compounds, with a few major constituents and several minor ones, suggests possible synergistic interactions contributing to the extract's bioactivity (Table 1).
| NO. | Phytochemical Compound | RT (Min) | Molecular Formula | Molecular Weight (g/mol) | Peak Area (%) |
| 1 | Propylcyclohexane | 3.492 | C9H18 | 126 | 16.56 |
| 2 | 2,7-Dimethyloctane | 4.217 | C10H22 | 142 | 10.61 |
| 3 | 4-Methyldecane | 4.507 | C11H24 | 156 | 9.21 |
| 4 | 3-Methyldecane | 5.130 | C11H24 | 156 | 4.13 |
| 5 | Tridecane | 5.540 | C13H28 | 184 | 9.40 |
| 6 | Dodecane | 6.915 | C12H26 | 170 | 6.82 |
| 7 | 2,6-Dimethylundecane | 7.101 | C13H28O | 184 | 2.36 |
| 8 | 2,3,7-Trimethyloctane | 7.917 | C11H24 | 156 | 3.90 |
| 9 | Hendecane | 8.294 | C11H24 | 156 | 5.19 |
| 10 | 2,6,11-Trimethyldodecane | 9.320 | C15H32 | 212 | 2.26 |
| 11 | Cetane | 9.626 | C16H34 | 226 | 4.33 |
| 12 | Cyclohexene | 10.135 | C16H24 | 204 | 2.32 |
| 13 | 3,7-Dimethyldecane | 10.420 | C12H26 | 170 | 1.62 |
| 14 | Pentadecane | 10.898 | C15H32 | 212 | 2.33 |
| 15 | (2-Phenylcyclobutyl) benzene | 14.221 | C16H16 | 208 | 3.68 |
| 16 | 1-Octadecyne | 15.241 | C18H34 | 250 | 1.97 |
| 17 | Hexadecanoic acid | 17.876 | C16H32O2 | 256 | 1.34 |
| 18 | Phytol | 20.199 | C20H40O | 296 | 1.10 |
| 19 | Linolenic acid | 20.724 | C18H30O2 | 278 | 1.70 |
| 20 | 7-Ethylcycloheptatriene | 24.190 | C9H12 | 120 | 3.83 |
| 21 | (2-Phenyl-3-[(phenylsulfinyl)methyl] cyclopropyl) benzene | 25.104 | C22H20OS | 332 | 2.22 |
| 22 | 1,2-Diphenyl-1-isocyanoethane | 25.245 | C15H13N | 207 | 3.13 |
Major Bioactive Compounds Identified in F2 Ethanol Fraction of G. Senegalensis
Table 2 presents the major bioactive compounds identified in the ethanol fraction (F2) of G. senegalensis using GC–MS analysis. A total of nine compounds were detected, with significant variation in concentration based on peak area percentages. The most abundant compounds were 8-(2-Octylcyclopropyl)-octanal (40.36%) and Pentafluoropropionic acid (40.19%), indicating their potential as key bioactive constituents in the extract. These high levels suggest they may contribute significantly to the plant’s biological activity. Linoleic acid (18.23%) was also present in a notable amount, supporting the medicinal potential of the plant due to its known anti-inflammatory and antioxidant properties. Butyl isobutyrate (12.39%) appeared as a prominent volatile ester, possibly contributing to antimicrobial or aromatic characteristics. Other minor compounds such as Methyl 11-octadecenoate (3.60%), Z-9-Tetradecenol (4.33%), and Glycerol 2-monooleate (2.15%) add to the extract’s chemical diversity, each with possible functional or therapeutic roles. Overall, the F2 ethanol fraction of G. senegalensis contains a complex mixture of fatty acids, esters, aldehydes, and alcohols, with several dominant compounds that may underlie its pharmacological effects (Table 2).
| NO. | Phytochemical Compound | RT (Min) | Molecular Formula | Molecular Weight (g/mol) | Peak Area (%) |
| 1 | Butyl isobutyrate | 3.676 | C8H16O2 | 144 | 12.39 |
| 2 | Diethylene glycol monomethyl ether | 7.157 | C5H12O3 | 120 | 1.48 |
| 3 | Methyl linolelaidate | 19.882 | C19H34O2 | 294 | 0.94 |
| 4 | Methyl 11-octadecenoate | 19.992 | C19H36O2 | 296 | 3.60 |
| 5 | 8-(2-Octylcyclopropyl) -octanal | 21.001 | C19H36O | 280 | 40.36 |
| 6 | Linoleic acid | 22.068 | C18H32O2 | 280 | 18.23 |
| 7 | Pentafluoropropionic acid | 22.686 | C16H27F5O2 | 346 | 40.19 |
| 8 | Z-9-Tetradecenol | 23.155 | C14H26O | 210 | 4.33 |
| 9 | Glycerol 2-monooleate | 27.959 | C21H40O4 | 356 | 2.15 |
Major Bioactive Compounds Identified in F3 ethanol Fraction of G. Senegalensis
Table 3 presents the major bioactive compounds identified in the F3 ethanol fraction of G. senegalensis using GC–MS analysis. A total of thirteen compounds were detected, with significant variations in concentration as indicated by peak area percentages. The most abundant compound was 2-Methyl-Z,Z-3,13-octadecadienol, accounting for 34.44% of the total peak area, suggesting it is the predominant bioactive component in the ethanol extract. This was followed by Methyl stearolate (17.96%), Methyl 11-octadecenoate (7.87%), and Hexadecanoic acid (7.60%). These compounds are primarily fatty acid esters and long-chain hydrocarbons, which are often associated with antioxidant, anti-inflammatory, and antimicrobial properties. Other notable compounds include Methyl 2-oxooctadecanoate (5.31%), Methyl tridecanoate (5.36%), and Methyl (13E,16E)-13,16-octadecadienoate (5.15%), all of which contribute to the bioactivity of the extract through their lipid-based structures. Minor constituents such as Squalene (1.12%), Erucic acid (1.15%), and Brassidic acid (2.97%) were also present (Table 3).
| NO. | Phytochemical Compound | RT (Min) | Molecular Formula | Molecular Weight (g/mol) | Peak Area (%) |
| 1 | (Z)-9-(E)-12-Tetradecadien-1-ol acetate | 12.721 | C16H28O2 | 252 | 3.23 |
| 2 | Methyl 11-octadecenoate | 13.484 | C19H36O2 | 296 | 7.87 |
| 3 | Methyl 2-oxooctadecanoate | 16.245 | C19H36O3 | 312 | 5.31 |
| 4 | Methyl tridecanoate | 16.751 | C14H28O2 | 228 | 5.36 |
| 5 | Hexadecanoic acid | 17.765 | C16H32O2 | 256 | 7.60 |
| 6 | Methyl (13E,16E)-13,16-octadecadienoate | 18.325 | C19H34O2 | 294 | 5.15 |
| 7 | 14-Methyl-14-(3-oxobutyryloxy)-hexadec-15-enoic acid | 19.047 | C22H38O5 | 382 | 4.95 |
| 8 | Methyl petroselinate | 19.885 | C19H36O2 | 296 | 2.29 |
| 9 | 2-Methyl-Z,Z-3,13-octadecadienol | 20.646 | C19H36O | 280 | 34.44 |
| 10 | Methyl stearolate | 21.180 | C19H34O2 | 294 | 17.96 |
| 11 | Brassidic acid | 23.744 | C22H42O2 | 338 | 2.97 |
| 12 | Erucic acid | 26.010 | C22H42O2 | 338 | 1.15 |
| 13 | Squalene | 26.954 | C30H50 | 410 | 1.12 |
Quantitative Phytochemical Analyses of Ethanol Extracts of G. senegalensis
Table 4 presents the concentrations of selected phytochemicals extracted using aqueous and ethanol solvents, measured in mg/g of dry weight. The results indicate variation in phytochemical yield based on the solvent used.
| S/N | Phytochemical | Aqueous (mg/g dry wt) | Ethanol (mg/g dry wt) |
| 1 | Flavonoids | 5.17 ± 1.12 | 5.27 ± 0.52 |
| 2 | Alkaloids | 2.04 ± 0.98 | 3.78 ± 1.76 |
| 3 | Phenols | 6.18 ± 0.25 | 11.62 ± 1.20 |
| 4 | Saponins | 3.93 ± 1.20 | 4.75 ± 0.13 |
| 5 | Tannins | 3.56 ± 1.14 | 4.87 ± 0.32 |
| 6 | Terpenoids | 1.52 ± 0.46 | 1.75 ± 1.25 |
Flavonoid content was relatively similar between the aqueous (5.17 ± 1.12 mg/g) and ethanol (5.27 ± 0.52 mg/g) extracts, with ethanol yielding slightly higher and more consistent results. Alkaloids were significantly more concentrated in the ethanol extract (3.78 ± 1.76 mg/g) compared to the aqueous extract (2.04 ± 0.98 mg/g), suggesting that ethanol is a more effective solvent for alkaloid extraction. Phenolic compounds showed the highest differential, with the ethanol extract (11.62 ± 1.20 mg/g) nearly doubling the phenol concentration found in the aqueous extract (6.18 ± 0.25 mg/g). This trend was also observed for saponins and tannins, both of which had higher concentrations in the ethanol extract (4.75 ± 0.13 mg/g and 4.87 ± 0.32 mg/g, respectively) than in the aqueous extract (3.93 ± 1.20 mg/g and 3.56 ± 1.14 mg/g, respectively). Terpenoid concentrations were relatively low in both extracts, with slightly higher values in the ethanol extract (1.75 ± 1.25 mg/g) than in the aqueous extract (1.52 ± 0.46 mg/g), although the variability was notably greater in the ethanol sample (Table 4).
Molecular Identification of Escherichia coli (EC) Isolate
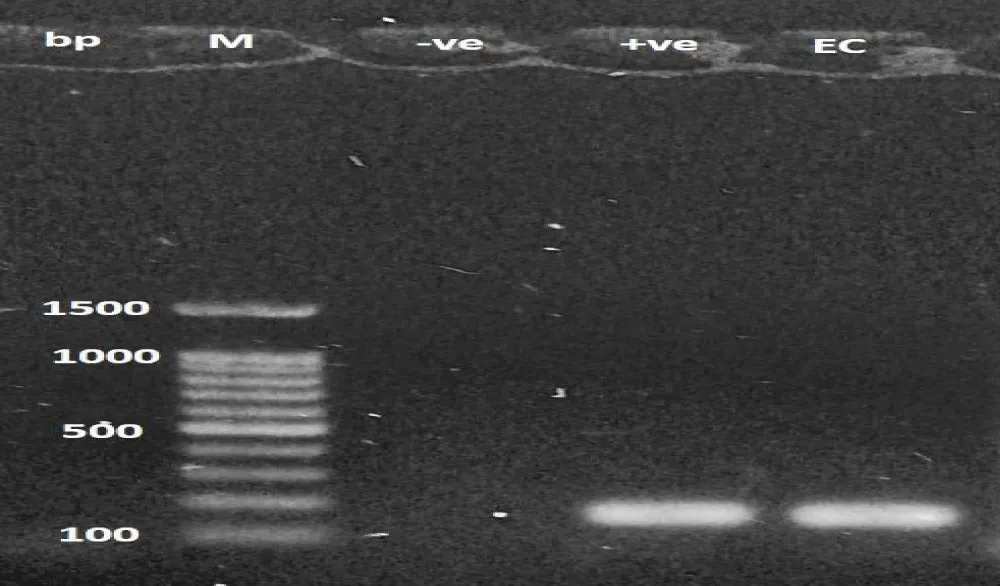
The gel electrophoresis results (Plate 1) were analyzed to confirm the presence of Escherichia coli (EC) using a primer specific gene. A 100 bp DNA ladder (labeled as M) was used as a molecular weight marker to estimate the size of amplified DNA fragments. The positive control (+ve), containing DNA from a known E. coli strain, displayed a distinct band at approximately 200 base pairs (bp), confirming successful amplification of the target gene and proper functioning of the PCR and electrophoresis procedures. Similarly, the test sample labeled EC also exhibited a clear DNA band at approximately 200 bp, aligning with both the positive control and the 200 bp marker on the DNA ladder (Plate 1).
Molecular Identification of Staphylococcus aureus Isolate
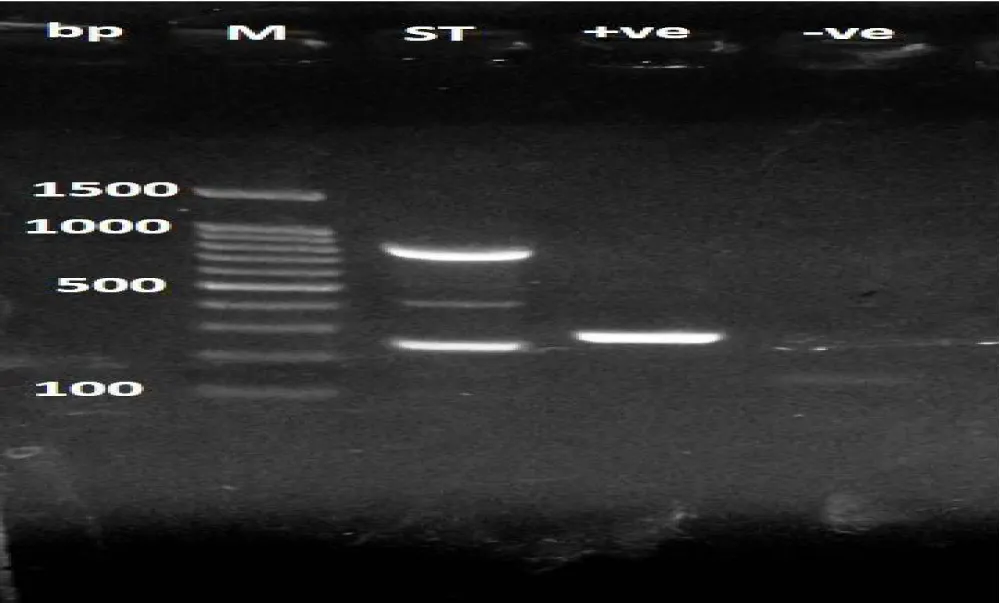
A gel electrophoresis was performed to detect the presence of Staphylococcus aureus (ST) using a species-specific primer targeting a ~200 base pair (bp) region. A 100 bp DNA ladder was used as the molecular weight marker (Lane M). The lanes included a positive control (+ve), experimental control (EC), and a negative control (–ve) (Plate 2).
Discussion
This study demonstrates that Guiera senegalensis contains a diverse range of bioactive phytochemicals across different solvent fractions, supporting its traditional medicinal use. GC–MS analysis of the ethanol fraction (F1) revealed predominantly aliphatic hydrocarbons, fatty acids, and aromatic compounds. The presence of propylcyclohexane, dimethyloctane, tridecane, and other long-chain hydrocarbons aligns with previous reports on related species, where such compounds have been associated with antimicrobial activity through membrane disruption and oxidative stress modulation. The detection of palmitic acid, linolenic acid, and phytol further strengthens this observation, as these compounds are widely documented for anti-inflammatory, antioxidant, and antimicrobial properties [11-13].
The aqueous F1 fraction was characterized by a high concentration of fatty acid methyl esters, particularly methyl n-octadecanoate and methyl linolelaidate. These lipid-derived compounds are frequently reported in medicinal plants with antimicrobial and wound-healing applications. The predominance of methyl stearate supports earlier findings that fatty acid esters contribute significantly to antibacterial activity [14].
Notably, the F2 ethanol fraction contained substantial amounts of 8-(2-octylcyclopropyl)-octanal and pentafluoropropionic acid derivatives. These compounds are rarely reported in phytochemical studies, suggesting possible chemotypic variation or previously underexplored metabolites in G. senegalensis. The high abundance of squalene in the aqueous fraction is particularly significant, as squalene is a recognized antioxidant and anticancer agent. Its presence in large proportion distinguishes this extract and supports potential pharmaceutical relevance [15,16].
Qualitative and quantitative analyses confirmed that ethanol was more efficient in extracting phenols, alkaloids, tannins, and saponins, consistent with established literature on solvent polarity and phytochemical yield [17-19].
Molecular characterization using PCR produced distinct ~200 bp amplicons for Escherichia coli, consistent with established diagnostic protocols targeting species-specific genes [20-23]. The clear band patterns and absence of non-specific amplification validate the reliability of the identification process [24-27].
Overall, the combined phytochemical richness and confirmed microbial profiling underscore the therapeutic promise of Guiera senegalensis. The identification of uncommon constituents alongside established bioactive compounds highlights both the novelty and pharmacological significance of this study.
Conclusion
The increasing global prevalence of antibiotic-resistant bacterial strains, particularly Escherichia coli and Staphylococcus aureus, represents a critical threat to public health. Gas chromatography–mass spectrometry (GC-MS) analysis revealed diverse bioactive constituents, including fatty acids, esters, long-chain alcohols, and hydrocarbons with known antimicrobial, antioxidant, and anti-inflammatory properties.
Molecular characterization using PCR further validated the presence of E. coli and S. aureus, affirming the microbiological accuracy of the antibacterial assays. Collectively, these findings support the ethnomedicinal and pharmacological potentials of G. senegalensis
Recommendation
Further pharmacological studies should be conducted to evaluate the specific antimicrobial, anti-inflammatory, and antioxidant activities of the identified compounds using both in vitro and in vivo models. The major bioactive constituents, including squalene, methyl n-octadecanoate, and 8-(2-octylcyclopropyl)-octanal, should be isolated and structurally characterized to determine their individual and possible synergistic effects. Acute and chronic toxicity studies are necessary to establish safety profiles and appropriate therapeutic dosage ranges. Investigations into the molecular mechanisms of action against Escherichia coli and Staphylococcus aureus are also recommended. Standardized extraction protocols should be developed to ensure consistency and reproducibility. Additionally, formulation development and preclinical evaluation are needed to facilitate potential clinical application.