 CrossRef
 CrossMark
 Mendeley
 Scholar
Introduction
Abdominal obesity-defined by the International Diabetes Federation (IDF) as waist circumference ≥ 90 cm in Asian males and ≥ 80 cm in Asian females-constitutes a primary risk factor for type 2 diabetes mellitus, cardiovascular disease, and metabolic syndrome [1]. In Thailand, the prevalence of abdominal obesity exceeds 30% among working-age adults, driven by urbanization and dietary transition [2]. Conventional screening relies on Fasting Blood Sugar (FBS) and Glycated Hemoglobin (HbA1c), both of which capture only static snapshots of glucose homeostasis. Continuous Glucose Monitoring (CGM) records interstitial glucose at 5 - 15-minute intervals over 10 - 14 days, thereby revealing dynamic glycemic patterns invisible to point-of-care testing [3]. Hall H, et al. [4] demonstrated that non-diabetic individuals could be classified into three glucotypes using spectral clustering, with the severe glucotype exhibiting insulin resistance markers comparable to those observed in prediabetic individuals despite normal FBS levels.
However, no study has examined CGM-based phenotyping specifically in non-diabetic populations with abdominal obesity in Southeast Asia-a population characterized by distinct metabolic risk profiles [5,6]. Moreover, the reproducibility of glucotype classification across independent cohorts has not been validated.
The present study addresses these gaps through a two-stage design comprising a discovery cohort (n = 104) and a validation cohort (n = 148), applying K-means clustering to 14-day CGM recordings from Thai adults with central obesity. Sensitivity analyses varying feature sets and sample composition were additionally conducted to assess the robustness of the identified glucotypes.
Methods
Study design and participants
This cross-sectional study analyzed data from two sequential cohorts enrolled in a structured lifestyle modification program in Thailand. The discovery cohort (n = 104) was recruited between October and December 2025, and the validation cohort comprised an expanded sample (n = 199 total extractions) recruited through March 2026. Inclusion criteria were age 18 - 65 years with central obesity per IDF Asian-specific criteria (waist circumference ≥ 90 cm for males, ≥ 80 cm for females). Exclusion criteria included diagnosed diabetes requiring glucose-lowering medication, pregnancy, severe hepatic or renal disease, and CGM data completeness below 80%. Six participants with TAR > 30% were excluded from the primary analysis as probable undiagnosed diabetes cases (mean HbA1c 7.0%), yielding a validation analysis set of n = 148 (4-feature analysis) and n = 193 (2-feature sensitivity analysis).Prediabetes was defined according to the American Diabetes Association (ADA) 2024 Standards of Care as HbA1c 5.7 - 6.4% and/or fasting blood sugar 100 - 125 mg/dL [7].
CGM device
CGM was performed using the Ottai M8 sensor (Ottai Health Technology Co., Ltd.), a factory-calibrated interstitial glucose monitoring device employing glucose oxidase-based electrochemical technology. Technical specifications include a measurement range of 40 - 400 mg/dL, a sampling interval of 5 minutes, and an operational period of 14 days. The device has received regulatory clearance from the Thai Food and Drug Administration (Thai FDA). Although the Ottai M8 utilizes the same core electrochemical methodology employed by established CGM systems (e.g., FreeStyle Libre, Dexcom G6), a formal peer-reviewed Mean Absolute Relative Difference (MARD) validation study has not yet been published for this specific device. This limitation is addressed in the Strengths and Limitations section. Data quality was ensured through automated quality control, requiring ≥ 80% data completeness per participant.
CGM metrics and clustering
An automated Python pipeline extracted daily metrics from CGM reports. Four features were selected for clustering: time above range (TAR%, defined as the percentage of readings > 140 mg/dL), time below range (TBR%, defined as the percentage of readings < 70 mg/dL), Standard Deviation (SD) of daily glucose averages (mg/dL), and mean daily glucose range (daily maximum minus minimum, in mg/dL). All features were z-score standardized prior to clustering.
Feature selection rationale
K-means++ clustering (scikit-learn v1.6, 50 random initializations) was applied, with the optimal number of clusters (K) determined by convergence of the silhouette score, Calinski-Harabasz index, and Davies-Bouldin index. Cluster stability was assessed through 1,000 bootstrap iterations and cross-validated against hierarchical clustering with Ward linkage.
Statistical analysis
Between-cluster differences were assessed using Kruskal-Wallis tests with Bonferroni-corrected Mann-Whitney U post-hoc comparisons. Effect sizes were quantified using eta-squared (η²) and Cohen’s d. Linear Discriminant Analysis (LDA) with 5-fold cross-validation evaluated classification accuracy. The incremental value of CGM-derived features was assessed by comparing logistic regression models using clinical variables alone versus models incorporating CGM features. Relative Risk (RR) and Number Needed to Screen (NNS) were calculated for prediabetes prevalence across glucotypes. All statistical analyses were performed using Python 3.11 with scipy, scikit-learn, and statsmodels.
Results
Participant characteristics
The primary analysis included 148 participants (88% female, mean age 46.3 ± 8.7 years, BMI 23.5 ± 5.4 kg/m²). The sensitivity analysis included 193 participants with similar demographics. Six participants excluded for probable undiagnosed diabetes had a mean TAR of 59.0%, HbA1c of 7.0%, and BMI of 30.3 kg/m², confirming the appropriateness of their exclusion.
Cluster determination and validation
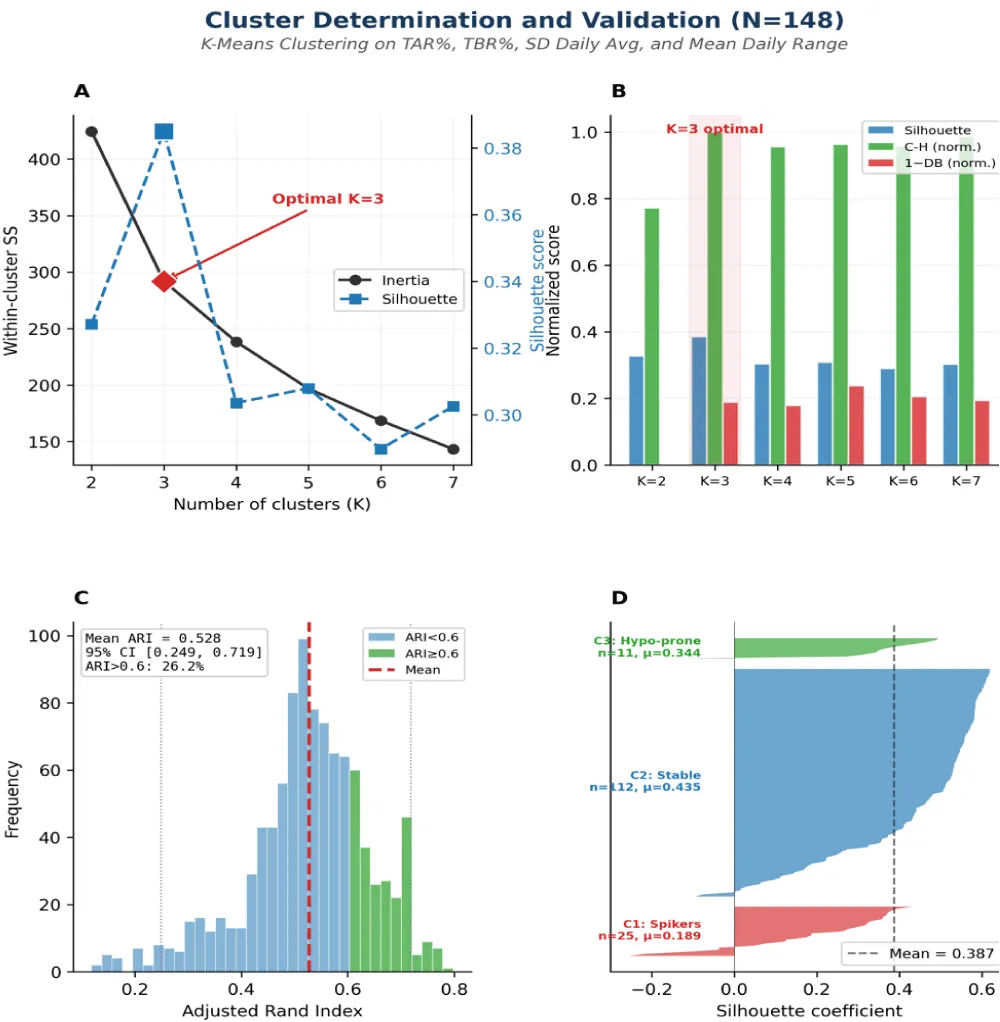
Internal validation indices converged on K = 3 (Figure 1). The silhouette score was 0.385, the Calinski-Harabasz index was 74.6, and the Davies-Bouldin index was 0.994. Bootstrap stability yielded a mean Adjusted Rand Index (ARI) of 0.732 (95% CI: 0.332 – 0.977), with 78.6% of iterations exceeding ARI = 0.60. Agreement between K-means and hierarchical clustering was strong (ARI = 0.867) (Figure 1).
Glucotype characterization
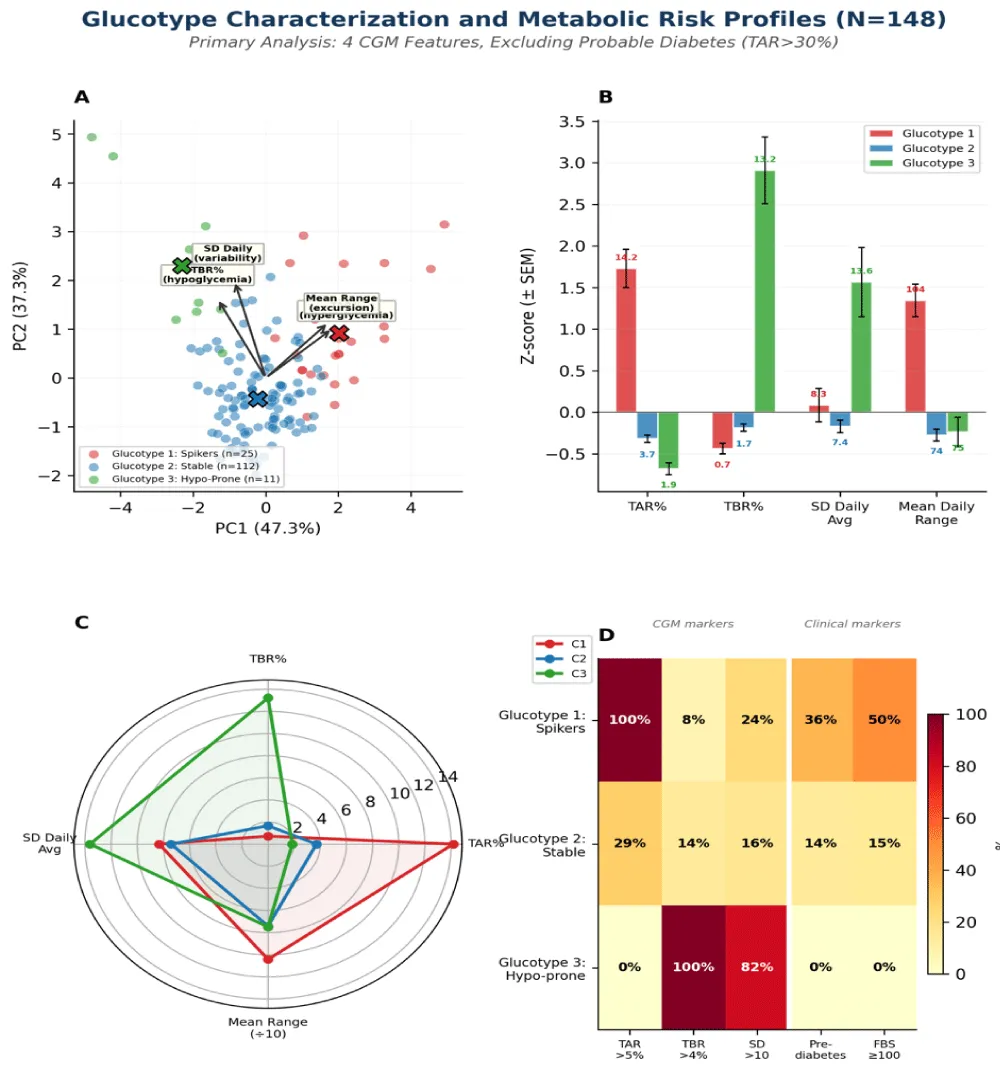
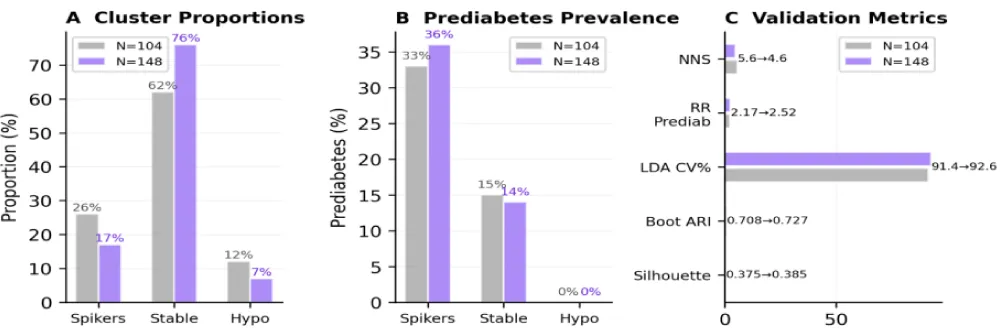
Glucotype 1: Postprandial Spikers(n = 25, 17%). This glucotype exhibited the highest TAR (14.2 ± 5.9%), widest mean daily range (104.2 ± 18.2 mg/dL), and maximum glucose of 240.4 mg/dL. HbA1c was 5.8 ± 0.6%, with 36% meeting prediabetes criteria.
Glucotype 2: Stable Glucose(n = 112, 76%). This group demonstrated well-controlled glycemia across all metrics: TAR 3.7 ± 2.3%, TBR 1.7 ± 1.7%, and daily range 74.1 ± 14.3 mg/dL. This represented the metabolically stable phenotype.
Glucotype 3: Hypoglycemia-Prone(n = 11, 7%). This cluster was characterized by elevated TBR (13.2 ± 5.0%), extreme day-to-day variability (SD = 13.6 ± 4.9 mg/dL), the lowest BMI (21.0 ± 3.7 kg/m²), and zero prediabetes. The glycemic profile of this cluster is consistent with reactive hypoglycemia, although this attribution remains a clinical hypothesis in the absence of concurrent insulin measurements, C-peptide assays, or meal timing data (see Limitations) (Figure 2) (Table 1).
| Variable | Spikers(n = 25) | Stable(n = 112) | Hypo-Prone (n = 11) | p - value |
| CGM metrics | ||||
| TAR, % | 14.2 ± 5.9 | 3.7 ± 2.3 | 1.9 ± 1.2 | <0.001*** |
| TBR, % | 0.7 ± 1.2 | 1.7 ± 1.7 | 13.2 ± 5.0 | <0.001*** |
| SD daily avg, mg/dL | 8.3 ± 3.6 | 7.4 ± 2.8 | 13.6 ± 4.9 | <0.001*** |
| Mean daily range, mg/dL | 104.2 ± 18.2 | 74.1 ± 14.3 | 74.8 ± 10.8 | <0.001*** |
| Demographics | ||||
| Age, years | 50.4 ± 10.5 | 45.8 ± 8.1 | 42.7 ± 6.6 | 0.036* |
| BMI, kg/m² | 26.3 ± 6.6 | 23.3 ± 5.1 | 21.0 ± 3.7 | 0.021* |
| Waist, cm (in) | 87.9 ± 17.8 (34.6 ± 7.0) | 78.5 ± 13.2 (30.9 ± 5.2) | 73.7 ± 9.7 (29.0 ± 3.8) | 0.021* |
| Laboratory values | ||||
| HbA1c, % | 5.8 ± 0.6 | 5.4 ± 0.5 | 4.9 ± 0.1 | 0.005** |
| FBS, mg/dL | 98.2 ± 16.1 | 88.7 ± 11.8 | 88.3 ± 3.3 | 0.186 |
| Metabolic risk | ||||
| Prediabetes, n (%) | 9 (36%) | 16 (14%) | 0 (0%) | 0.010* |
*p < 0.05, **p < 0.01, ***p < 0.001 |
||||
Clinical-metabolic associationsx
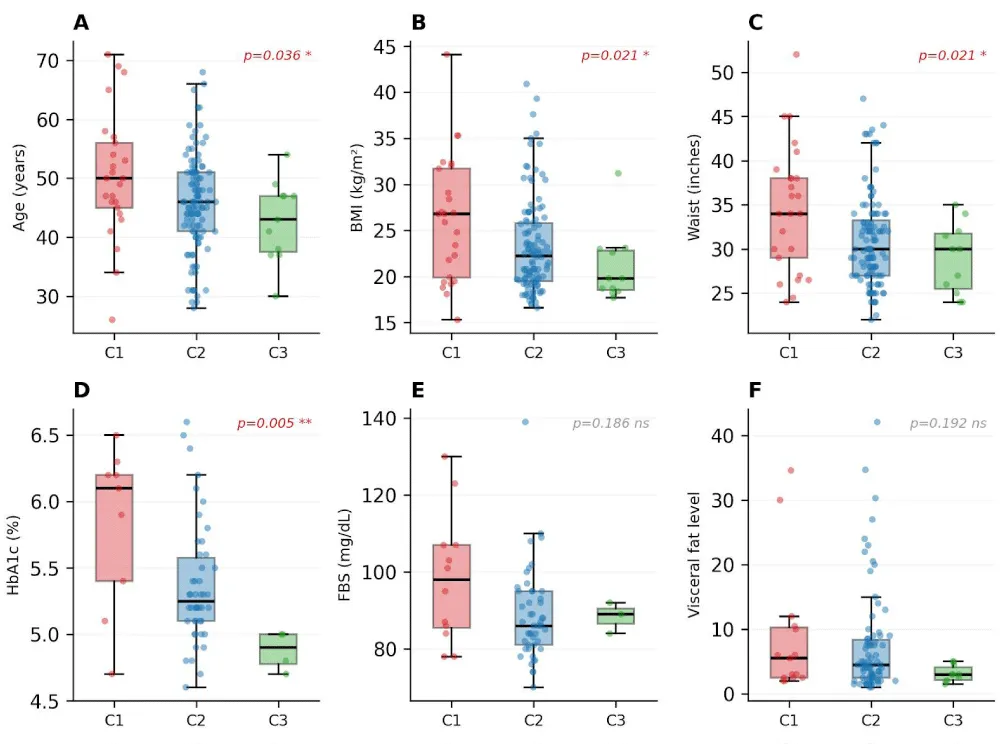
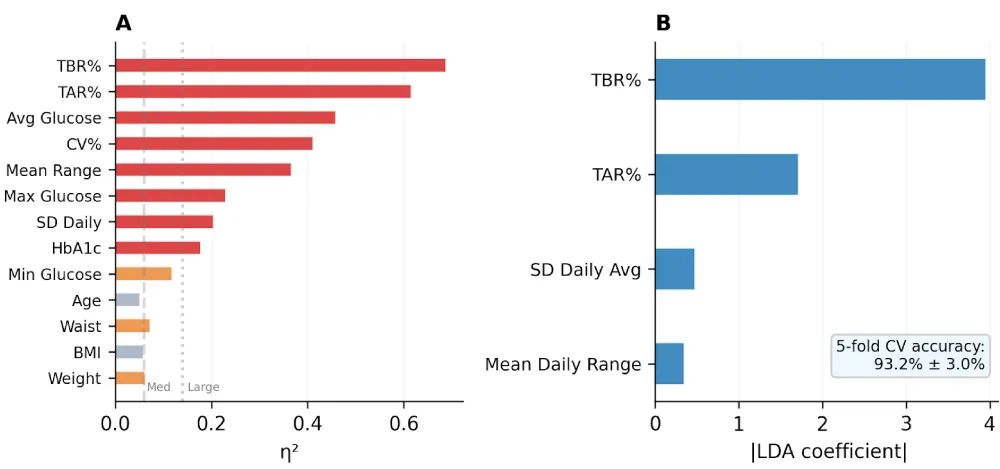
Glucotype 1 (Spikers) exhibited significantly higher HbA1c (5.8%, p = 0.005), BMI (26.3 kg/m², p = 0.021), waist circumference (87.9 cm, p = 0.021), and prediabetes prevalence (36%, χ² p = 0.010) compared with other glucotypes (Figure 3). The relative risk of prediabetes in Spikers versus Stable was 2.52 (absolute risk difference 21.7%; NNS = 4.6). Effect sizes were large (η² > 0.14) for all CGM variables, with TBR% showing the largest effect (0.688). LDA achieved 92.6% cross-validated accuracy, with TBR% as the most discriminating feature (Figure 4). Clinical variables alone predicted cluster membership at 73.6%-a19-percentage-point gap that confirms the independent contribution of CGM-derived features (Figures 3,4).
Cross-dataset replication and sensitivity analysis
The three-glucotype structure was replicated across the discovery cohort (n = 104) and validation cohort (n = 148) with remarkable consistency (Figure 5). Prediabetes prevalence in the Spikers group was 33% in the discovery cohort and 36% in the validation cohort; in the Hypoglycemia-Prone group, it was 0% in both cohorts. Silhouette scores (0.375 vs. 0.385), bootstrap ARI (0.708 vs. 0.727), and LDA accuracy (91.4% vs. 92.6%) were closely comparable. Sensitivity analysis using only TAR% and TBR% (n = 193) confirmed the same glucotype architecture (Silhouette = 0.544, ARI = 0.791), with cluster proportions of 17% Spikers, 75% Stable, and 8% Hypoglycemia-Prone-demonstrating robustness across both feature sets and sample sizes (Figure 5).
Discussion
This study demonstrates that machine learning analysis of CGM data identifies three reproducible and clinically meaningful glucotypes in Thai adults with central obesity, confirmed across two independent cohorts and multiple analytical approaches. To our knowledge, this is the first study to validate CGM-based glucotype classification through cross-dataset replication in a Southeast Asian population.
Replication strengthens the evidence base
The consistency of findings across the discovery (n = 104) and validation (n = 148) cohorts is noteworthy. The Spikers phenotype showed prediabetes prevalence of 33 - 36% in both cohorts, with HbA1c consistently elevated (5.7 - 5.8%) and relative risk exceeding 2.0. The Hypoglycemia-Prone phenotype maintained its paradoxical profile-extreme glycemic variability with zero prediabetes-in both datasets. This reproducibility directly addresses a key limitation of exploratory clustering studies: the risk that identified patterns are merely artifacts of a single sample.
Cluster robustness and the silhouette score
The silhouette score of 0.385 in the primary analysis reflects moderate geometric cluster separation, which warrants contextualization. Biological phenotypes exist along a continuum rather than as discrete, well-separated categories; accordingly, silhouette scores in the range of 0.25 - 0.50 are commonly reported and considered acceptable in clinical clustering studies [8,9]. By comparison, the foundational glucotype study by Hall H, et al. [4] did not report a silhouette score. Importantly, cluster determination in the present study relied not on a single metric but on the convergence of three complementary indices-the silhouette score, the Calinski-Harabasz index, and the Davies -Bouldin index-all of which converged on K = 3 as the optimal solution. Bootstrap stability (mean ARI = 0.732; 78.6% of iterations exceeding ARI = 0.60) and strong agreement with hierarchical clustering (ARI = 0.867) provide additional confidence in the robustness of the solution. Furthermore, the reduced 2-feature model (TAR% and TBR% only) yielded a substantially higher silhouette score of 0.544 while recovering the identical glucotype structure, suggesting that the moderate score observed in the 4-feature model reflects the additional dimensionality rather than intrinsically poor cluster quality. Finally, the three clusters demonstrated highly significant differences across clinical outcomes-HbA1c (p = 0.005), prediabetes prevalence (p = 0.010), and all CGM metrics (p < 0.001) with large effect sizes (η² > 0.14) - providing real-world clinical validation that complements the geometric metrics.
Glucotypes in the context of thai metabolic health
Thailand faces an escalating metabolic crisis, with diabetes prevalence projected to reach 11.3% by 2045 [1]. The identification of the Spikers glucotype (17 - 26%) is particularly relevant: over one-third of individuals in this group met prediabetes criteria, yet they would not have been flagged by BMI or waist circumference alone. The predominance of postprandial hyperglycemia aligns with accumulating evidence that Asian populations exhibit greater glucose excursions, attributable to carbohydrate-dense diets and comparatively lower insulin secretory capacity [5,6].
The predominance of the stable glucose phenotype
The Stable Glucose group comprised 62 - 76% of participants, consistent with the approximately 50% low-variability glucotype reported by Hall H, et al. [1]. This proportion reflects the health-conscious, predominantly female, non-diabetic composition of the cohort. Importantly, even within this apparently healthy population, CGM identified 24 - 38% harboring occult glycemic abnormalities that would have been undetectable by conventional screening methods.
The hypoglycemia-prone phenotype
The Hypoglycemia-Prone cluster (7 - 14% of participants) demonstrated TBR values of 9.1 - 13.2%, zero prediabetes, and the lowest BMI across all glucotypes. The glycemic profile of this cluster-elevated TBR, extreme day-to-day variability, low BMI, and absence of hyperglycemia-is consistent with reactive hypoglycemia. Potential underlying mechanisms include enhanced insulin sensitivity with exaggerated postprandial insulin responses, irregular meal timing, or a metabolically obese normal-weight phenotype [10]. However, this attribution remains a clinical hypothesis. Definitive mechanistic classification would require concurrent insulin level measurements, C- peptide assays, detailed meal timing logs, and/or Oral Glucose Tolerance Testing (OGTT) with extended glucose monitoring-none of which were available in the present study. This phenotype was replicated across both cohorts and warrants further investigation, given that recurrent hypoglycemia carries risks of cognitive impairment and, paradoxically, increased future diabetes risk.
Implications for national health policy
These findings support the integration of CGM into national diabetes prevention programs. The improved NNS of 4.6 (compared with 5.6 in the discovery cohort) indicates that for approximately every 5 CGM screenings, one additional prediabetes case is identified beyond what would be detected by targeting stable-pattern individuals alone. The automated and scalable methodology using consumer-grade devices supports broader deployment across Southeast Asia [11].
Strengths and limitations
Key strengths of this study include cross-dataset replication across two independent cohorts, multiple sensitivity analyses varying both feature sets and sample composition, rigorous validation employing bootstrap resampling and hierarchical clustering cross-validation, and the use of convergent internal validation indices for cluster determination.
Several limitations warrant acknowledgment. First, the Ottai M8 CGM sensor, while employing standard glucose oxidase-based electrochemical technology and holding Thai FDA clearance, lacks a published peer-reviewed MARD validation study comparing its performance against established CGM devices (e.g., FreeStyle Libre, Dexcom G6). The cross-cohort reproducibility of identical glucotype structures provides indirect support for data reliability; nevertheless, a formal validation study against reference devices is warranted.
Second, the attribution of the Hypoglycemia-Prone phenotype to reactive hypoglycemia is a clinical hypothesis based on the observed glycemic profile. Confirmation of the underlying mechanism requires concurrent insulin measurements, C-peptide assays, detailed meal timing data, and oral glucose tolerance testing-none of which were available in this study.
Third, the Hypoglycemia-Prone cluster contained only 11 participants in the validation cohort (7%), which limits statistical power for subgroup-specific analyses. Although this phenotype was independently replicated across both cohorts and the sensitivity analysis, findings pertaining to this cluster should be interpreted as hypothesis-generating. Larger, prospective studies are needed to confirm the prevalence, stability, and clinical significance of this phenotype.
Fourth, the study population was predominantly female (88%), reflecting the recruitment setting-a lifestyle modification program in which female participation consistently exceeds that of males. Sex-specific differences in glucose metabolism, body fat distribution, and insulin sensitivity may influence glucotype distributions and clinical correlates in ways that the present cohort cannot fully capture. The identified glucotypes and their associated risk profiles may not generalize directly to male or mixed-sex populations. Future studies should actively recruit sex-balanced cohorts or conduct sex-stratified analyses to determine whether the identified glucotypes are consistent across sexes.
Fifth, the cross-sectional study design precludes conclusions regarding causality, temporal stability of glucotype assignments, or prediction of future diabetes risk. The observed differences in prediabetes prevalence across glucotypes represent associations at a single time point, not predictive estimates. Longitudinal follow-up studies are needed to determine whether the Spikers glucotype predicts incident diabetes and whether glucotype classification remains stable over time.
Additional limitations include incomplete laboratory data availability (approximately 40% of participants) and reliance on daily summary statistics rather than raw 5-minute interstitial glucose data, which precluded calculation of MAGE. The six probable diabetes cases that were excluded merit investigation as a potential fourth glucotype in larger studies.
Conclusions
Three reproducible glucotypes-Postprandial Spikers (17 - 26%), Stable Glucose (62 - 76%), and Hypoglycemia-Prone (7 - 14%)-were identified and validated across two independent cohorts of Thai adults with central obesity. Cross-dataset replication confirmed significant differences in HbA1c, prediabetes prevalence, and clinical risk markers. The consistent identification of hidden metabolic heterogeneity within ostensibly low-risk populations supports the deployment of CGM as a precision health tool for diabetes prevention across Southeast Asia.
Future studies should incorporate concurrent insulin measurements, C-peptide assays, and detailed meal timing data to elucidate the mechanistic basis of the Hypoglycemia-Prone phenotype. Prospective longitudinal designs with sex-balanced cohorts are recommended to assess the temporal stability of glucotype classifications and their predictive value for incident diabetes [12-16].
Declarations
Ethics approval
This study was approved by the institutional review board. All participants provided written informed consent.
Acknowledgments
The authors gratefully acknowledge Dr. Gittipat Thaweepkul for invaluable mentorship. We thank the research team and all volunteers who contributed their CGM data.
Author contributions
NV: Conceptualization, Methodology, Formal analysis, Writing-original draft, Supervision. PW: Pharmaceutical consultation. SP: Methodology, Validation, Writing-review & editing. RJ, SH, CS, CJ, PT: Data collection, CGM monitoring, Participant recruitment.
Competing interests
The authors declare no competing interests.
Funding
No specific funding was received for this study.