General Science Group. 2024 February 29;5(2):221-226. doi: 10.37871/jbres1885.
Temporal Coherence in the Synchronization of Brain Electrical Activity Patterns: An Application with the RMS Fluctuation Function
Florencio Mendes Oliveira Filho1* and Gilney Figueira Zebende2
2Earth Sciences and Environment Modeling Program, State University of Feira de Santana, Feira de Santana, BA, Brazil
- Electroencephalogram (EEG)
- Time series
- RMS fluctuation function
Abstract
In this article, we performed a preliminary test with the mean square fluctuation (RMS) function, using EEG data, in which the task consisted of the response given to the real/imagined motor stimulus. All steps, up to the configuration of the RMS function, relied on information from subject S010, available in the Physionet database. We analyzed 12 of the 64 channels and four stimuli. We evaluated the amplitude of channels 32 and 37 in relation to the others (11, 22, 24, 43, 44, 49, 54, 61, 63 and 64). We quantitatively observed similarities when the brain perfoRMS the same real/imagined motor task, and that the timing of the amplitude changes with increasing n scale (time scales). In all experiments (S010R03, S010I03, S010R04, S010I04, S010R05, S010I05, S010R06 and S010I06), channels 32 x 22(∆logF32,22) and 37 x 24 (∆logF37,24), for n > 100 (60 seconds), were smaller than the others, showing so channels 32 and 37 (left/right hemisphere) have the greatest fluctuation and differences between them. From data processing (.EDF) to visualization of the curves (FDFA / ∆log), we concluded that it is possible to replicate the test with more channels and subjects, as well as investigate other types of activities of the human brain with signals extracted from the EEG.
Introduction
Brain coherence refers to the synchronization and organization of patterns of electrical activity in the brain, demonstrating efficient communication between different brain regions [1-3]. This phenomenon is crucial for the proper functioning of the nervous system, allowing the integration of information and the execution of complex tasks. Coherence is often measured using techniques such as Electroencephalography (EEG), which record electrical fluctuations in the brain [4-8].
Autocorrelation techniques were applied to a dataset with 64-channel EEG recordings obtained from 109 volunteers who performed different motor tasks to understand the scaling process with the Detrended Fluctuation Analysis (DFA) method. The study sought to assess how correlated two regions of the brain were on the same scale, taking into account the amplitude of the fluctuation. The relationship was measured in frequency (Hz) and time (seconds) [1].
The first results with the RMS function sought to evaluate four EEG channels (32, 37, 49 and 54) for the response. The results revealed self-affinity on a specific time scale and a visible transition around n = 656 (t = 4.1s), corresponding to a time interval between two rest periods in the experiments [1]. A second study sought to investigate the reading process, about which little was known until then regarding its evaluation using the RMS function. The experiment involved the participation of two subjects, one received prior information (trained brain) and the other did not. The trained participant took approximately 3.00 minutes to complete the task, while the untrained subject took approximately 3.23 minutes. The entire cognitive stimulus extraction process used a 22-channel EEG, choosing 11 bioelectrodes located in the frontal, parietal, temporal and occipital regions of the brain. The results show that there is a clear differentiation between the experiments, the autocorrelation function is more concentrated for the subject who did not have the brain trained, although there is a clear separation between the data from the subject with the trained brain and the subjects with the untrained brain. Trained for time scales n < 128 ( f > 1 Hz) [2]. A third study, the most recent (2023), tested the root mean square fluctuation (RMS) function, highlighting the importance of understanding it in assessing the extent of brain damage and solutions such as rehabilitation or limb replacement using bionic prostheses [9]. Specifically, this study tested the amplitude of the RMS/∆log fluctuation and also the cross-correlation ρDCCA [1,10]. For the set of results presented by the first publications, they showed that interpreting brain coherence in more depth becomes essential, as it allows contributing to investigations of new approaches, as well as different neurological conditions.
In this sense, this study seeks to address all stages of the recent mean square fluctuation (RMS) function with the purpose of configuring the algorithm and testing it on new bases. All steps and understanding of this test in this article are organized as follows: a Materials and Methods section, with basic information and description of the DFA models and the root mean square (RMS) fluctuation function. A Results and Discussion section with the proposed test of the mean square fluctuation (RMS) function and, finally, our conclusions.
Materials and Methods
Database
All series analyzed in this test were taken from the database available at https://physionet. org/pn4/eegmmidb/. A subject (S010) was randomly selected from this bank, we in- cluded the experiments: S010R03, S010I03, S010R04, S010I04 S010R05, S010I05, S010R06 e S010I06, in a group of three experiments per subject, these representing the first of the three. The experimental protocol can be seen in the table 1.
| Table 1: Experimental protocol with details of motor tasks: real/imaginary. | ||
| Tasks | Essay | Experimental Description |
| 1 | Open and close your left or right fist. | A target appears on the left or right side of the screen. The subject opens and closes the corresponding fist until the target disap- pears. Then the subject relaxes. |
| 2 | Imagine opening and closing your left or right fist. | A target appears on the left or right side of the screen. The subject imagines opening and closing the corresponding fist until the target disappears. Then the subject relaxes. |
| 3 | Open and close either fists or both feet. | A target appears on the left or right side of the screen. The subject imagines opening and closing the corresponding fist until the target disappears. Then the subject relaxes. |
| 4 | Imagine opening and closing either fists or both feet. | A target appears at the top or bottom of the screen. The subject imagines opening and closing both fists (if the target is up) and both feet (if the target is down) until the target disappears. Then the subject relaxes. |
The data available by the bank is in the EDF format (European Data Format) containing 64 channels, each with a sample rate of 0.00625 seconds, and a reference channel. For this test with the RMS fluctuation function, we chose channels 11, 22, 24, 32, 37, 43, 44, 49, 54, 61, 63 and 64. 32 and 37 were the channels chosen among the others for the reason that they presented the greatest fluctuations in relation to the others. A detailed visualization of the position of the channels distributed in the brain can be seen at https://physionet.org/content/ eegmmidb/1.0.0/64_channel_sharbrough.png.
DFA method
To understand the Detrended fluctuation analysis (DFA) method proposed by Peng, et al. [11], consider a correlated signal sample of u (i) (EEG signal), where i = 1, cdots, N, where N is the total number of points in the time series. We integrate the sign u (i) and obtain y(k) = ∑k [u(i)− < u >], where < u > is the average of u (i). The integrated signal y(k) is divided into boxes (without overlap) of the same size n (time scale). For each box of size n, we fit yn(k) in each box using a first-order linear regression, which represents the trend of the box. The entire process is obtained using the least squares method. The integrated series y(k) is subtracted from the fitted series yn(k) at each box size n. Afterwards, for each box of size n, the mean square root will be calculated (integrated signal and without trend), that is,
The calculation is repeated for a wide range of scales, i.e. 4 n N/4. Next, the function FDFA characterizes a power law of the type FDFA nαDFA , where αDFA will be the long range correlation indicator.
The interpretation of the relationship is given as follows:
| Coefficient | Signal type |
| αDFA < 0.5 | antipersistent |
| αDFA ≃ 0.5 | uncorrelated white noise |
| αDFA > 0.5 | long-range correlated persistent |
| αDFA ≃ 1 | 1/ f noise |
| αDFA > 1 | non-stationary |
| αDFA ≃ 3/2 | brownian noise |
At this stage, the DFA method enables the detection of long-range correlation and self- affinity embedded in apparently non-stationary time series and, above all, avoids the spurious detection of long-range correlations. Works that cite the DFA method [1,2,9,10,12-17].
RMS function
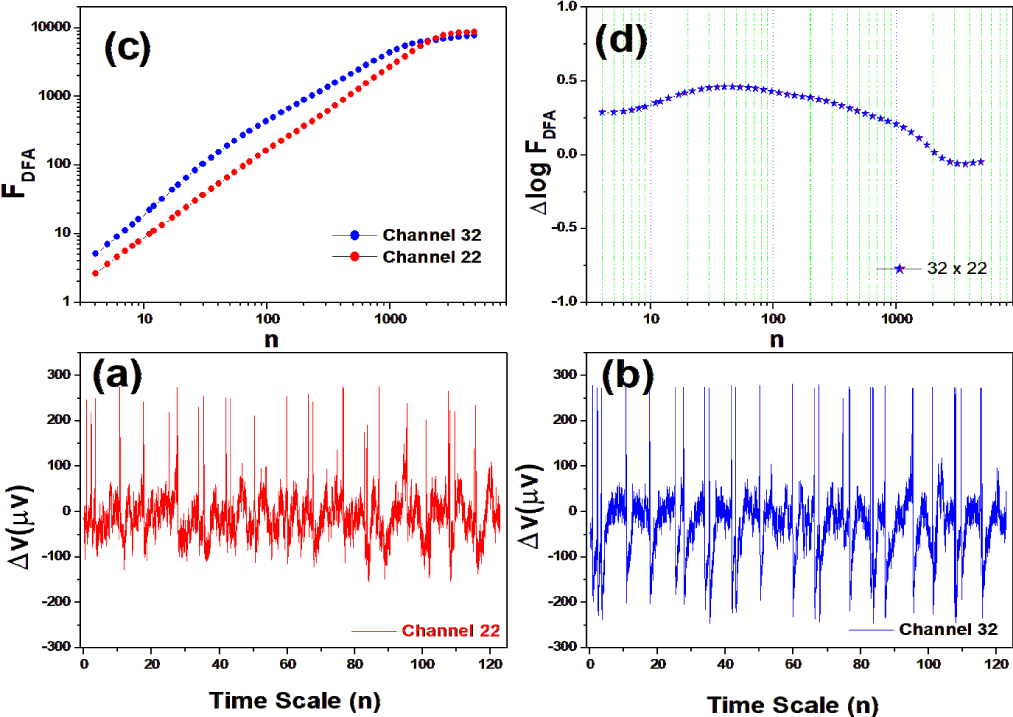
The proposal of the mean square fluctuation function (RMS) by Zebende, Floreˆncio and Juan, 2017, arises from the idea of measuring the difference in the amplitude of the fluctuation between two EEG channels (temporal coherence) [1]. The tool is an addition to the DFA method and has proven to be very useful for analyzing electrophysiological signals. Using the RMS function, we can study how much two regions of the brain are correlated for the same scale and generalize to all points distributed in the brain. In practice, we calculate FDFA of two time series generated by the EEG signal and its logarithm individually, then subtract the result from the logarithms, see equation (2).
Thus, ∆logF32,xx gives us information about the relative intensity of the RMS fluctuation, ie. if: ∆logF32,xx > 0, the amplitude of the RMS fluctuation function around the channel F32 in relation to the channel xx, is larger; ∆logF32,xx = 0, the amplitude of the RMS fluctuation function around the channel F32 with respect to the channel xx, is zero; ∆logF32,xx < 0, the amplitude of the RMS fluctuation function around the channel F32 in relation to the channel xx, is smaller.
The first time the RMS function was used in the motor/imaginary experiment available at:
< htt p : //www.physonmet.org >, compared brain activities between channels 32, 37, 49 and 54 (protocol 10-10) [1,2,18].
Results and Discussion
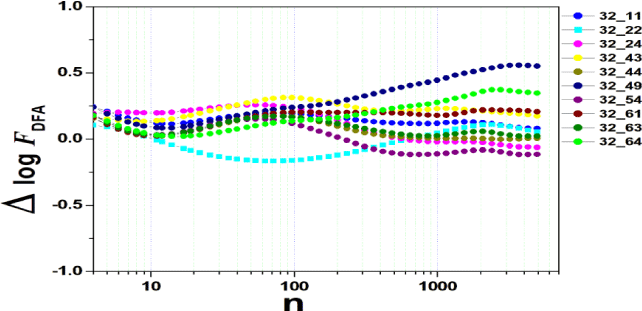
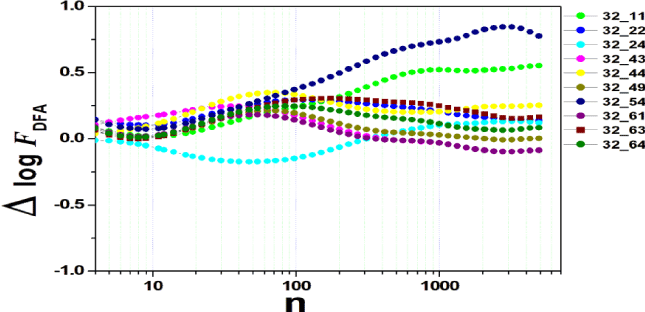
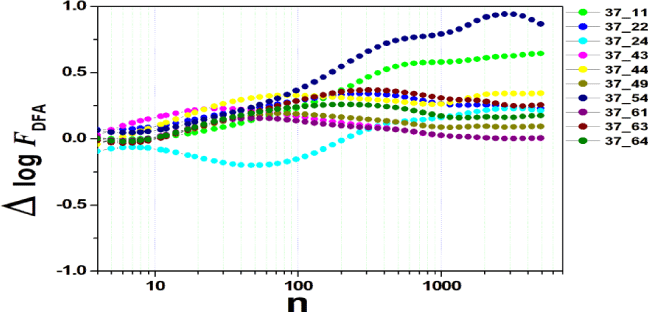
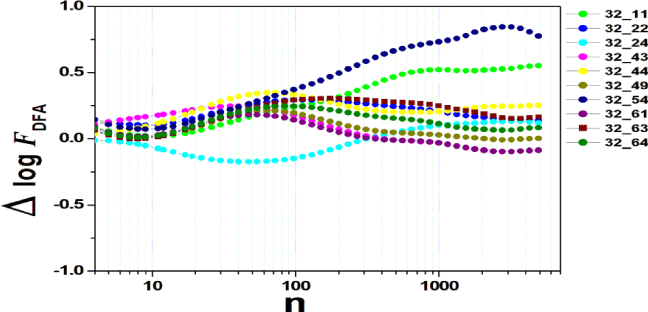
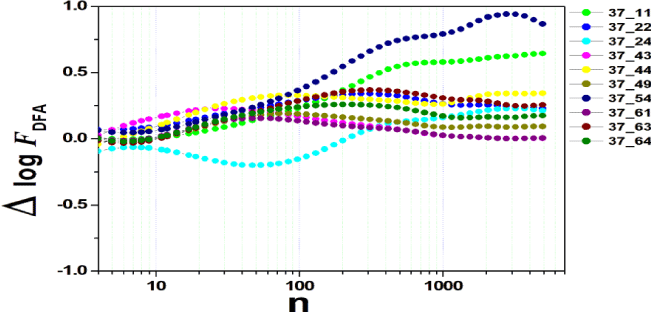
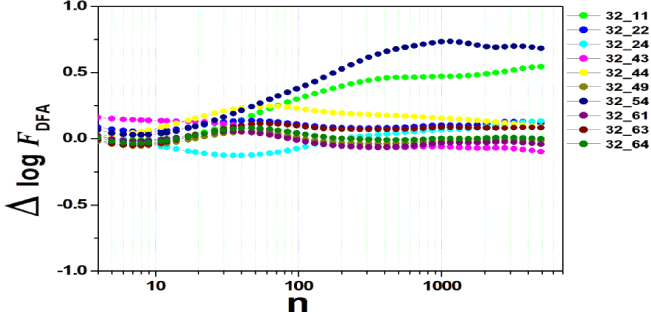
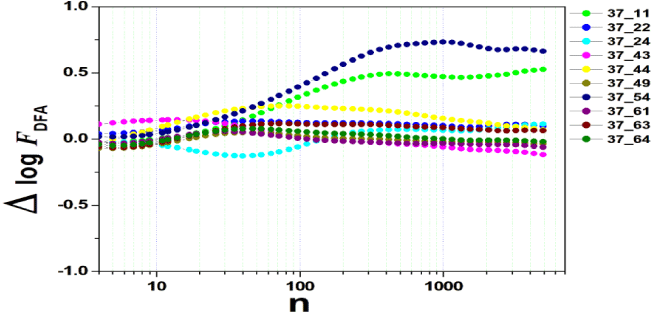
We tested all steps predicted by the RMS fluctuation function (∆log F32,xx). We applied the technique to 44 series of the real/imaginary motor experiment for tasks 1, 2, 3, 4, as shown in table 1. Each EEG signal is approximately 2 minutes long (approximately 20,000 points) and ∆t = 0.00625s. We observed the function in experiments S010R03, S010I03, S010R04, S010I04, S010R05, S010I05, S010R06 and S010I06. The visualization of the curves is repre- sented in the figures 1-9. We observed three moments of scale: small (n < 10), medium (10 < n < 100) and large scales (n > 100). At n = 100, we have approximately 1 minute.
In figure 2, we have the answer to the 1 task of experiment S010R03, with the reading on scales varying according to the size of the boxes (4n < 10000). For small scales, specifically (n = 4), the difference for all channels was positive. For medium scales, 32 x 22 showed a negative difference when compared to the others. For 10 < n < 100, 32 x 22 and 32 x 54 were negative. For n > 1000, 32 x 24, 32 x 54 and 32 x 63 showed a negative difference.
In figure 3, experiment S010I04 follows the same interpretation as experiment S010R03. For small scales, specifically at (n = 4), the difference for all channels fluctuated close to zero. As the size of the interval grows (4 < n < 10), the difference scales up. For 10 < n < 100, 37 x 24 presents a negative difference. At 10 < n < 100, negative difference for 37 x 22 and 37 x 54. For n > 1000, 37 x 54 maintains the difference, accompanied by 37 x 54. For the other figures [4-9], the difference in the amplitude of the fluctuations is similar; however, some points of observation are noted. For the initial condition of the method (n = 4), the fluctuations are differentiated between regions of the brain. In 4 and 5, 32 x 22 and 37 x 24 show similar behavior, and for large scales, 32 x 11 and 37 x 22 reveal ∆log FDFA 0.5. In figures 6 and 7, for n 1000, highlight 32 x 22 and 37 x 22 which presented ∆log FDFA 0.75 with increasing scale. The same reasoning as in 6 and 7 can be seen in 8, 9).
It is worth mentioning that we do not seek to reveal large differences in the test, since we have a small sample and the objective is to test whether the fluctuation function (RMS) is capable of measuring differences in the amplitude of the fluctuation, as well as verifying whether, as it grows the size of the box, whether or not there is variation in the amplitude of the fluctuation. Here we verify that it is and that the tool is robust for analysis.
Conclusion
We seek to represent in this study all the steps that lead to the understanding of the synchronism and organization of the patterns of electrical activity in the human brain between regions, through the mean square fluctuation function (RMS - ∆log) from two channels of reference, 32 and 37, both located in the left/right frontal region. To model these steps, we chose a data set with EEG recordings lasting approximately two minutes, one sample subject (S010), four tasks and 12 channels distributed throughout the brain.
In line with the literature, we evaluated the two most active channels, 32 and 37 (highest fluctuation). We measured the autocorrelations and verified that these differences for the real/imagined motor response vary with increasing scale. Finally, we show that it is possible to replicate the technique for a larger number of subjects and we understand that the RMS function can be another strategy to understand cerebral temporal coherence using EEG data.
Acknowledgment
Floreˆncio Mendes Oliveira Filho is grateful to Centro Universita´rio SENAI CIMATEC and the National Council for Scientific and Technological Development (CNPq 25/2021) scholarship PDJ - 150655/2022-3. Gilney F. Zebende thanks the CNPq (Conselho Nacional de Desenvolvimento Cient´ıfico e Tecnolo´gico) (Grant 310136/2020-2), Brazilian agency.
References
- Zebende GF, Oliveira Filho FM, Leyva Cruz JA. Auto-correlation in the motor/imaginary human EEG signals: A vision about the FDFA fluctuations. PLoS One. 2017 Sep 14;12(9):e0183121. doi: 10.1371/journal.pone.0183121. PMID: 28910294; PMCID: PMC5598924.
- Oliveira Filho FM, Leyva Cruz JA, and Zebende GF. Analysis of the EEG bio-signals during the reading task by DFA method. Physica A. 2019;525:664-671.
- Lee JS, Yang BH, Lee JH, Choi JH, Choi IG, Kim SB. Detrended fluctuation analysis of resting EEG in depressed outpatients and healthy controls. Clin Neurophysiol. 2007 Nov;118(11):2489-96. doi: 10.1016/j.clinph.2007.08.001. Epub 2007 Sep 24. PMID: 17890151.
- Kiloh LG, McComas AJ, Osselton JW. Clinical electroencephalography. 2013.
- Binnie CD, Prior PF. Electroencephalography. J Neurol Neurosurg Psychiatry. 1994;57(11):1308-19. doi: 10.1136/jnnp.57.11.1308. PMID: 7964803; PMCID: PMC1073178.
- Davidson RJ, Jackson DC, and Larson CL. Human electroencephalography. 2000.
- Chen Z. Effect of nonstationarities on detrended fluctuation analysis. Phys Rev E. 2001;65:1–14.
- Yao D. A method to standardize a reference of scalp EEG recordings to a point at infinity. Physiol Meas. 2001 Nov;22(4):693-711. doi: 10.1088/0967-3334/22/4/305. PMID: 11761077.
- Oliveira Filho F, Ribeiro F, Cruz JL, de Castro AN, and Zebende G. Statistical study of the eeg in motor tasks (real and imaginary). Physica A: Statistical Mechanics and its Applications. 2023a;622:128802.
- Zebende GF. DCCA cross-correlation coefficient: Quantifying level of cross- correlation. Physica A. 2011;390(4):614–618.
- Peng CK, Buldyrev SV, Havlin S, Simons M, Stanley HE, Goldberger AL. Mosaic organization of DNA nucleotides. Phys Rev E Stat Phys Plasmas Fluids Relat Interdiscip Topics. 1994 Feb;49(2):1685-9. doi: 10.1103/physreve.49.1685. PMID: 9961383.
- Mesquita VB, Oliveira Filho FM, Rodrigues PC. Detection of crossover points in detrended fluctuation analysis: an application to EEG signals of patients with epilepsy. Bioinformatics. 2021 Jun 9;37(9):1278-1284. doi: 10.1093/bioinformatics/btaa955. PMID: 34107041.
- Oliveira Filho EA.Self-regulation in electroencephalographic signals during an arithmetic performance test: an approach with an rms fluctuation function. 2021. 15921091210.
- Guedes EF, Brito AA, Oliveira Filho FM, Fernandez BF, de Castro APN, da Silva Filho AM, Zebende GF. Statistical test for ΔρDCCA : Methods and data. Data Brief. 2018 Mar 22;18:795-798. doi: 10.1016/j.dib.2018.03.080. PMID: 30140718; PMCID: PMC6103976.
- Vassoler R, Zebende G. Cross-correlation coefficient apply in time series of air temperature and air relative humidity. Physica A. 2012;391(7):2438-2443.
- Brito AA, Araújo HA, Zebende GF. Detrended Multiple Cross-Correlation Coefficient applied to solar radiation, air temperature and relative humidity. Sci Rep. 2019 Dec 24;9(1):19764. doi: 10.1038/s41598-019-56114-6. PMID: 31874976; PMCID: PMC6930259.
- Oliveira Filho FM, Guedes EF, Rodrigues PC. Networks analysis of Brazilian climate data based on the DCCA cross-correlation coefficient. PLoS One. 2023 Sep 15;18(9):e0290838. doi: 10.1371/journal.pone.0290838. PMID: 37713368; PMCID: PMC10503753.
- Schalk G, McFarland DJ, Hinterberger T, Birbaumer N, Wolpaw JR. BCI2000: a general-purpose brain-computer interface (BCI) system. IEEE Trans Biomed Eng. 2004 Jun;51(6):1034-43. doi: 10.1109/TBME.2004.827072. PMID: 15188875.
Content Alerts
SignUp to our
Content alerts.
 This work is licensed under a Creative Commons Attribution 4.0 International License.
✨ Call for Preprints Submissions
Are you the author of a recent Preprint? We invite you to submit your manuscript for peer-reviewed publication in our open access journal.
Benefit from fast review, global visibility, and exclusive APC discounts.


