2025 July 28;6(7):976-983. doi: 10.37871/jbres2152.
Molecular Investigation of Cytochrome P-450 Enzymes Inductors
Terzulum G1* and Andrei Ivanovich K2
2N.M. Kizhner Research Center, Tomsk Polytechnic University, Tomsk, Russia
- Computational biology
- Molecular modelling
- Drug-Drug interaction
- Machine learning
- Cytochrome P-450 induction
- Molecular drug modelling
Abstract
Cytochrome P-450 enzymes play a critical role in xenobiotic metabolism and homeostasis, with their induction offering therapeutic potential for liver diseases and metabolic disorders. Using molecular docking and statistical analyses, the research examines the binding affinities and structural features of 46 known inducers, classifying them into Type I (affecting apo-protein expression) and Type II (directly influencing the heme center). Linear Discriminant Analysis (LDA) achieved an 87% accuracy in classifying these inducers, with key interactions identified at amino acid residues Glu301, Phe115, and Ser294. Compounds such as 3,5-difluoromethylurea and 3,4-dichlorophenylmethylurea demonstrated strong binding, highlighting their potential as effective inducers. The study also developed Quantitative Structure-Activity Relationship (QSAR) models to predict binding constants, providing insights into the structural determinants of induction. These findings advance the understanding of cytochrome P-450 induction mechanisms and lay the groundwork for designing safer, more selective drugs.
Introduction
The industrialization and chemical development of crucial life industries over the years has exponentially increased circulation of foreign chemical factors in the environment. Living organisms therefore, are constantly exposed to these foreign chemicals - xenobiotics, which are unnatural participants in normally occurring biochemical reactions in the organism. Hundreds of thousands of these chemicals are metabolized by heme-containing enzymes belonging to the cytochrome P-450 superfamily which are present in all living things. Over 300 CYP isoforms have been identified, able to catalyse not less than 60 varying enzymatic reactions [1,2].
Cytochrome P-450 enzymes (CYPs) are heme-thiolate proteins that mediate the metabolism of a numerous endogenous and exogenous compounds, comprising drugs, toxins, hormones, and fatty acids. The name “cytochrome P-450 enzymes” is derived from its following characteristics: they are bound to the cell membrane (cyto) and contain heme pigment (chromium and P). When bound to carbon monoxide, these proteins give a spectrum with an absorption maximum around 450 nm [1,3].
Cytochrome P-450 catalyses aromatic and aliphatic hydroxylation, oxidative deformylation, reductive dehalogenation, dehydrogenation, reduction of arenes and amine oxides, epoxidation, dealkylation, deamination, denitrosation de-esterification, and β-splitting [3,4]. The diversity of cytochrome P-450 isoforms is regarded as a remarkable phenomenon in biochemistry. This is largely due to their ability to exist in multiple forms, allowing them to participate in the oxidation of numerous compounds. However, the exact number of chemicals metabolized by CYPs remains uncertain [4].
The cytochrome P-450 superfamily plays a crucial role in maintaining homeostasis, with alterations in the ratio of different isoforms often linked to various pathological conditions [2,5]. These structurally and functionally distinct iso-enzymes in mammals originate from a complex gene superfamily.
Aim of study: To study the molecular interactions between cytochrome P-450 (CYP) enzymes and low molecular weight compounds that can induce its activity in the body.
- To conduct a thorough review of the functional and structural characterization of cytochrome P 450 enzymes.
- To investigate the molecular interactions between cytochrome P-450 and low molecular weight inducers of the enzyme by docking method.
- To classify experimental inducers by statistical comparison of docking results.
Object and Research Methodology
Object of research
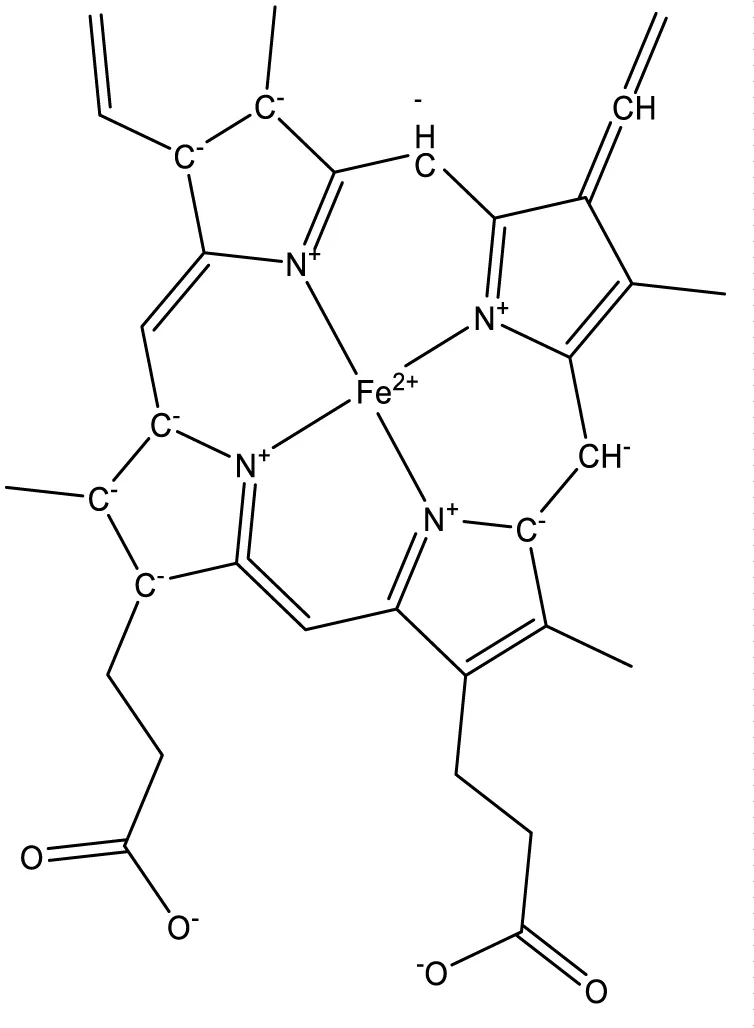
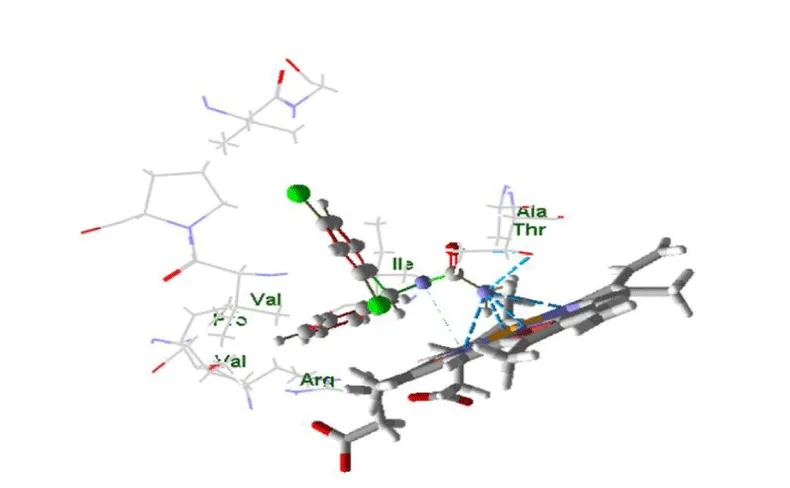
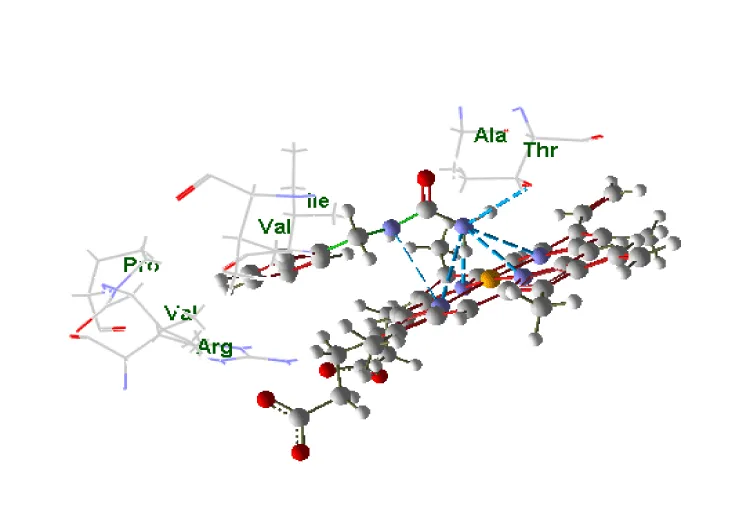
The object of this study is the human cytochrome P450 monooxygenase, which is involved in the metabolism of various endogenous substrates. The enzyme’s binding site was assessed using molecular docking to evaluate its complementarity with several low-molecular-weight compounds known to act as inducers of P450 in rats. A key component of the binding site is the heme moiety (cofactor), which contains a chelated iron ion (Figures 1,2).
Methodology: molecular docking
A homology model of human CYP2C9 was utilized as the primary receptor structure, incorporating the docked heme cofactor (HEM_492) and the active PHE_1 domain of hem synthase, modulated by the peptide agonist Ala-Arg-Cys-Cys-Glu-Gly-His-Ile-Leu-Lys-Phe-Pro-Ser-Thr-Val (sourced from UniProt as structure WT2). This model was chosen due to its relevance in representing the functional state of CYP2C9, including the heme-binding site critical for catalytic activity and induction-related interactions [5]. The receptor structures were imported into Molegro Virtual Docker 6.0 (MVD) for preparation and docking. Prior to docking, the receptor models underwent validation checks within MVD to ensure completeness of the structures (e.g., no missing atoms or residues in the active site). The receptor structures were treated as rigid during docking, a standard approximation to reduce computational complexity while focusing on ligand flexibility, which is often sufficient for initial pose prediction in cytochrome P-450 studies [1].
Docking simulations were performed using Molegro Virtual Docker 6.0 (MVD), leveraging its MolDock scoring function, which evaluates binding interactions based on a combination of steric, electrostatic, hydrogen-bonding, and torsional energy terms [QiSoft, 2015]. The search space for docking was defined as a spherical region with a radius of 9 Å, centered on the geometric center of gravity of the bound peptide molecule (PHT_1 for HEM_492) within the CYP2C9 homology model. This radius was selected to encompass the active site, including the heme cofactor and adjacent residues known to mediate ligand binding, ensuring comprehensive exploration of potential interaction sites [1]. The MolDock scoring function was applied with a grid resolution of 0.3 Å to balance computational efficiency with accuracy in energy calculations. Conformational mobility of the ligands was accounted for by allowing flexibility in torsional angles, which were automatically detected and parameterized by MVD. For each ligand-receptor pair, 300 independent docking runs were conducted to enhance sampling robustness and reduce the likelihood of missing favorable poses. The receptor structures remained rigid during docking, consistent with the focus on ligand conformational adaptability in this initial study.
Linear Discriminant Analysis (LDA) was then performed to determine classification functions to recognize compounds as belonging to one or another inducer class (I or II). Such a task belongs to the Structure-Activity Relationship (SAR) analysis. In addition, within each of the two classes, we attempted to perform QSAR analysis (Quantitative Structure-Activity Relatonships) using literature data on dissociation constants of inductor-enzyme complexes [1].
Results and Discussions
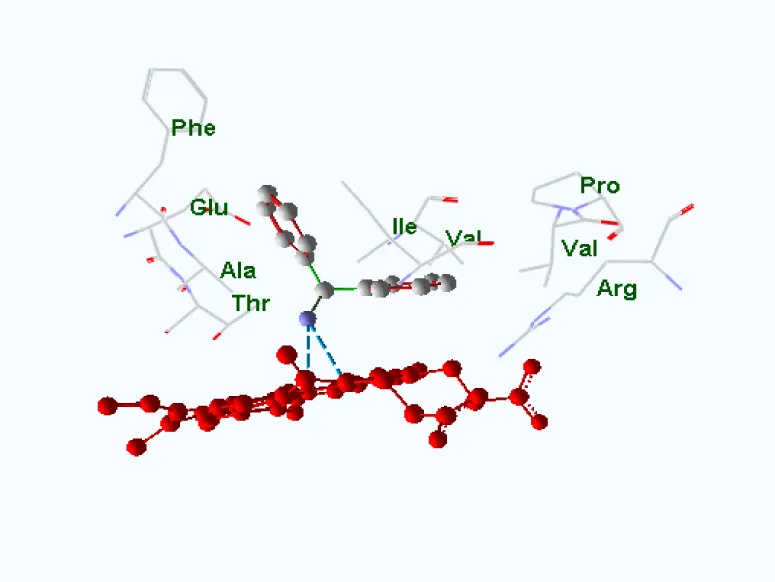
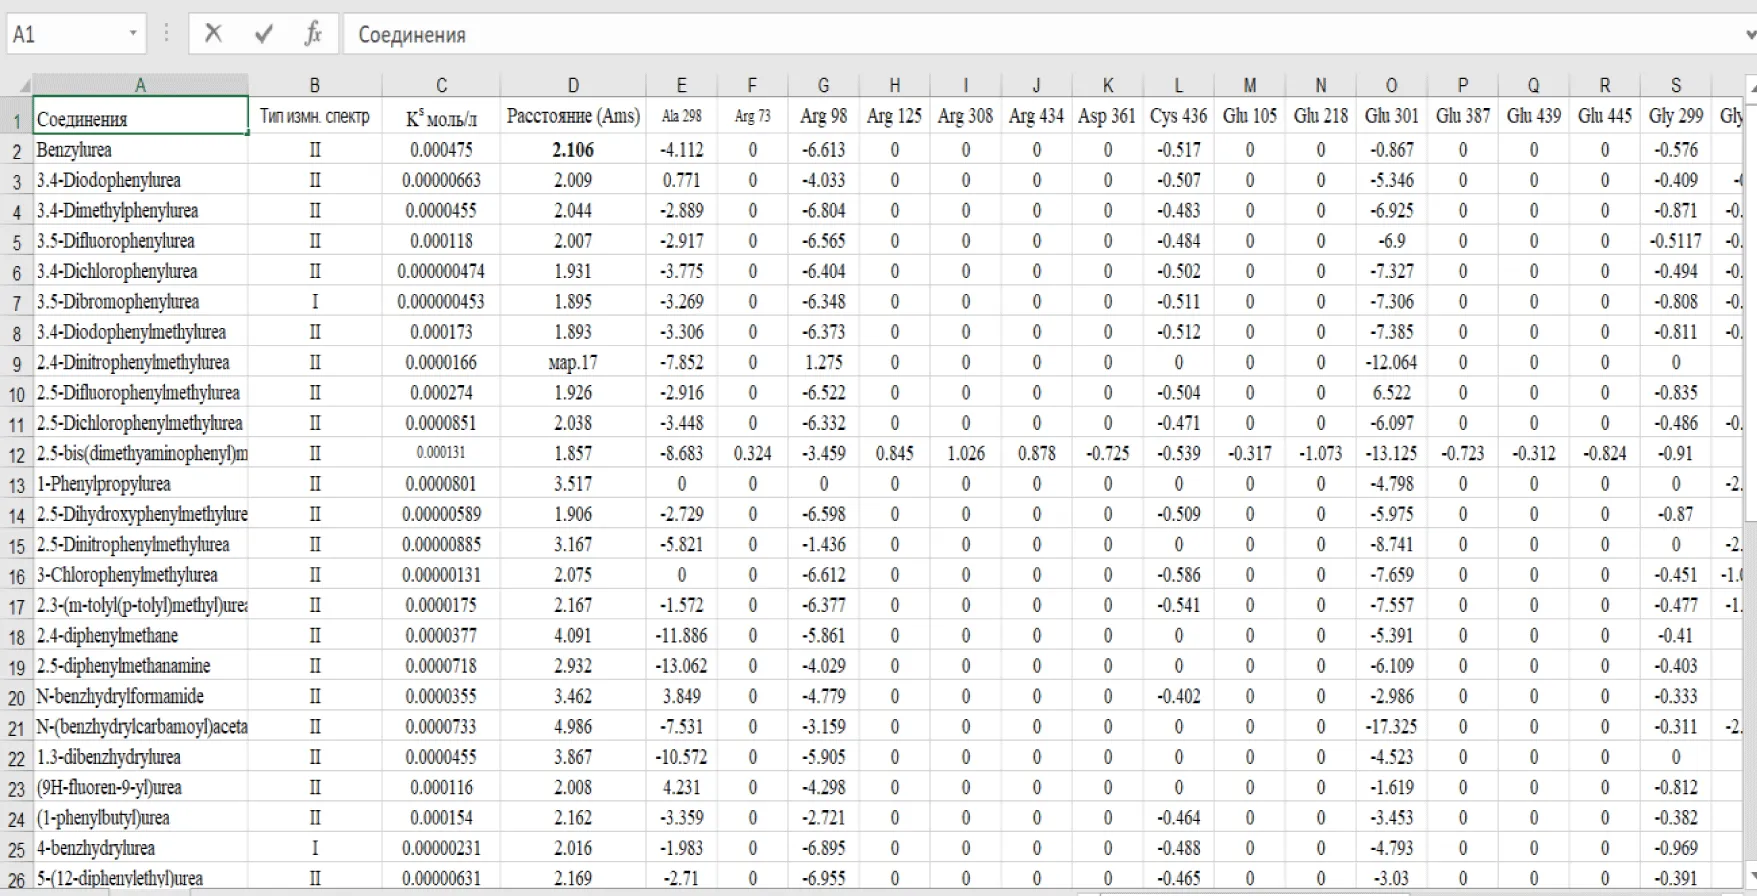
For each of the 46 inducers investigated, the best docking position was selected for further analysis. The data were ordered according to the distance between ligand and receptor, partial values of the evaluation function corresponding to amino acid residues, and compound class (type of binding to cytochrome according to the pattern of spectral changes) figures 3-7.
The table summarizes the partial values of the evaluation function at surrounding amino acid residues for each docking position obtained, the distance between ligand and receptor (CYP2C9), and the inducer class based on UV –vis spectral changes. Data from the table were used to construct SAR models using the LDA method in Statistica 6.0 program (Table 1).
Results of discriminatory and correlation analysis of data using statistica 6.0
The results of inductor classification by LDA method are presented in table 2. The table above shows that 4 out of 31 Class II compounds were misclassified based on the LDA model. Similarly, only 2 out of 15 class I compounds were grouped incorrectly. Overall, the percentage of correct classifications is about 87%, which is a reasonably good result in molecular recognition of bioactive compounds of different groups [6]. The specific compounds that were incorrectly classified are listed in table 3. Linear discriminant analysis of the data makes it possible to identify, for example, 3,5-dibromophenylurea as a class II inducer instead of its experimental classification as a class I compound according to spectral changes (UV-Vis) upon complexation with cytochrome P-450. The same is true for 4-benzylhydrourea and 5,5-diphenylimidazolidin-2,4-dione, which have structural similarity to class II compounds.
| Table 2: Classification matrix obtained by linear discriminant analysis. | ||||
| Class of Inductor | Classification matric | |||
| Total compounds | I | II | % correct classification | |
| II | 31 | 4 | 27 | 87 |
| I | 15 | 13 | 2 | 86.6 |
| Total | 46 | 17 | 29 | 86.9 |
| Table 3: List of compounds wrongly classified in the LDA SAR analysis. | ||
| Compound | Class | |
| Experimental | Calculated LDA | |
| 3,5-Dibromophenylurea | I | II |
| 3-Chlorophenylmethylurea | II | I |
| 4-Benzhydrylurea | I | II |
| 5-(12-diphenylethyl)urea | II | I |
| 1,3-diacetyl-5-ethyl-5-phenylpyrimidine | II | I |
| 5,5-diphenylimidazolidine-2,4-dione | I | II |
Similarly, 3-chlorophenylmethylurea, 5-(12-diphenylethyl) urea and 1,3-diacetyl-5-ethyl-5-phenylpyrimidine, experimentally assigned to class II, have more similarity to class I according to LDA model.
The most important amino acid groups
The SAR model we obtained can be considered quite satisfactory, since good molecular recognition rates (87% correct classifications, see above) were achieved on the basis of partial evaluation functions for only three amino acid residues (Table 4), which can thus be considered the most significant structural elements determining the differences between the classes of cytochrome P-450 inducers studied. Thus, the degree of interaction with Glu301, Phe115 and Ser294 residues mainly determines the differences between the two types of inducers studied.
Based on the data given in table 4, the classification functions for the compounds under study can be expressed by equations of the following form:
| Table 4: Amino acid residues most important for molecular recognition of inducers and the corresponding classification function coefficients. | ||
| Effect | Classification Function | |
| I p = 0.6739 | II p = 0.3261 | |
| Linear coefficient | -61.537 | -77.578 |
| Glutamine (Glu 301) | 1.0573 | 1.1749 |
| Phenylalanine (Phe 115) | -0.0443 | -0.0193 |
| Serine (Ser 294) | -0.0656 | -0.0869 |
FI = aI0+ aI1 x1… + aIn xn
Using the above coefficients, the equation for classes I and II will be as follows:
FI = -61,537 + 1,057 * Glu 301 – 0,044 * Phe 115 – 0,066 * Ser 294
FII = -77,578 + 1,175 * Glu 301 – 0,019 * Phe 115 – 0,087 * Ser 294
According to the basic idea of the LDA method, classification based on these features can be performed as follows:
FI > FII → Класс I
FII > FI → Класс II
Thus, as a result of the performed studies, a rather easy-to-use classification model has been obtained, which makes it possible to predict whether inducers belong to class I and II. From the biological point of view, type II inducers tend to directly affect the heme-center of the enzyme, increasing its catalytic activity or affinity for the substrate. On the other hand, type I inducers affect mainly the apo-protein and lead to increased cytochrome expression (Table 5).
| Table 5: Compounds that returned a “No variance” LOO result. | ||
| Compound | Inductor Type | |
| Experimental | Predicted. LOO | |
| 2,5-bis(dimethaminophenyl)methylurea | II | 0 |
| 1-phenylpropylurea | II | 0 |
| 6-methoxy-1,3-dimethyl-5,5-diphenyldihydropyrimidine | II | 0 |
Leave One Out Cross Validation (LOOCV)
LOO is a data cross validation training model for machine learning. For prediction, each compound was removed from the sample one by one, and a modified LDA model was built for the remaining connections, which was then used to determine the class of the removed connection. Thus, each of the connections was “external” at prediction, i.e., not used in model building.
For three compounds, only the zero values in the table column (No variance) remained when removed, so predictions could only be made for 43 connections. Table 6 summarizes the classification matrix. The percentage of correct predictions was 76.7%. This is quite good for biological data, considering that these are predictions of “external” compounds that were not part of the corresponding training sample for the modified LDA model table 7.
| Table 6: Classification matrix obtained by LOO method. | ||||
| Inductor Class | Classification Matrix | |||
| Total Compounds | I | II | % of accuracy | |
| II | 28 | 7 | 21 | 75 |
| I | 15 | 12 | 3 | 80 |
| Total | 43 | 19 | 24 | 76.7 |
| Table 7: Characteristics of the regression model approximating pKs values for type I inductors. | |||
| n = 15 | Regression summary of dependent variables. pKs R = 0,916; R2 = 0,839 | ||
| Coefficient | Standard deviation | p- level | |
| Linear Coefficient | 8.561860 | 2.169997 | 0.00275 |
| Glu 299 | 0.317427 | 0.160451 | 0.076082 |
| Thr 306 | -0.624162 | 0.132600 | 0.00833 |
| Leu 362 | 0.333369 | 0.132769 | 0.030865 |
| Val 363 | -0.341817 | 0.157533 | 0.055188 |
| Standard error of approximation pKs: 0.452. | |||
Multiple Regression Analysis (QSAR)
Using the data set obtained by molecular docking (Table 1), it is possible to perform QSAR analysis within each class of the studied compounds, since experimentally determined binding constants with cytochrome P-450 are available for them. First of all, however, the lack of interactions with some amino acid residues for class I compounds should be noted. Thus, in contrast to class II, none of the class I compounds had partial interactions with some amino acids, such as Asp 361, His 369, Leu 365 and Ser 360. For class I, a regression QSAR model was obtained by stepwise regression analysis and presented in table 5.
Thus, the multiple regression equation for calculating the pKs values of cytochrome P-450 class I inducers, based on the results of QSAR analysis is as follows:
pKs = 8,5619 + 0,317 Glu 299 – 0,62 Thr 306 + 0,333 Leu 362 – 0,34 Val 363
Conclusions
A systematic literature review allowed us to identify known inducers of cytochrome P-450 in the rat liver monooxygenase system. In this work, molecular docking and statistical analysis were performed and a classification model was constructed to recognize type I and type II inducers. The main conclusions are summarized as follows:
Specific structural features of low molecular weight compounds responsible for hydrostatic interactions and hydrogen bonds are crucial for their affinity for CYP2C9. 1,3-dibenzhydryl urea and 6-(1,3,3-triphenylpropyl) urea showed strong binding interactions with affinity scores ΔG = -154.485 and ΔG = -133 respectively, and hydrogen bond energy of -1.02 kj/mol.
Previously, Saratov AS. et al [1] established a classification model for these compounds into type I and II inducers according to spectra changes in UV-vis from 390nm – over 400nm, however, our LDA model identified six of these inductors highlighted in table 3 to have been wrongly classified by his method. This observation may be due to unique electronic or steric properties not accounted for in UV-vis measurement.
The consistence of the data set highlights the amino acids Glu 301, Phe 115 and Ser 294 as crucial building blocks of bioactive compounds capable of inducing the secretion of monooxygenase cytochrome P-450 either at the heme-center or its apo-protein regions.
Mechanistically, all examined type I inductors of CYP2C9 share activity with these amino acids (Glu 301, Phe 115 and Ser 294) while the type II inductors have share one or two and combines reactivity around Thr 306, Leu 362 and Valine 363.
Further research is needed to explore the role of other cytochrome P-450 isoforms in maintaining homeostasis and disease progression for the development of targeted therapeutic approaches. Advanced computational and experimental methods, such as dynamic modelling and high-throughput screening, can improve the accuracy of predicting the specificity of potential inducers and accelerate the process of new drug development.
Finally, study deepens our understanding of cytochrome P-450 induction by low molecular weight compounds, highlighting the multiplicity and diverse chemical activity of the super enzyme. Molecular docking and statistical analysis provides a sound basis for the integration of artificial intelligence in life science research through machine learning to enhance precision medicine and future studies aimed at optimizing enzyme modulation for clinical benefits.
Conflict of Interests
Authors Andrey Ivanovich and Terzulum Gwaza have no financial interests to declare. Andrey Ivanovic is a professor and lead researcher at the N. M Keinzer Engineering School of New Production Technologies.
References
- Saratikov AC, Fkhmedzhanov RR, Bakiaev AA, Khlebinkov AI, Novozheeva TI, Bystritsky EL. Regulators of enzymatic detoxification systems among nitrogen-containing compounds.Tomsk: Siberian Publishing House. 2002.
- Rendic S, Guengerich FP. Survey of Human Oxidoreductases and Cytochrome P450 Enzymes Involved in the Metabolism of Xenobiotic and Natural Chemicals. Chem Res Toxicol. 2015 Jan 20;28(1):38-42. doi: 10.1021/tx500444e. Epub 2014 Dec 19. PMID: 25485457; PMCID: PMC4303333.
- Testa B, Pedretti A, Vistoli G. Reactions and enzymes in the metabolism of drugs and other xenobiotics. Drug Discov Today. 2012 Jun;17(11-12):549-60. doi: 10.1016/j.drudis.2012.01.017. Epub 2012 Jan 28. PMID: 22305937.
- de Groot MJ. Designing better drugs: predicting cytochrome P450 metabolism. Drug Discov Today. 2006 Jul;11(13-14):601-6. doi: 10.1016/j.drudis.2006.05.001. PMID: 16793528.
- Shimizu H, Park SY, Shiro Y, Adachi Si. X-ray structure of nitric oxide reductase (cytochrome P450nor) at atomic resolution. Acta Crystallogr D Biol Crystallogr. 2002 Jan;58(Pt 1):81-9. doi: 10.1107/s0907444901017383. Epub 2001 Dec 21. PMID: 11752781.
- Almazroo OA, Miah MK, Venkataramanan R. Drug Metabolism in the Liver. Clin Liver Dis. 2017 Feb;21(1):1-20. doi: 10.1016/j.cld.2016.08.001. Epub 2016 Oct 15. PMID: 27842765.
- Danielson PB. The cytochrome P450 superfamily: biochemistry, evolution and drug metabolism in humans. Curr Drug Metab. 2002 Dec;3(6):561-97. doi: 10.2174/1389200023337054. PMID: 12369887.
Content Alerts
SignUp to our
Content alerts.
 This work is licensed under a Creative Commons Attribution 4.0 International License.


