Biology Group . 2022 May 31;3(5):664-668. doi: 10.37871/jbres1493.
Muscle Power Signal Acquisition Monitoring Using Surface EMG
Rifky Ismail*
- Muscle power
- Amplification
- Surface EMG
- Filter
Abstract
Recent demand and interest in patient health monitoring has driven significant interest toward developing varies alternative rehabilitation monitoring instrument. Muscle power can be seen from how many power it’s generate from contraction effort that can be sense by its voltage potential in microvolt order. Surface Electromyogram (EMG) is used to take the record acquisition of muscle power data as patient take the rehabilitation program for some period. In this paper the surface EMG designed to get some level amplification to maintain the data readable and filter to minimize noise that always is the problem from instrument to get data. The aim of the research is to design compact surface EMG device that can be record data development of muscle power over time.
Introduction
The World Health Organization defines rehabilitation or rehab as the combined and coordinated use of medical, social, educational and vocational measures for training and retraining an individual to the highest level of functional ability. Physical therapy in rehabilitation assists individuals to recover as much independence as possible from neuromuscular diseases, amputation, and disability. Rehabilitation centers provide physical treatment and therapy that can help patients cope with deficits and reverse many disabling conditions that cannot be done by medical care under the supervision of therapists. Due to physical disability, assistance through an automated technical system may potentially enhance the physical activities of a patient during rehabilitation, as discovered by Mosher in the 1960s. He introduced the Human Machine Interface (HMI) as a control system and effectively demonstrated the system’s use in the mechanism of lower-limb orthoses [1].
Since then, advancements of HMI have extensively been developed with different types of mechanical actuators, structures and interfaces. Essentially, HMI enables humans to interact with or control the system of a machine/dynamic technical system. The term machine can also refer to a specific device, a computer program or other physical tools. With this HMI, users should record the development data within rehab programs that can be very useful for the users and experts.
EMG signal-based control system research is ongoing for HMI applications especially in rehabilitation [2]. Generally, EMG is an experiment-based method for evaluating and recording a series of electrical signals that emanate from body muscles. The EMG signals are formed by physiological variations in the state of muscle fiber membranes. A major factor in muscle physiology is influenced by the excitability of muscle fibers through neural control [3]. In addition, the EMG signals are based upon action potentials at the muscle fiber membrane resulting from depolarization and repolarization, which is approximately in the range of –80 to –90 mV when not contracted. Similarly, Daud et al. reports that the amplitude of surface EMG signals are in the range from microvolts, _V to millivolts, mV depending on the muscle types and conditions during the observation process [4].
According to Reaz et al, the combination of muscle fiber action potentials from all the muscle fibers of a single motor unit is called as Motor Unit Action Potential (MUAP) [5]. This MUAP can be detected by non-invasive or invasive techniques. A non-invasive technique is applied by placing electrodes or sensors directly on the skin while an invasive approach is penetrating the needle/wire electrode into the muscle tissue to detect and record EMG signals. Notably, the non-invasive technique is preferred to measure EMG signals as this approach is free of discomfort and gives minimal risk of infection to amputees [6-9]. For surface EMG signals, the amplitude is in a range between 0 to 10 mV and the frequency range is restricted from 10 to 500 Hz.
Material and Methods
EMG
The bioelectrical activity inside the muscle of a human body is detected with the help of EMG electrodes. There are two main types of EMG electrodes: surface (or skin electrodes) and inserted electrodes. Inserted electrodes have further two types: needle and fine wire electrodes [10]. Among these three electrodes, surface EMG (SEMG) electrodes will be used in this paper.
Surface EMG electrodes provide a non-invasive technique for measurement and detection of EMG signal. The theory behind these electrodes is that they form a chemical equilibrium between the detecting surface and the skin of the body through electrolytic conduction, so that current can flow into the electrode.
These electrodes are simple and very easy to implement. Application of needle and fine wire electrodes require strict medical supervision and certification. Surface EMG electrodes require no such formalities. Surface EMG electrodes have found their use in motor behavior studies, neuromuscular recordings, sports medical evaluations and for subjects who object to needle insertions such as children. Apart from all this, surface EMG is being increasingly used to detect muscle activity in order to control device extensions to achieve prosthesis for physically disabled and amputated population.
Surface EMG has some limitations as well. Since these electrodes are applied on the skin, hence, they are generally used for superficial muscles only. Crosstalk from other muscles is a major problem. Their position must be kept stable with the skin; otherwise, the signal is distorted.
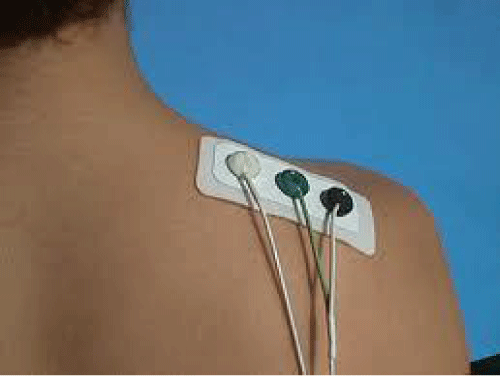
There are two types of EMG Electrodes, gelled electrodes and dry electrode. Gelled EMG electrodes contain a gelled electrolytic substance as an interface between skin and electrodes. Oxidation and reduction reactions take place at the metal electrode junction. Silver – silver chloride (Ag-AgCl) is the most common composite for the metallic part of gelled electrodes. Special skin preparations and precautions such as (hair removal, proper gel concentration, prevention of sweat accumulation etc.) are required for gelled electrodes in order to acquire the best possible signal. Gelled EMG electrodes are shown in figure 1.
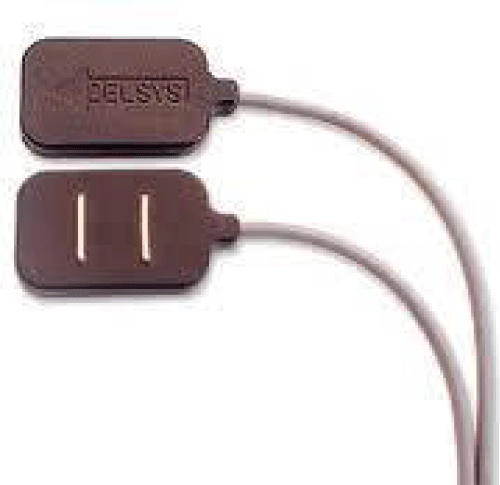
Dry EMG electrodes do not require a gel interface between skin and the detecting surface. Bar electrodes and array electrodes are examples of dry electrodes. These electrodes may contain more than one detecting surface. In many examples, an in-house pre-amplification circuitry may also be employed in these electrodes. A reusable bar electrode is shown in figure 2. Dry electrodes are usually heavier (>20 g) as compared to gelled electrodes (<1 g). This increased inertial mass can cause problems for electrode fixation; therefore, a material for stability of the electrode with the skin is required [11].
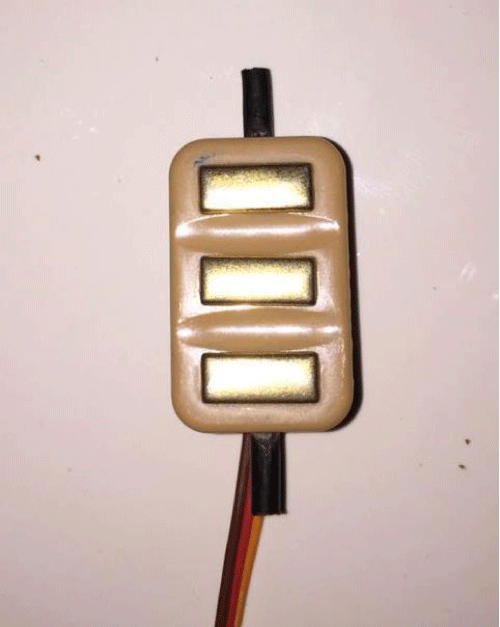
Besides electrodes, there are two categories of SEMG: Passive and active EMG electrodes. Passive EMG electrodes should be connected to an external amplification circuitry with the help of connecting wires for the proper acquisition of the EMG signal. Passive EMG electrodes can be disposable or reusable. Active EMG electrodes contain a pre-amplifier attachment for surface electrodes. Needle and fine wire surface electrodes are also available. These electrodes usually fall under the dry surface EMG electrodes type. The in-house high impedance amplifier in these electrodes transfers the pre-amplified signal to the rest of the circuitry. Figure 3 is shown as SEMG which is used in this paper.
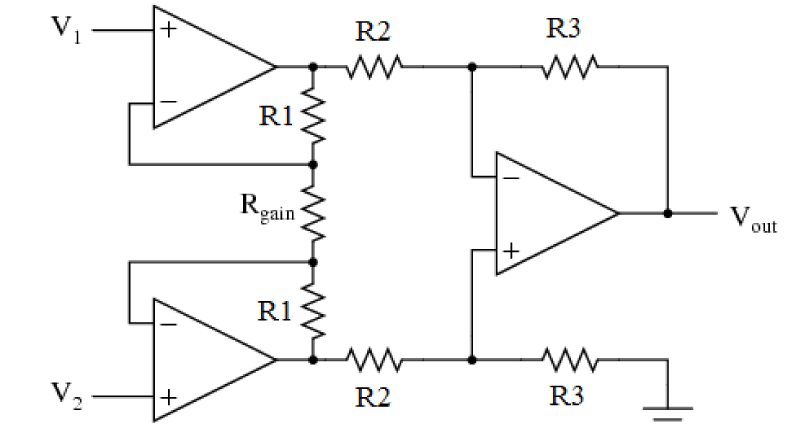
EMG signal is acquired through differential amplification technique. The differential amplifier should have high input impedance and very low output impedance. Ideally, a differential amplifier has infinite input and zero output impedance. Differential amplification is achieved with the help of an instrumentation amplifier for high input impedance. A classic three amplifier instrumentation amplifier is shown in figure 4. The gain equation and output equation of the instrumentation amplifier is given in equation 1, 2.
Low pass filters
Once the electrode is properly placed and the signal is extracted, noise plays a major role in hampering the recording of the EMG signal. For this purpose, the signal has to be properly filtered, even after differential amplification. The noise frequencies contaminating the raw EMG signal can be high as well as low. In order to remove low frequencies, low pass bio-filters are required.
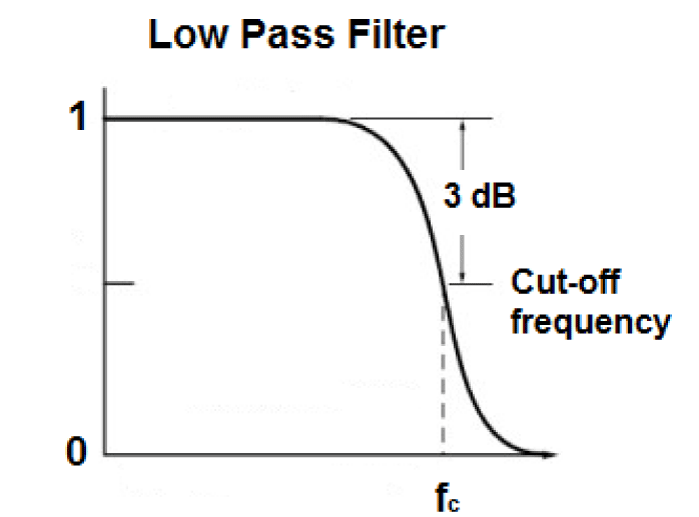
In these filters, the frequencies less than the cut-off frequency are transmitted and above that are removed. A low pass filter response is shown in figure 5.
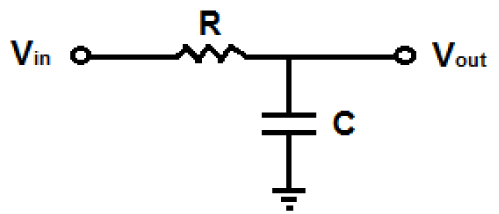
The simplest low pass filter can be designed with the help of a resistor and a capacitor called as a 1st order RC circuit. The low pass filtered signal is detected across the capacitor. The 1st order low pass filter circuit is shown in figure 6.
The cut-off frequency equation for the circuit in figure 6 is given in equation 3.
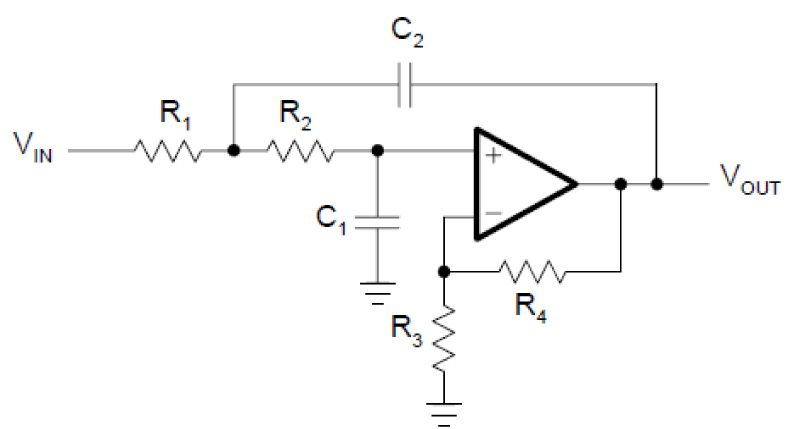
A 2nd order low pass filter can be more effective as compared to a 1st order one. It designed by cascading two 1st order filters attached to an operational amplifier. The circuit is given in figure 7.
The cut-off frequency of the circuit in figure 7 is given in Equation 4. R3 and R4 are optional as they are required for separate gain settings as given in equation 5.
Amplification
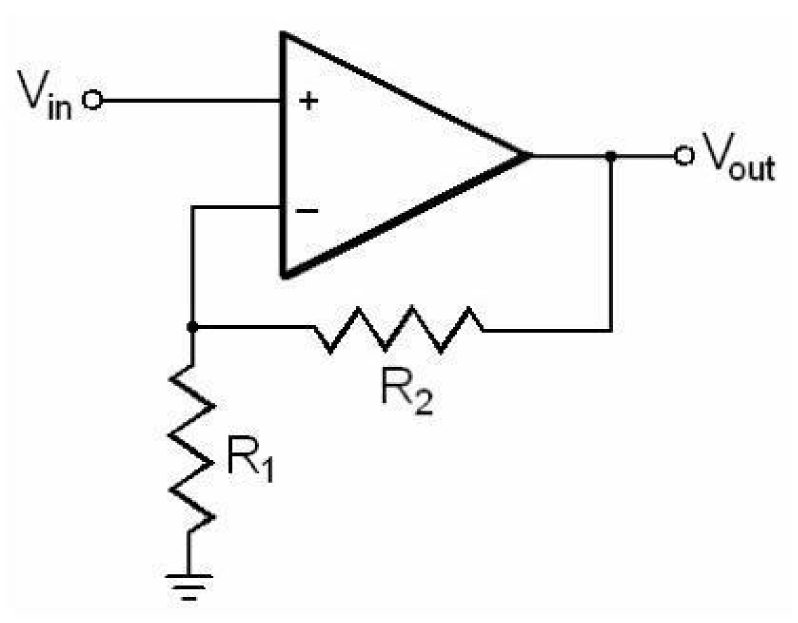
After the signal has been filtered properly and a suitable band of EMG frequency is obtained, the EMG signal obtained has to be powered up to a suitable level. The amplification of the EMG signal can be easily carried out with the help of a non-inverting amplifier, shown in figure 8. The gain of the amplifier is given in equation 6. The non-inverting amplifier is only used when the signal is being received from a single wire referenced to ground. Amplification can be done in stages in order to cater for chip requirements, by cascading them in series. The EMG signal, as mentioned before, is very weak i.e. only 1-10 mV. For certain muscles, for which the signal response is very strong e.g. Biceps Brachii, a gain of 500-1000 can be enough.
Final Design
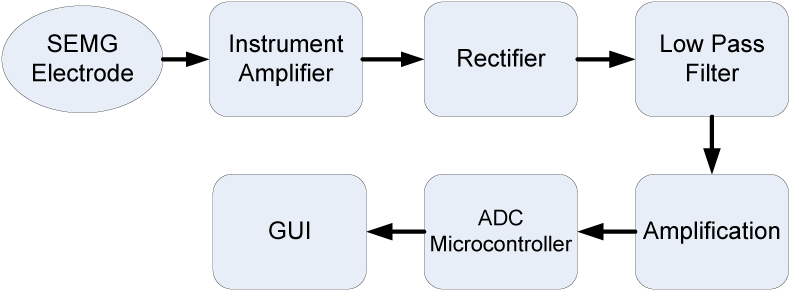
From SEMG to get the final result data of power muscle can be shown as block diagram in figure 9. A 10 bit ADC feature in microcontroller based on ATMEGA328 are needed with 20 data sampling per second or fresh rate at 50 ms. After the ADC progress, we get the data information to GUI via a PC, where in this GUI data should be recorded and viewed as a real time information table and graphics to users.
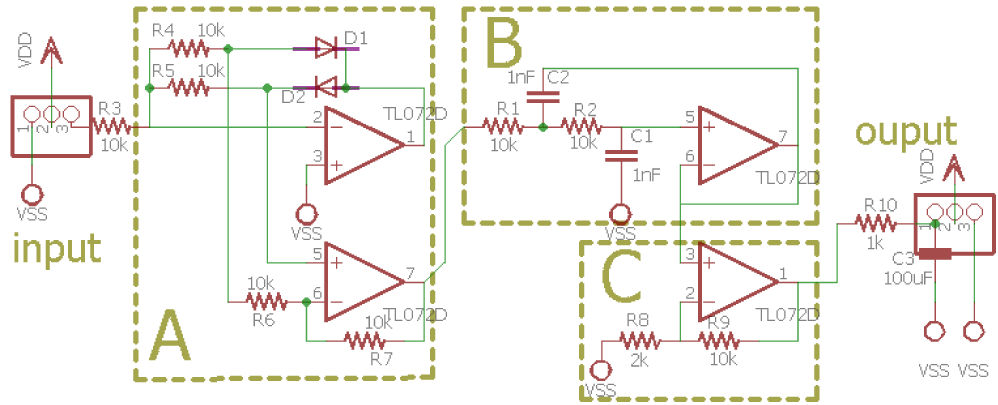
As we can see in figure 9, electrode and instrument amplifier are included in one device as it is an active SEMG with an amplified RAW sinusoidal output. From its output the amplification for detected EMG signal was 1000x. With a sinusoidal output voltage it needed to be rectified before processed in ADC level. From rectifier, low pass filter and last amplification hardware design schematic using TL072 OP Amp given in figure 10. With these setup we get 6x gain amplification and fc = 15.9 kHz.
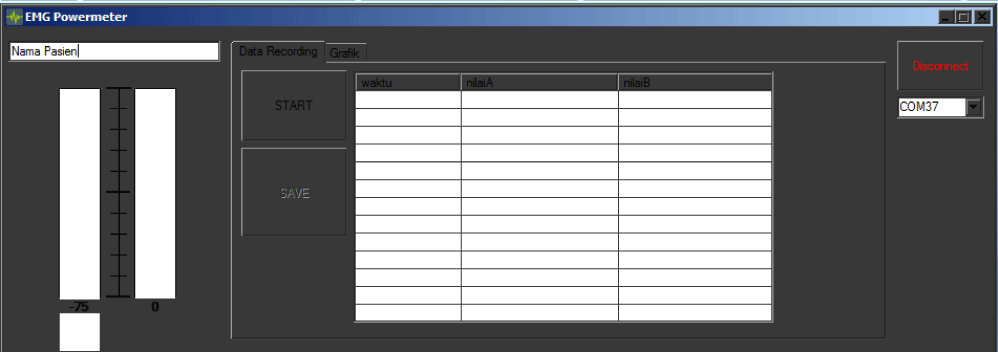
For the record and real time monitoring GUI, there was designed a windows based program build from Microsoft Visual C# as given in figure 11. This GUI has output information about maximum power, minimum power, and average power muscle data for diagnose purposes.
Results
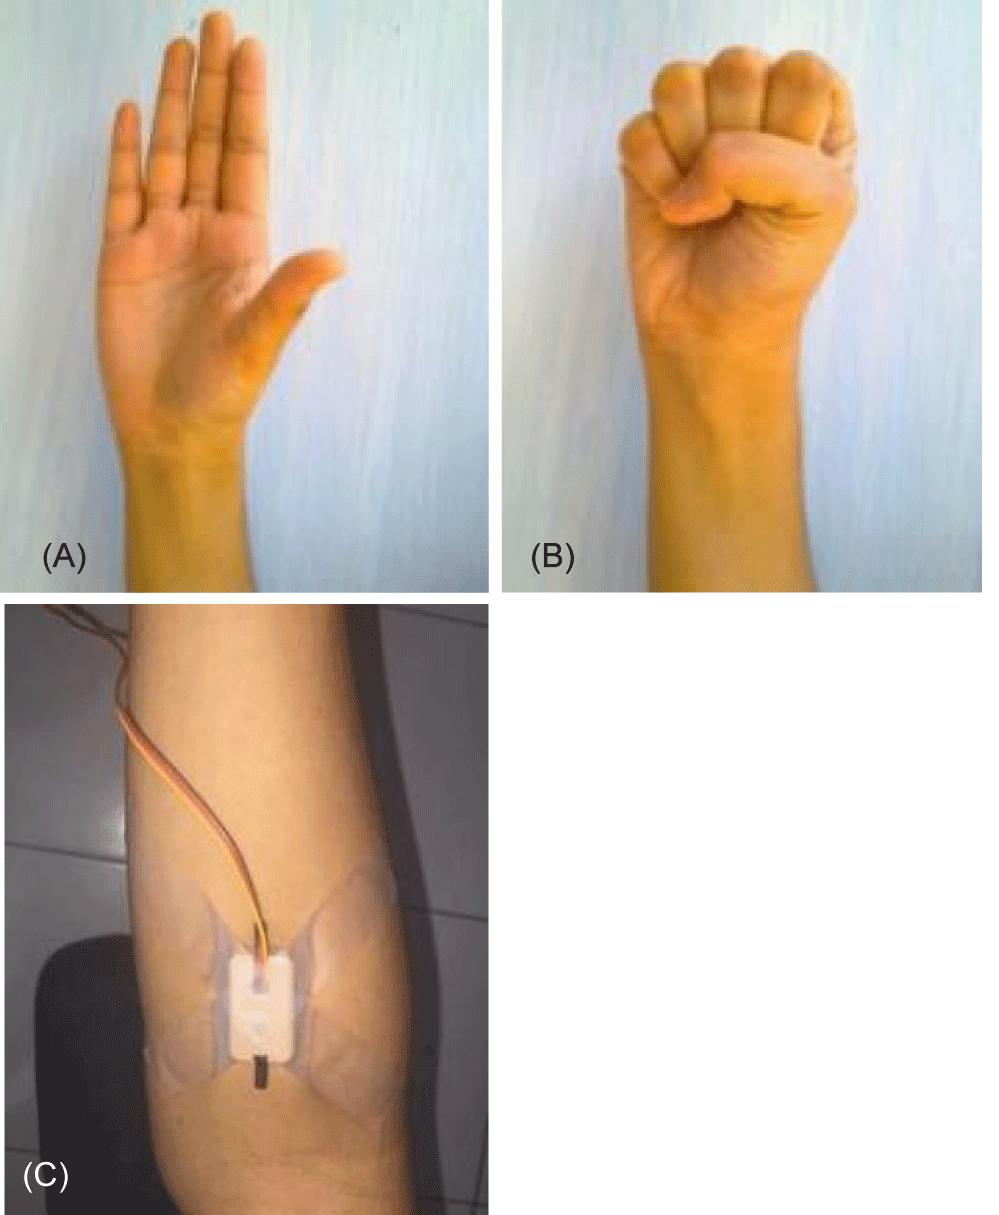
The aim of this instrument is to measure muscle power and record them to get some information. For these there are five samples of healthy people to test their hand muscle measurement to get muscle information in contraction and relax position seen in figure 12 and the data can be seen in table 1.
| Table 1: Mean data result of five subjects (A, B, C, D, and E) in Volts. | ||||||
| Position | Subject | A | B | C | D | E |
| Relax | Min Power | 1.46 | 1.46 | 1.46 | 1.46 | 1.46 |
| Max Power | 1.65 | 1.54 | 1.76 | 1.81 | 1.68 | |
| Average | 1.48 | 1.46 | 1.74 | 1.67 | 1.59 | |
| Contraction | Min Power | 1.46 | 1.46 | 1.46 | 1.46 | 1.46 |
| Max Power | 3.42 | 3.21 | 3.16 | 3.38 | 3.14 | |
| Average | 3.08 | 2.53 | 2.73 | 2.90 | 2.81 | |
From data above, we can see the significant difference muscle power from relax for 1.584 Volts and contraction for 2.81 Volt.
Conclusion
A raw EMG signal contains more important information regarding the nervous system in useless form. Designed filter can overcome noise from RAW signal, the output signal can be read well in microcontroller level thanks to total 6000x gain perform. The relax voltage signal from muscle measurement is 1.584 Volt and for contraction muscle voltage signal is 2.81 Volt, for healthy people. In measurement progress sweats can be problems which make measured signal rise about ±1 Volts when the muscle in relax position, so there is a little difference about relax and contracted muscle. So it is advised to prepare well the subject skin to keep dry and not moisten with sweat.
References
- Jiménez FR, Verlinden O. Review of control algorithms for robotic ankle systems in lower-limb orthoses, prostheses, and exoskeletons. Med Eng Phys. 2012;37:505–511. https://tinyurl.com/26dzmpbr
- Ferris DP, Gordon KE, Sawicki GS, Peethambaran A. An improved powered ankle-foot orthosis using proportional myoelectric control. Gait Posture. 2006 Jun;23(4):425-428. doi: 10.1016/j.gaitpost.2005.05.004. Epub 2005 Aug 10. PMID: 16098749.
- Konrad P. The ABC of EMG, A Practical Introduction to Kinesiological Electromyography. Noraxon Inc Scottsdale, AZ, USA. 2005. https://tinyurl.com/6czyz5zu
- Wan Daud, Yahya, Horng, Sulaima, Sudirman R. Features extraction of electromyography signals in time domain on biceps brachii muscle. International Journal of Modeling and Optimization. Bucharest, Romania. 2013;3(6):515-519. https://tinyurl.com/yc6zrjku
- Raez MB, Hussain MS, Mohd-Yasin F. Techniques of EMG signal analysis: Detection, processing, classification and applications. Biol Proced Online. 2006;8:11-35. doi: 10.1251/bpo115. Epub 2006 Mar 23. Erratum in: Biol Proced Online. 2006;8:163. PMID: 16799694; PMCID: PMC1455479.
- Chowdhury RH, Reaz MB, Ali MA, Bakar AA, Chellappan K, Chang TG. Surface electromyography signal processing and classification techniques. Sensors (Basel). 2013 Sep 17;13(9):12431-12466. doi: 10.3390/s130912431. PMID: 24048337; PMCID: PMC3821366.
- Bin Ahmad Nadzri AA, Ahmad SA, Marhaban MH, Jaafar H. Characterization of surface electromyography using time domain features for determining hand motion and stages of contraction. Australas Phys Eng Sci Med. 2014 Mar;37(1):133-137. doi: 10.1007/s13246-014-0243-3. Epub 2014 Jan 18. PMID: 24443218.
- Di Nardo F, Mengarelli A, Maranesi E, Burattini L, Fioretti S. Assessment of the ankle muscle co-contraction during normal gait: a surface electromyography study. J Electromyogr Kinesiol. 2015 Apr;25(2):347-354. doi: 10.1016/j.jelekin.2014.10.016. Epub 2014 Nov 7. PMID: 25465985.
- Ahmad SA, Chappell PH. Surface EMG pattern analysis of the wrist muscles at different speeds of contraction. J Med Eng Technol. 2009;33(5):376-385. doi: 10.1080/03091900802491246. PMID: 19440916.
- Jamal MZ. Computational intelligence in electromyography analysis – A perspective on current applications and future challenges. Intech. 2012;18. https://tinyurl.com/yj9td4nn
- Scott Day. Important factors in surface EMG measurement. Bortec Biomedical Incorporated. https://tinyurl.com/4cfjckx2
Content Alerts
SignUp to our
Content alerts.
 This work is licensed under a Creative Commons Attribution 4.0 International License.


