Environmental Sciences . 2022 April 25;3(4):394-405. doi: 10.37871/jbres1455.
Lands Abutting Seas, Oceans, 85% of World’s Coronavirus Deaths
Craven JS*
Abstract
The Worldometer Coronavirus registered six million deaths on March 03, 2022. 85% of the deaths occurred in lands directly abutting the World Seas and Oceans. The WHO, CDC and other World Public Health Organizations suggest that humidity can aid in the fight against COVID-19 [1]. The boundary of this comment is that it is directed at indoor air quality with perspective that 40-60% humidity is positive against COVID-19. The fact that almost all the World COVID-19 deaths are in lands directly abutting the Major World Seas and Oceans, with their inherent natural humidity, does not seem to be addressed in technical literature. There seems to be a conflict. This paper provides a breakdown of the World’s deadliest coronavirus regions at the six million death milestone, compares it to the earlier evaluation by the author captured in a WordPress website [2-10], and provides an in depth breakdown of the pandemic deaths and death rates in the lands abutting the Major World Seas and Oceans. Maps are provided showing the surrounding Countries or States of Countries with death and death rate tables for each of the World’s Major bodies of water. These are startling in similarity.
Introduction
This paper is a follow-up to the evaluation conducted from April 2020 through December 2021 on the “World’s Coronavirus Death Regions and Why”. The full evaluation, which consisted of nine power point presentations is stored on a WordPress.com website created November 2021.1 Parts 9 & 10 [9,10] of that evaluation, completed at the five million COVID-19 death milestone, focused on the fact that the vast majority of the world’s coronavirus deaths had occurred in the Countries and States of Countries directly abutting the World’s Seas and Oceans. In December 2021 an additional Part 11 [11] was created connecting (a) the learnings from a half dozen published technical papers authored in Europe and Asia and (b) hypothesizing that the primary mode of transmission of coronavirus was from people as aerosols to absorption on fine pollutant particulates, over substantial distances, to people. At these micron to sub-micron sizes, the pollutant carrying coronavirus aerosols not only enter and affect people’s lungs, but pass through the lungs to people’s stomachs and bloodstreams.
On March 03, 2022 the Worldometer Coronavirus reported that the World reached six million reported coronavirus deaths. This paper confirms that 85% of the World’s coronavirus deaths have occurred in lands abutting the Seas and Oceans and reemphasizes the previously determined likely factors characteristic of these areas which magnify the intensity of coronavirus transmission and deaths.
Discussion
Craven’s initial evaluation [2-10] identified that the world had five significant coronavirus death regions, which accounted for 89% of the world’s coronavirus deaths. They included the four regions of European Diaspora (Eastern and Western Europe and North and South America) plus the region of the Middle East/Southwest Asia (ME/SW Asia). The data at the six million death milestone, reached on March 03, 2022, is provided in table 1. This table accounts for 99.8% of the World’s deaths dividing them into eight Regions. Eastern Europe became the Region with highest death rate, with South America a close second. Death rates in Africa and the Far East remained at 5% of Eastern Europe and South America.
| Table 1: Total COVID-19 pandemic deaths, death rates, population by Region - March 03, 2022. | ||||
| Region | Ave Death Rate | Deaths | MM pop | % Urban pop |
| Eastern Europe | 2,952 | 917,645 | 311 | 64% |
| South America | 2,915 | 1,273,654 | 437 | 75% |
| North America | 2,512 | 1,377,722 | 549 | 73% |
| Western Europe | 1,525 | 867,563 | 569 | 75% |
| Middle East | 807 | 350,335 | 434 | 71% |
| Southwest Asia | 331 | 621,525 | 1,880 | 30% |
| Africa | 175 | 244,129 | 1,394 | 46% |
| Far East | 151 | 333,669 | 2,207 | 63% |
| Totals | 769 | 5,986,242 | 7,780 | |
| 3-Mar-22 | 6,000,753 | 7,800 | ||
| Percent of World | 99.8% | 99.7% | ||
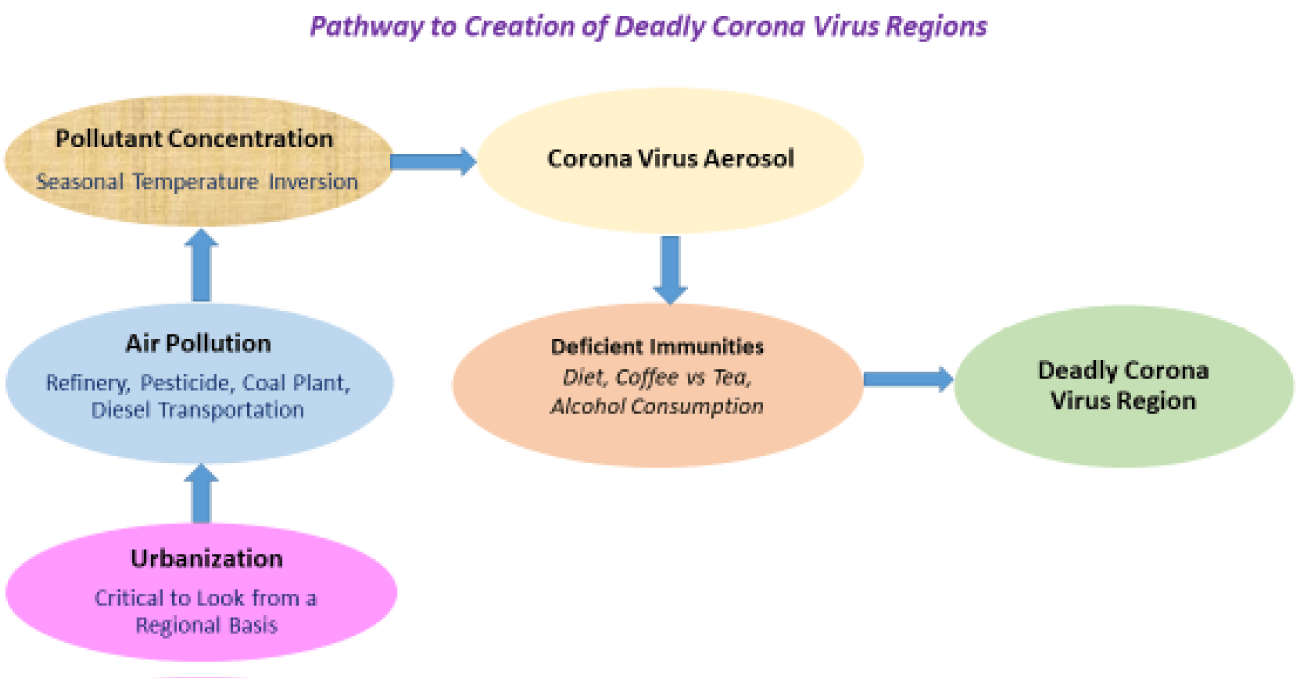
The earlier evaluation proposed the hypothesis that a “Pathway to Creation of Deadly Coronavirus Regions” existed. This Pathway is shown on figure 1.
The critical factors affecting coronavirus deaths identified in the initial evaluation were (a) massive emissions of pollution from a variety of well-known sources (refineries, coal-powered generation, diesel transportation land and sea, pesticides spraying, consumption, runoff) in (b) congested regions of population under (c) meteorogical weather conditions of temperature inversions. The hypothesized conclusion from this data-based observation in May 2020 was that the primary mode of coronavirus transmission had to be via virus aerosols attaching to the surfaces of fine pollutants. Investigation over the past months then determined that Global Air Quality Indices are based on PM2.5 and PM10 pollution particulates measured on a mass basis, not particle number or surface area. It took an additional year to grasp the importance of this distinction and its impact to the transmission of coronavirus aerosols over long distances. Studies in 2021 [11-19] provided critical input on (a) the reality that in the World’s major cities there is a ratio of 0.7 unmeasured sub-micron pollutant particulates to 1.0 measured PM2.5 and PM10 pollution particulates, and (b) that these sub-micron pollution particulates are capable of travelling substantial distances from their sources allowing for extensive personnel contact. At these fine sizes the pollutant/virus aerosols are capable of not only entering the lungs but also of entering further into the stomachs and bloodstreams, which is important as this affects the body’s natural immunities. Under temperature inversion conditions, with low wind speeds and minimal vertical air mixing, these pollutant/virus aerosols are capable of traveling up to hundreds of miles, well within the half-life of coronavirus aerosols on pollutant particulate surfaces typically in days [3,11-19].
Table 2 summarizes total coronavirus deaths, death rates, and accumulated percent of World deaths for the forty-two deadliest coronavirus countries, which accounted for 90% of the World’s pandemic deaths on March 03, 2022. The deaths in these countries descended from near one million in the USA to near 20,000 in Myanmar. Ninety countries of the 224 tracked by Worldometer Coronavirus had over 4,000 deaths, and accounted for 98% of the World’s total. Twenty-one countries accounted for 80% of the total. Six countries accounted for 50% of the World’s pandemic deaths – USA, Brazil, India, Russia, Mexico, and Peru. The pandemic is world-wide, but the bulk of coronavirus deaths are concentrated into narrow regions of the World.
| Table 2: Total COVID-19 pandemic deaths, death rates, accumulative by Country - March 03, 2022. | |||||||||
| Rank | Country | Deaths | Death Rate | Acc vs World | Rank | Country | Deaths | Death Rate | % of World |
| 1 | USA | 981,729 | 2,937 | 16% | 22 | Chile | 42,683 | 2,201 | 81% |
| 2 | Brazil | 650,646 | 3,025 | 27% | 23 | Hungary | 42,211 | 4,596 | 81% |
| 3 | India | 514,620 | 367 | 36% | 24 | Vietnam | 40,547 | 410 | 82% |
| 4 | Russia | 354,011 | 2,424 | 42% | 25 | Czechia | 38,787 | 3,611 | 83% |
| 5 | Mexico | 318,835 | 2,430 | 47% | 26 | Canada | 36,843 | 962 | 83% |
| 6 | Peru | 210,851 | 6,250 | 51% | 27 | Bulgaria | 35,716 | 5,205 | 84% |
| 7 | UK | 161,898 | 2,364 | 53% | 28 | Equador | 35,264 | 1,949 | 84% |
| 8 | Italy | 155,399 | 2,577 | 56% | 29 | Malaysia | 33,028 | 999 | 85% |
| 9 | Indonesia | 143,361 | 517 | 58% | 30 | Pakistan | 30,237 | 133 | 85% |
| 10 | France | 138,942 | 2,121 | 60% | 31 | Belgium | 30,217 | 2,588 | 86% |
| 11 | Colombia | 138,939 | 2,683 | 63% | 32 | Bangladesh | 29,058 | 174 | 86% |
| 12 | Iran | 137,439 | 1,602 | 65% | 33 | Tunisia | 27,857 | 2,317 | 87% |
| 13 | Argentina | 126,531 | 2,757 | 67% | 34 | Greece | 26,036 | 2,518 | 87% |
| 14 | Germany | 124,265 | 1,475 | 69% | 35 | Iraq | 25,028 | 600 | 88% |
| 15 | Poland | 112,130 | 2,968 | 71% | 36 | Egypt | 24,149 | 229 | 88% |
| 16 | Ukraine | 105,505 | 2,437 | 73% | 37 | Japan | 24,092 | 191 | 89% |
| 17 | Spain | 100,239 | 2,143 | 75% | 38 | Thailand | 23,073 | 329 | 89% |
| 18 | So Africa | 99,499 | 1,643 | 76% | 39 | Netherlands | 21,589 | 1,255 | 89% |
| 19 | Turkey | 95,025 | 1,107 | 78% | 40 | Bolivia | 21,433 | 1,796 | 90% |
| 20 | Romania | 63,782 | 3,353 | 79% | 41 | Portugal | 21,141 | 2,083 | 90% |
| 21 | Philippines | 56,538 | 505 | 80% | 42 | Myanmar | 19,379 | 352 | 90% |
The initial evaluation [9,10] determined that 85% of all the world’s coronavirus deaths, when the World reached 5 million deaths on October 29, 2021, occurred in countries directly abutting the world’s Seas and Oceans. The previous evaluations by Craven [8-10] were updated in this paper to determine if significant findings had changed since passing the 5 million death milestone. This paper reconfirms this same phenomenon at the six million death milestone.
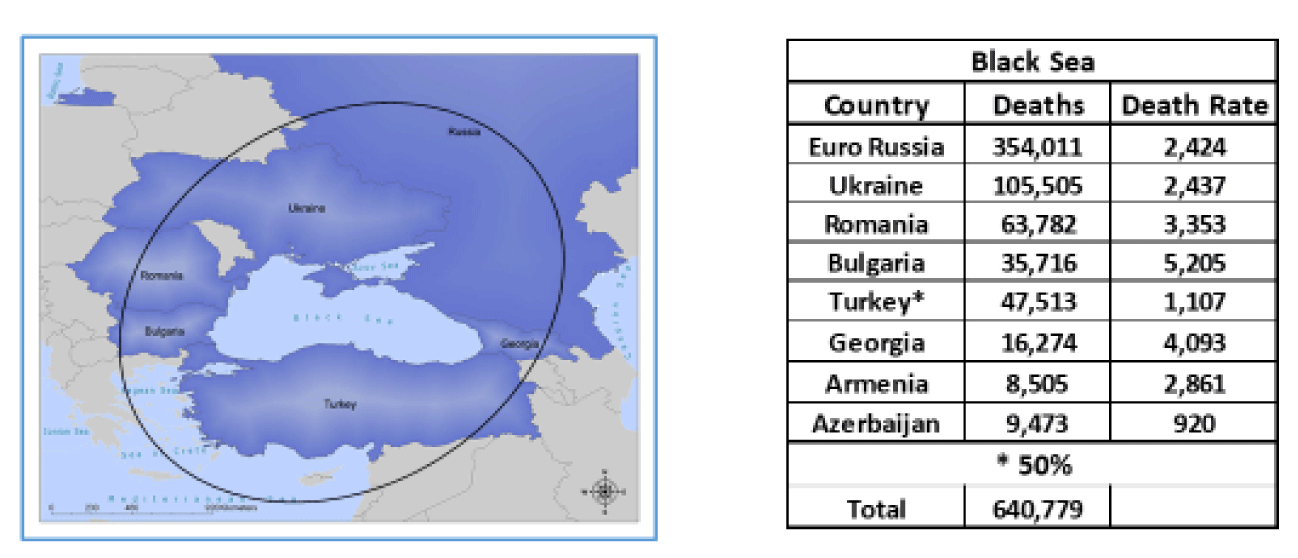
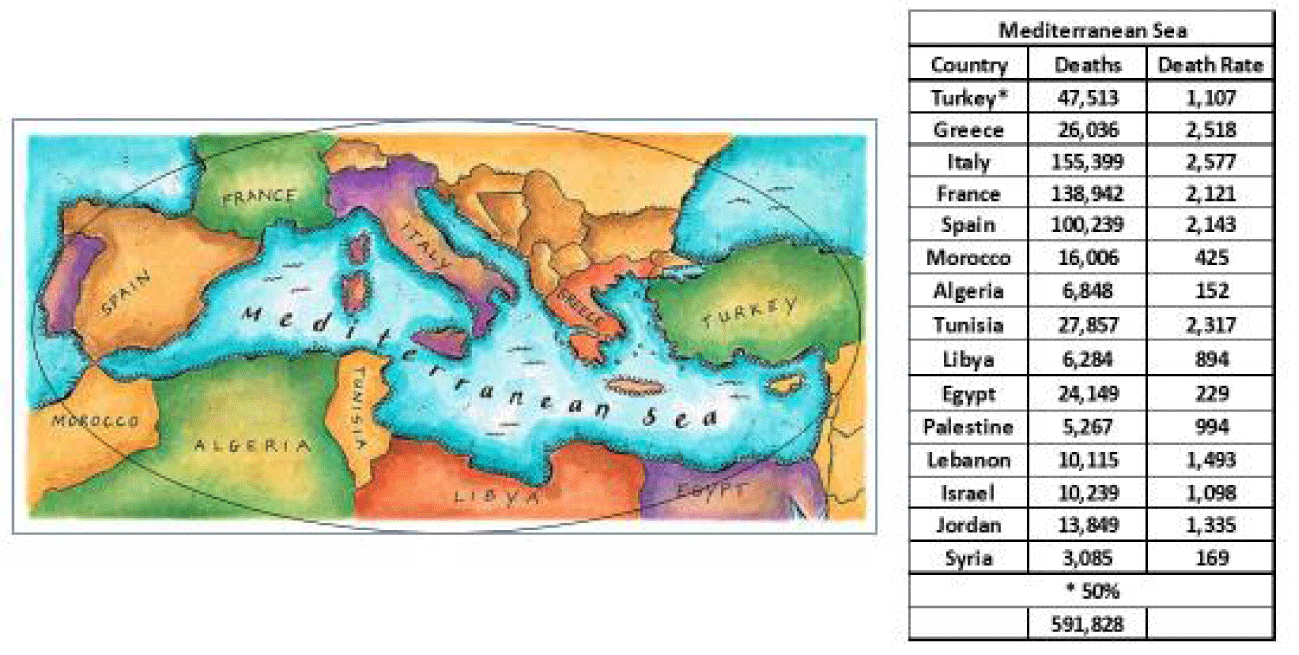
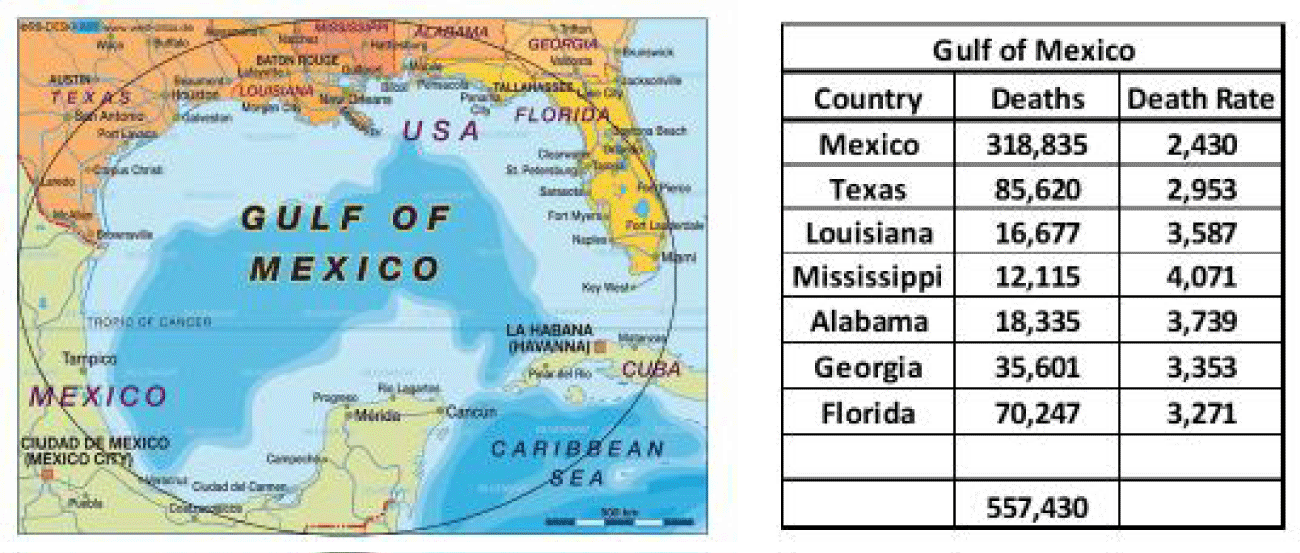
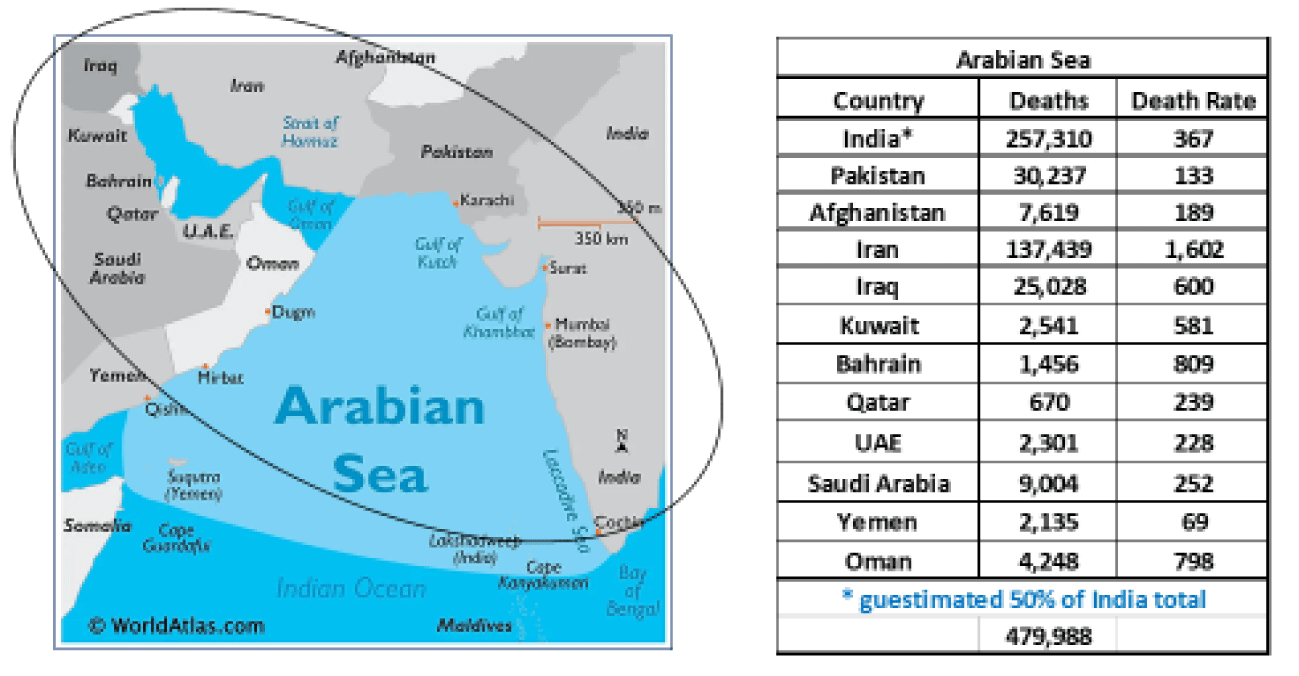
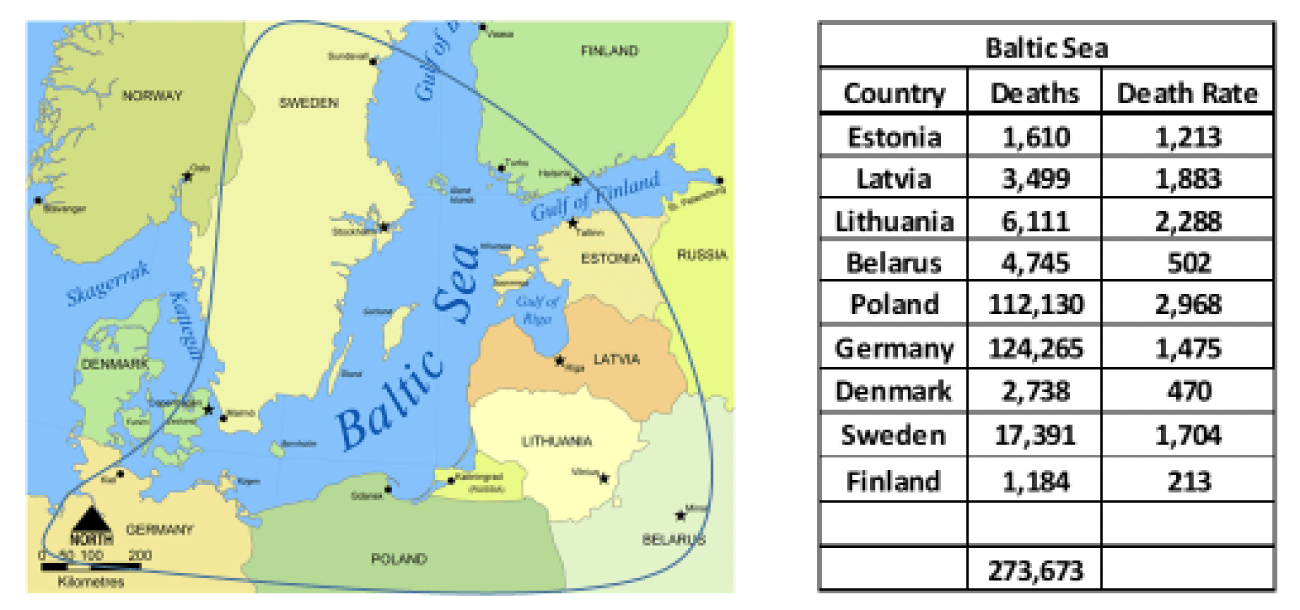
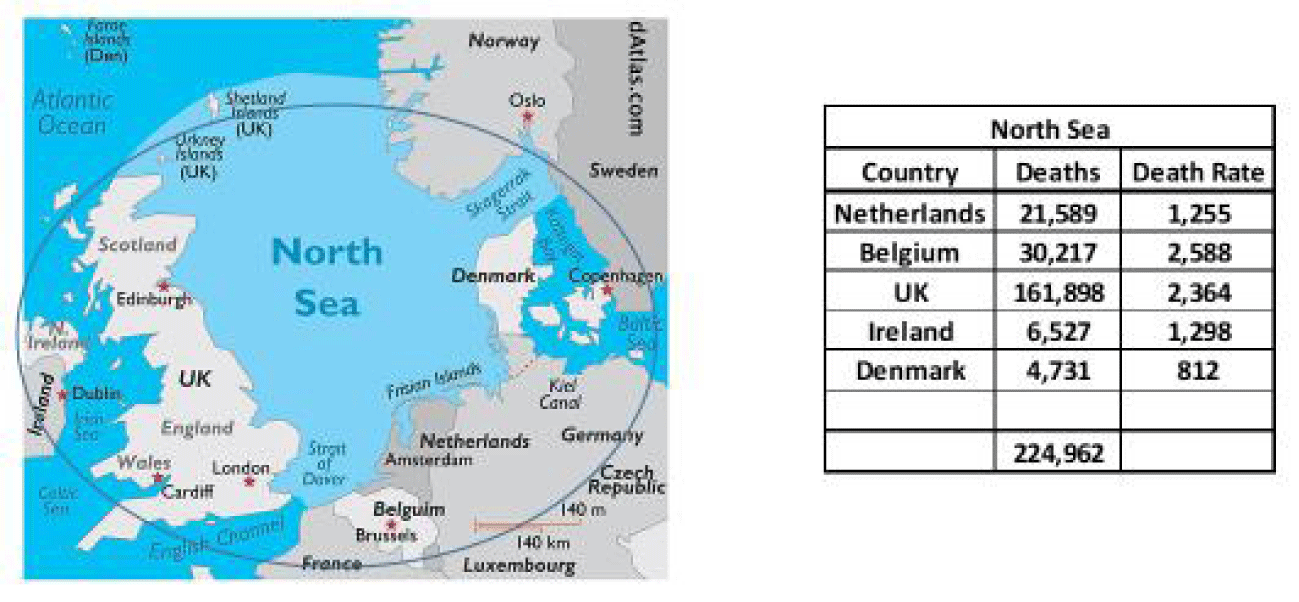
Table 3 summarizes the World’s coronavirus deaths on lands directly abutting the World’s Major Seas. Total deaths accounted for are 3,339,801, 55.7% of the World’s total pandemic deaths. The lands surrounding the Black Sea plus Mediterranean Sea alone account for 20.6% of the World’s total.
| Table 3: COVID-19 deaths in lands directly bordering major world seas – March 03, 2022. | ||
| Major World Sea | COVID-19 Deaths | % of World’s Deaths |
| Black Sea | 640,779 | 10.7 |
| Mediterranean Sea | 591,828 | 9.9 |
| Gulf of Mexico | 557,430 | 9.3 |
| Arabian Sea | 479,988 | 8.0 |
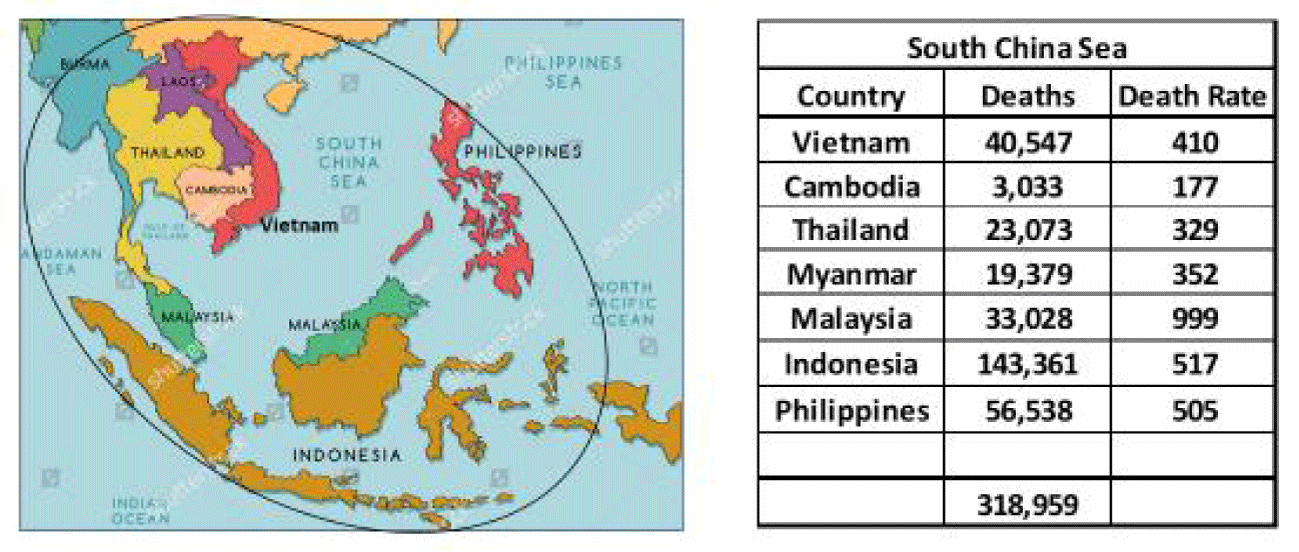
| South China Sea | 318,959 | 5.3 |
| Baltic Sea | 273,673 | 4.6 |
| North Sea | 224,962 | 3.7 |
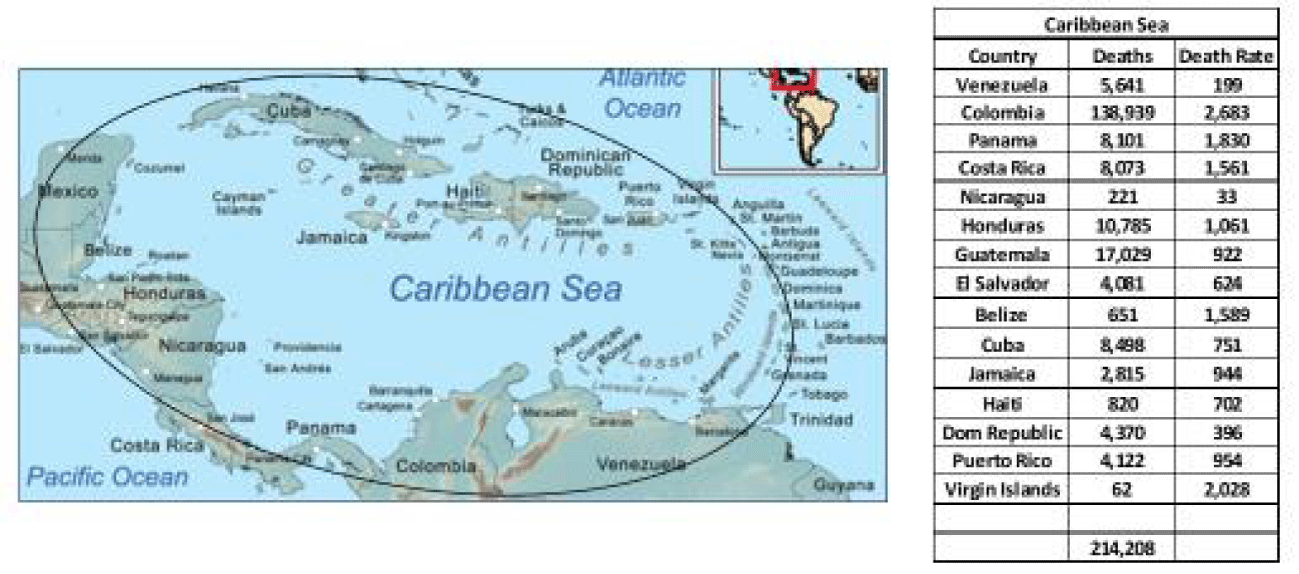
| Caribbean Sea | 214,208 | 3.6 |
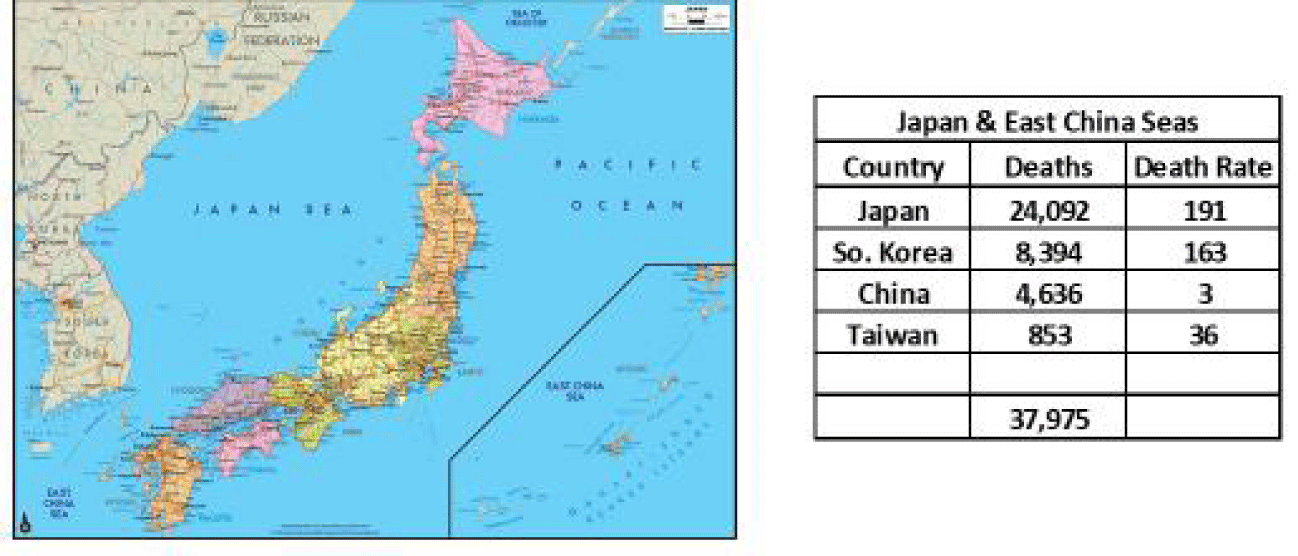
| East China + Japan | 37,975 | 0.6 |
| 50% of assumed India’s deaths included in Arabian Sea | ||
| 50% of Turkey’s deaths included each in Black & Mediterranean Seas | ||
| Total for Border Countries | 3,339,801 3/3/22 |
55.7% of World’s Deaths |
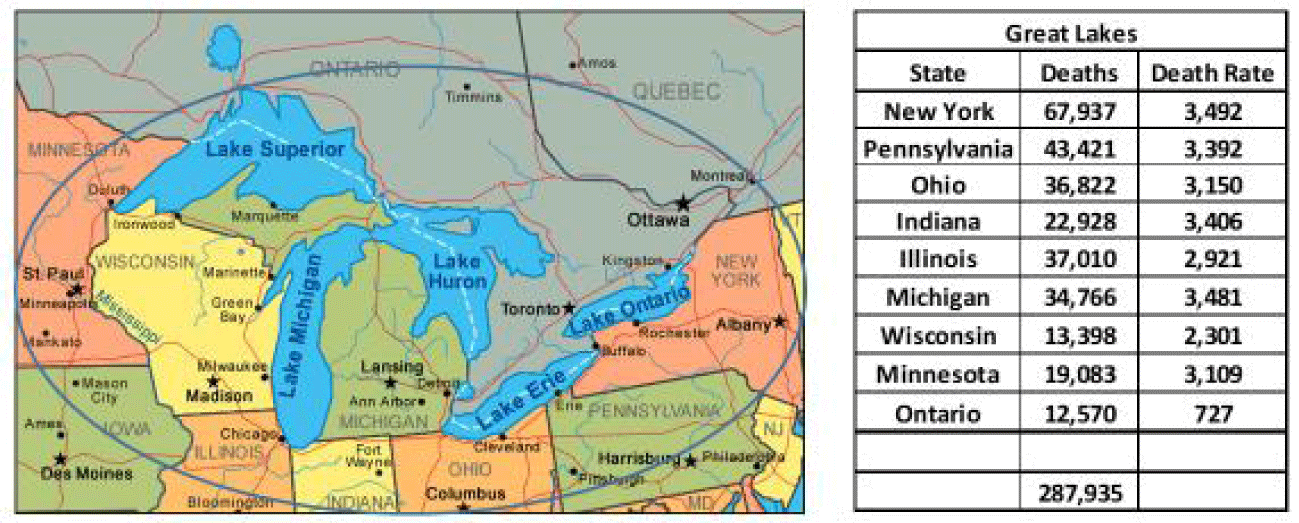
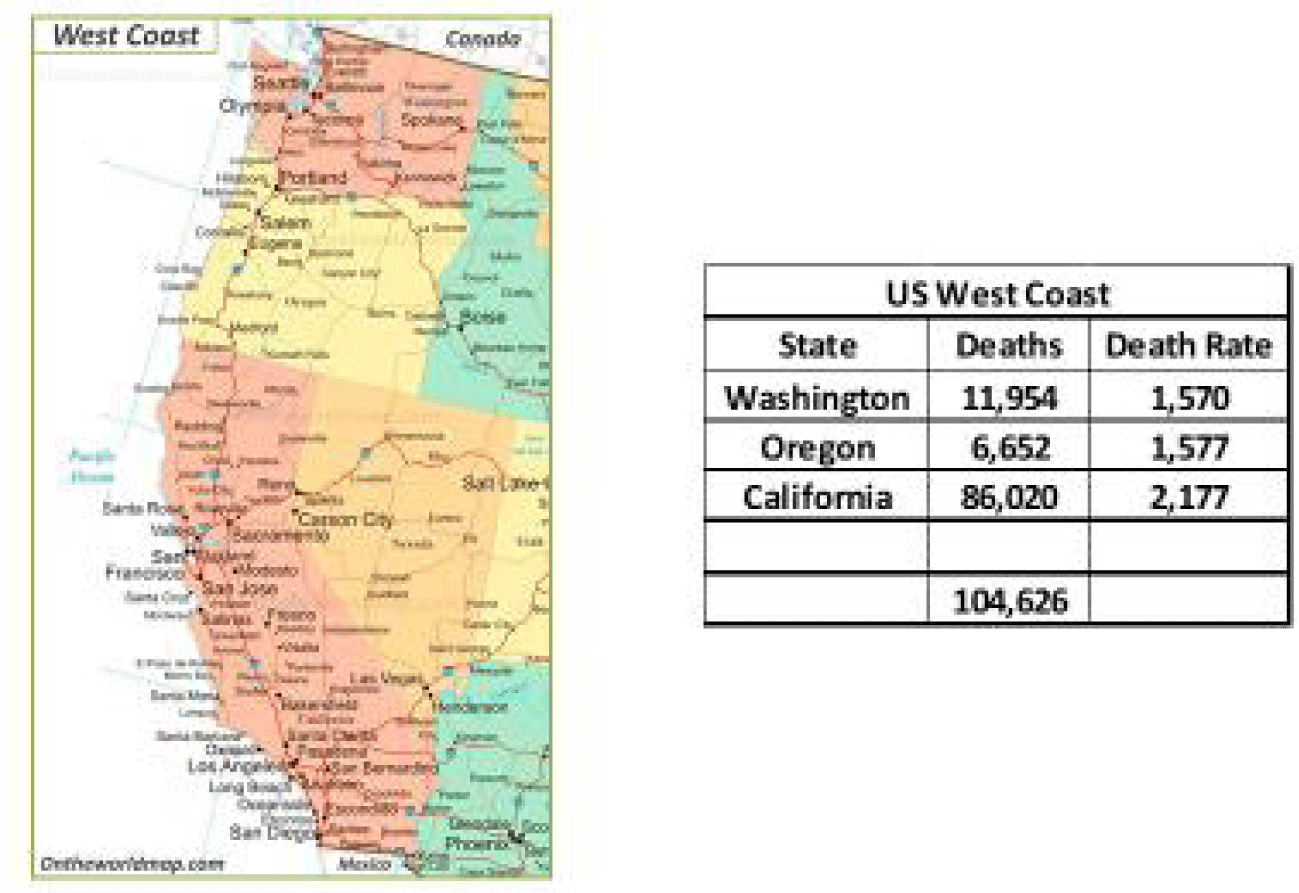
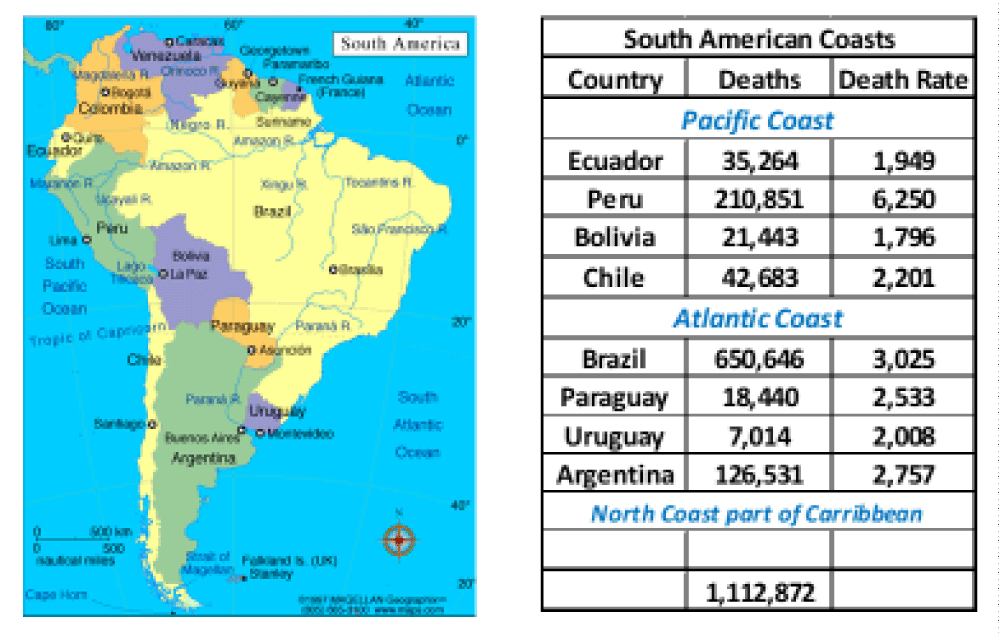
Table 4 summarizes the World’s coronavirus deaths on lands directly abutting the Major World Seas shown in table 3 plus the lands of the US Pacific and Atlantic Ocean Coasts, South America’s Pacific and Atlantic Ocean Coasts, and South Africa’s Atlantic and Indian Ocean Coasts. All of these are brackish waters. Table 4 further includes the coronavirus deaths in the US States and one Canadian Province abutting the US Great Lakes. Total deaths accounted for on these lands abutting the World’s Major water bodies are 5,100,800, 85% of the World’s total pandemic deaths.
| Table 4: COVID-19 Deaths in Countries Directly Bordering Seas and Oceans – March 03, 2022. | ||
| Sea/Ocean Region | Deaths | % of World Deaths |
| Major World Seas | 3,339,801 | 55.7% |
| South America Coastal* | 1,112,872 | 18.4% |
| South Africa Coastal | 103,509 | 1.7% |
| US Pacific Coast | 104,626 | 1.7% |
| US Atlantic Coast** | 152,057 | 2.5% |
| US Great Lakes*** | 285,346 | 4.8% |
| March 3, 2022 | 5,100,800 | 85.0% |
| Global Total Deaths | 6,000,753 | |
| *Less Caribbean Countries | ||
| **New York State included with Great Lakes Region, not US Atlantic Coast | ||
| ***World’s largest fresh water body | ||
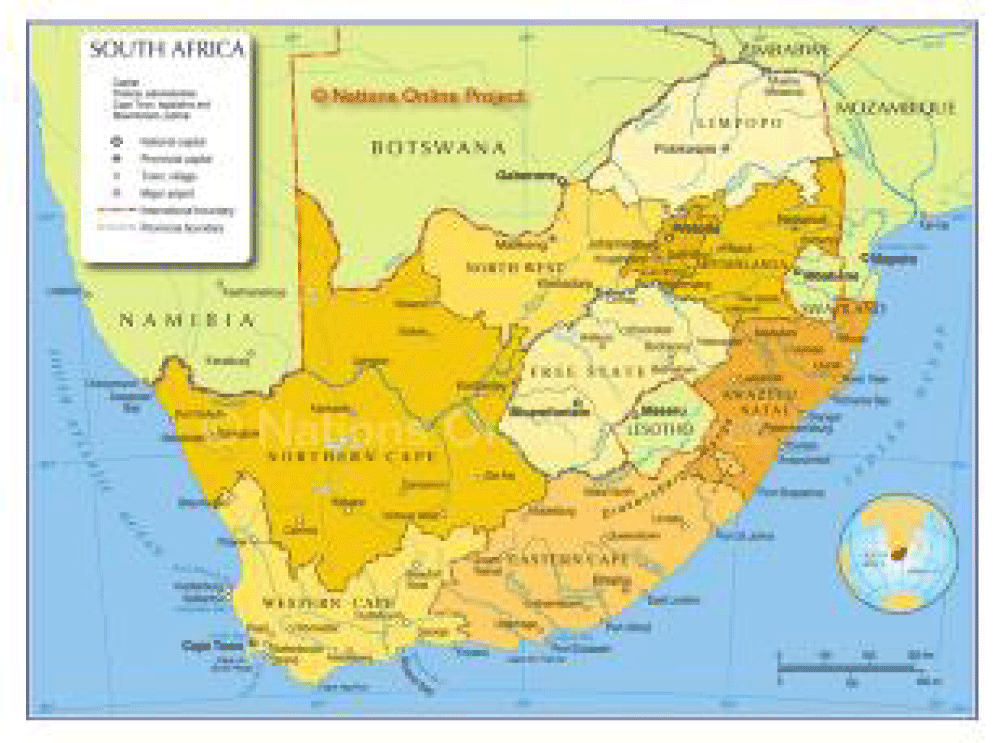
Figures 2-15 provide maps with death and death rate summary table for each region of lands abutting the Major Seas and Oceans.
Words inadequately express these facts. Visualization by looking at all the maps is essential to grasp the significance.
The factors associated with this phenonenom of 85% of World’s deaths directly in lands abutting the World’s Major Seas and Oceans are explained in World’s Coronavirus Death Region Why, Part 8 and Part 9 [9,10].
The lands with these deaths abutting the Major World Seas and Oceans appear to be impacted hundreds of miles inland from the water source. This finding is important as it indicates that the range of coronavirus transmission from the Seas can easily be hundreds of miles and is consistent with the above comments about transmission of virus aerosols carried by sub-micron pollution particulates over long distances.
On February 11 and 12, 2022 a review of the countries with the highest death rates, as reported on the Worldometer Coronavirus, was made as the World, during early February, was again experiencing 12,000 coronavirus deaths per day. This led to the determination that East-Central Europe was the World’s Deadliest Coronavirus Region [20]. This paper [20] included an Appendix summarizing the work by Cunningham [21] emphasizing the extent of horrendous pollution in East-Central Europe created during the period this area was part of the USSR. Consistent to the conclusion by Craven (2021) that “pollution is complicit to all coronavirus deaths”, the determination that East-Central Europe was the World’s Deadliest Coronavirus Region expanded that conclusion to the more profound “extreme pollution results in extremely high death rates”.
Conclusion
This paper has re-confirmed, at the six million coronavirus pandemic death milestone, the fact that 85% of the World’s deaths are on the lands directly abutting the World’s Major Seas and Oceans. Comparison of the results of this analysis to Craven’s earlier evaluation (Craven, 2021) demonstrates the validity of that evaluation. Pollution is complicit to all coronavirus deaths. Extreme pollution leads to extreme virus death rates. A search for technical literature addressing the fact of most COVID-19 deaths occurring in lands directly abutting the World Major Seas and Oceans provided nothing. These bodies of water have naturally high humidity, are predominantly brackish, are home to intense oil and gas drilling and refining and coal-fired power generation, are the pathway of commercial shipping and luxury ocean liners fired with dirty diesel fuel, tend to be acidic from industrial CO2 emissions, and annually experience temperature inversions which concentrate the pollutants. In most cases runoff from excessive pesticide use contaminants these bodies of water. Even cosmetics and suntan lotions from bathers has been found to generate ultrafine pollutants. All of these pollution sources provide airborne particulate surfaces, which are potential carriers for coronavirus aerosols with known half-lives of days over great distances.
References
- Joseph A, Chan Harvard TH. OP-ED: Humidity can aid in the fight against Covid-19. School of Public Health. 2020 November 18.
- Craven JS. World’s Coronavirus Death Regions & Why, Part 1 – recognition that world regions independently experienced coronavirus deaths in identifiable patterns, principally impacted by major pollution sources and exasperated by seasonal temperature inversions. WordPress.com. 2021. doi: 10.17352/acmph.
- Craven JS. World’s Coronavirus Death Regions & Why, Part 2 – Considered differences of Western World vs Eastern World do to wide difference in deaths. WordPress.com. 2021.
- Craven JS. World’s Coronavirus Death Regions & Why, Part 3 – Recognized that majority of deaths were occurring in humid sub-tropical climates. WordPress.com.
- Craven JS. World’s Coronavirus Death Regions & Why, Part 4 - With abrupt increase in South American deaths, focused on role of pesticides on creating deaths. WordPress.com. 2021.
- Craven JS. World’s Coronavirus Death Regions & Why, Part 5 - Evaluated whether other world regions were similar in characteristics as their deaths increased to those in Parts 1 through 4. WordPress.com.
- Craven JS. World’s Coronavirus Death Regions & Why, Part 6 - Realized that coronavirus deaths regions were being controlled by the world’s jet streams. WordPress.com. 2021.
- Craven JS. World’s Coronavirus Death Regions & Why, Part 7 - Updated world coronavirus death statistics for the predominant deadly regions. WordPress.com. 2021.
- Craven JS. World’s Coronavirus Death Regions & Why, Part 8 - Realized that the world’s largest brackish Seas, encompassing major pollution sources, accounted for 55% of world’s coronavirus deaths. WordPress.com. 2021.
- Craven JS. World’s Coronavirus Death Regions & Why, Part 9 - Extended evaluation to world’s brackish Oceans to findings for brackish Seas, accounting for 85% of world’s coronavirus deaths. WordPress.com. 2021.
- Craven JS. World’s Coronavirus Death Regions & Why, Part 11, Influence of sub-micron and nano-sized pollutant particles on the Transmission of Coronavirus Over Long Distances. Wordpress.Com. 2021.
- Wang CC, Prather KA, Sznitman J, Jimenez JL, Lakdawala SS, Tufekci Z, Marr LC. Airborne transmission of respiratory viruses. Science. 2021 Aug 27;373(6558):eabd9149. doi: 10.1126/science.abd9149. PMID: 34446582; PMCID: PMC8721651.
- Ren SY, Wang WB, Hao YG, Zhang HR, Wang ZC, Chen YL, Gao RD. Stability and infectivity of coronaviruses in inanimate environments. World J Clin Cases. 2020 Apr 26; 8(8):1391-1399. doi: 10.12998/wjcc.v8.i8.1391. PMID: 32368532; PMCID: PMC7190947.
- Comunian S, Dongo D, Milani C, Palestini P. Air Pollution and Covid-19: The Role of Particulate Matter in the Spread and Increase of Covid-19's Morbidity and Mortality. Int J Environ Res Public Health. 2020 Jun 22;17(12):4487. doi: 10.3390/ijerph17124487. PMID: 32580440; PMCID: PMC7345938.
- Khorsandi B, Farzad K, Tahriri H, Maknoon R. Association between short-term exposure to air pollution and COVID-19 hospital admission/mortality during warm seasons. Environ Monit Assess. 2021 Jun 18;193(7):426. doi: 10.1007/s10661-021-09210-y. PMID: 34142254; PMCID: PMC8211536.
- Keikhosravi G, Fadavi SF. Impact of the inversion and air pollution on the number of patients with Covid-19 in the metropolitan city of Tehran. Urban Clim. 2021 May;37:100867. doi: 10.1016/j.uclim.2021.100867. Epub 2021 May 1. PMID: 33968607; PMCID: PMC8088236.
- Jianlei L, Shengyue L, Shuiyuan C, Ying Z, Dongsheng C, Yanyun Z, Hanyu Z, Haiyan W. Chemical characteristics and sources of submicron particles in a city with heavy pollution in China, Key Laboratory of Beijing on Regional Air Pollution Control, College of Environmental & Energy Engineering. Beijing University of Technology. 2018; 9(10):388. doi: 10.3390/atmos9100388.
- Pollution from nanomaterials, Wikipedia, Part of a series of articles on the Impact of nanotechnology Health and safety, Nanotechnologies » Level 3 » Question 5 Nanotechnologies home Source document: SCENIHR (2006), Summary & Details: GreenFacts (2007) About Nanotechnologies.
- Smedley T. The toxic killers in our air too small to see. Bloomsbury. November 15, 2019.
- Craven JS. World’s Coronavirus Death Regions & Why, East-Central Europe – World’s Deadliest Coronavirus Region. WordPress.com. 2022. doi: 10.17352/2455-5479.000171.
- Mary AC, French HF. Restoring the Eastern European and Soviet Environments, In State of the World 1991, New York: Norton. Eastern European Pollution. 1991.
Content Alerts
SignUp to our
Content alerts.
 This work is licensed under a Creative Commons Attribution 4.0 International License.


