> General Science. 2021 September 03;2(9):745-767. doi: 10.37871/jbres1306.
Detection of Apoptosis Initiated in Treated HepG2 Cells with t-BHP: The Role of Phytochemicals to Reduce Toxicity and Stop Apoptosis
Maha J Hashim*
- HepG2 cells
- Apoptosis
- t-BHP
- Caspase-3
- ROS
- Lipid peroxidation
- Glutathione content
- Western blot
- Q
- EGCG
- I3C and SFN
Abstract
Apoptosis or programmed cell death is a standard physiological mechanism. It is essential to control the number of cells, balance cell division and cell death, regulate the immune system, and eliminate pathogen-infected cells. Apoptosis entailed a different investigation to determine related biochemical reactions such as activated caspase, Reactive Oxygen Species (ROS), Lipid Peroxidation (LPO), and Evaluation of Glutathione Content (GSH) by using different techniques. HepG2 cells were exposed to +/- 0.4 and 0.8 mM t-BHP for specific times to induce toxicity for apoptosis detection. We aim to investigate the mechanism of cell death in treated HepG2 with t-BHP under consideration of the conditions of the cytoprotection assay. Results showed no strong evidence for apoptosis, although caspase-3 activity increased significantly (p ≤ 0.05) in treated HpG2 cells with 0.8 mM t-BHP at 150 minutes. The weak proof for apoptosis may attribute to the participation of Calpain through the cross-talk in blocking the caspase- activation.
Similarly, we obtained significant ROS and lipid peroxidation increases in treated HepG2 cells with 0.8 mM t-BHP (p ≤ 0.05 and 0.01 respectively) at 150 minutes. Moreover, reported a (non-significant) decline in GSH amounts. Treatment of the cells with Q and I3C under the conditions used in the cytoprotection study prevented the weak activation of caspase-3 identified by western blot.
Introduction
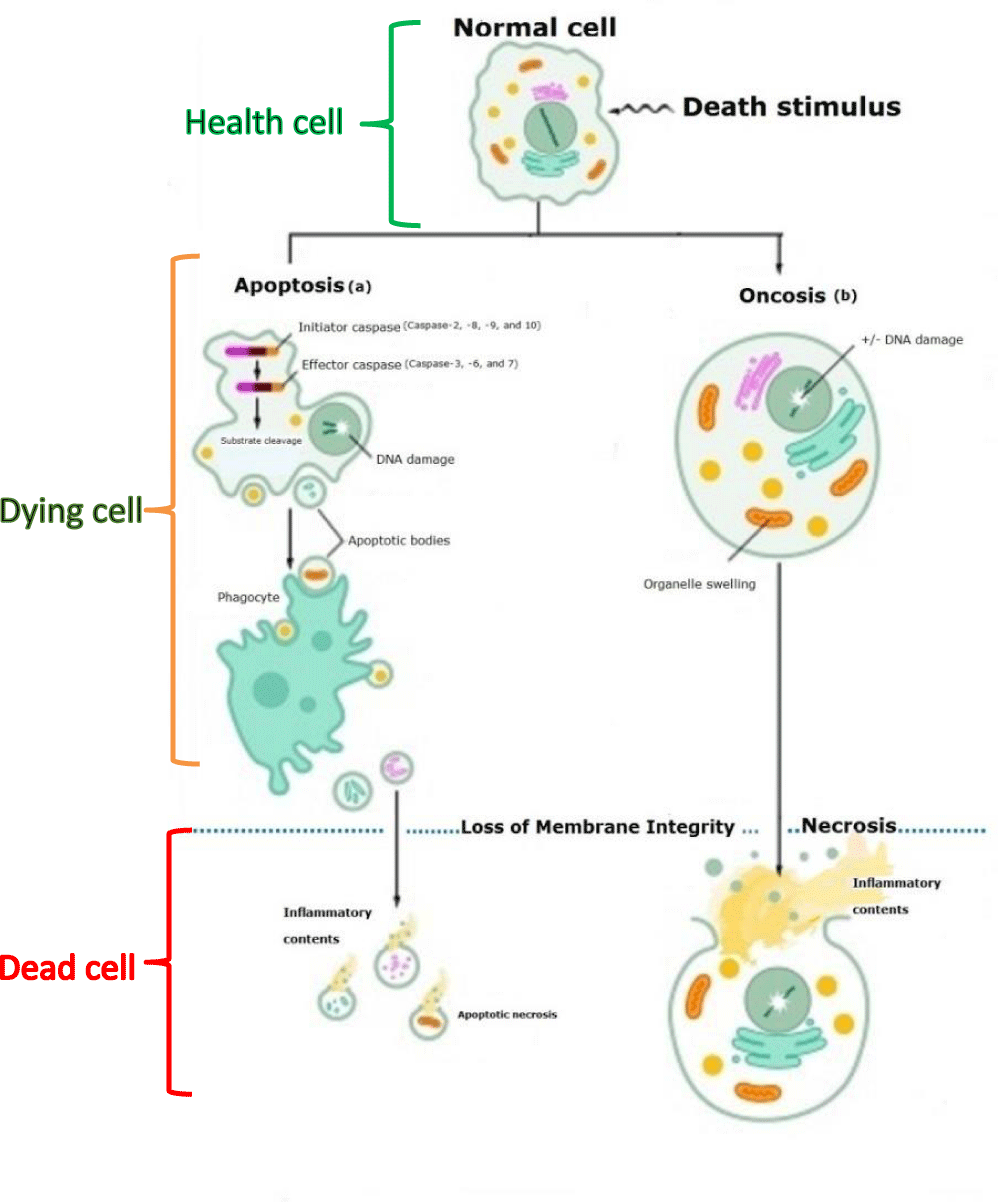
Physiological cell death in humans during health and disease proceed similarly through a natural process called apoptosis [1,2] or programmed autonomous cellular dismantling to avoid inflammation [3,4], where all dying cells are removed regularly without any trace [1,3] (Figure 1a). Moreover, because potentially deleterious cells eliminate, apoptosis can be considered one of the most potent defenses against cancers [5]. Inversely, Necrosis classifies as the second type of cell death. Still, it is passive, resulting from severe environmental damage to the cell and involving cell swelling, lysis, ATP depletion, and irregular release of intracellular contents resulting in inflammation of the tissue (Figure 1b) [3].
The core effectors of apoptosis encompass proteolytic enzymes of the caspase family that exist as latent zymogens or precursors in the cytoplasm of multicellular animals [6]. During cell death, caspases closely link to apoptosis through their two functional main groups [7] called initiator and effector caspases [6]. Activation of caspases is considered one of the significant features of apoptosis, where activation of initiator caspases leads to activation of the effector caspases, which subsequently results in cellular substrate cleavage [3]. Oxidative stress, induced by endogenous processes due to imbalance between levels of oxidant and reductant in favor of the oxidants, can generate apoptosis [8]. The induction of apoptosis associates with the depletion of the endogenous antioxidant glutathione [9], the primary modulator of oxidative stress [10], which dictates the relative resistance or susceptibility of the cell to the apoptotic or cytotoxic activities of a toxicant [10-13].
On the other hand, a significant elevation of ROS that increases hydrogen peroxide [14] links with induction of apoptosis, where evidence indicates that polyunsaturated fatty acid can kill cells by apoptosis [15,16]. More associations between apoptosis and the highest level of caspase-3 activity have been reported as well [17] HepG2 cells are widely preferred to use as a model system of the human liver for oxidant and phytochemicals compounds applications [18]. Although HepG2 cells are considered cancer cells due to their ability to differentiate and divide [19], they are the valid model for drug testing, such as the protective effects of phytochemicals against pro-oxidant effects [20]. The protective effects of the phytochemicals in HepG2 cells can be achieved by culturing cells in high density to behave as closely as possible to those in vivo regarding functionality, metabolism, and morphology [21]. For example, the pre-treatment HepG2 cells with quercetin completely prevented the toxicity effect t-BHP [22,23]. Moreover, HepG2 cells are considered a reliable model to study the mechanism of toxicity of the oxidant agents by t-BHP [24] and propose cell death pathways [25].
Apoptosis: Programmed cell death
Apoptosis is programmed cell death. It is a standard physiological mechanism used by metazoans during the development, morphogenesis, and homeostasis of organs and tissues; since it carves the body, shapes the organs, and sculpts the fingers and toes [26].
The term apoptosis is Greek and means falling off like the leaves of trees. It was first given in 1972 [27] and his colleagues to describe the unique phenotypic phenomenon of cellular shrinkage of cells, eliminating during embryonic development, atrophy upon hormone withdrawal, and average cell turnover in healthy adult tissue [27]. Moreover, another definition has been given for apoptosis relying on the events consecutively depending on the cellular metabolism that causes the specific morphology of the cell damage [14]. By the second definition, apoptosis can easily distinguish from the other types of cell death-like necrosis, autophagy, and oncosis [14,28].
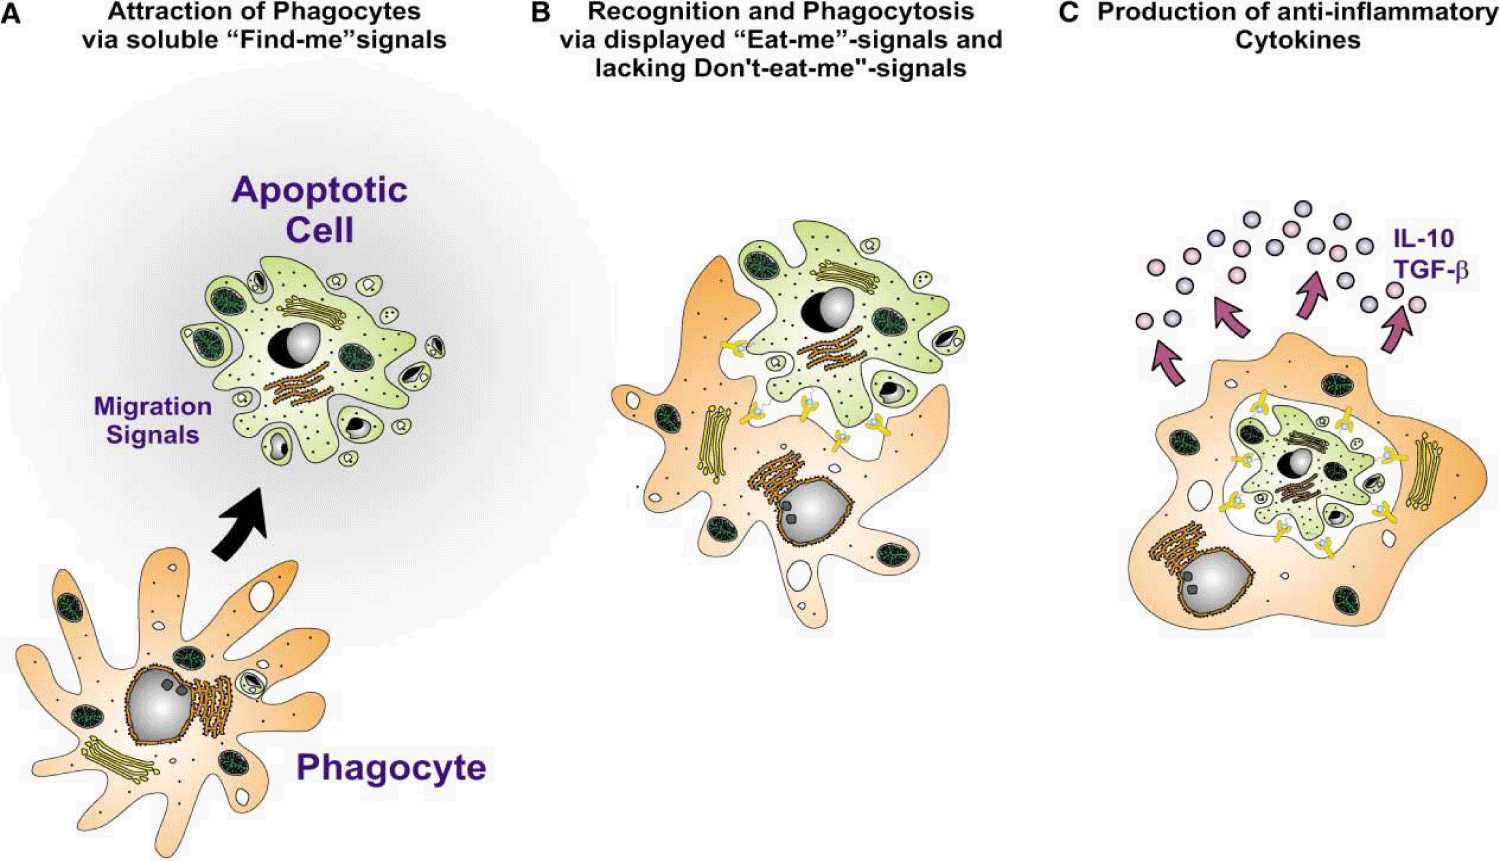
The main morphological features of apoptosis are nuclear, and cytoplasm condensation, nucleus fragmentation into mono-and oligonucleosomal units, plasma membrane blebbing, and cell shrinkage before the cell breaks into small membrane-surrounded fragments called apoptotic bodies. Phagocyte cells take up these fragmented bodies and degrade before deletion within phagosomes without inciting inflammation [27,29,30]. Necrosis, the passive and accidental cell death, can be distinct from apoptosis by the uncontrolled release of inflammatory cellular contents due to cellular and organelle swelling and membrane breakdown [3] (Figure 2).
Regulation of cell death is indispensable for the normal development and maintenance of tissue homeostasis in multicellular organisms [31]. Metazoans cells die through different stereotypical modes, including apoptosis, Necrosis, autophagy, and oncosis, but apoptosis is the most notable among all. Misregulation or failure of apoptosis may result in cancer development [32] when apoptotic cells lose responsiveness to death-inducing and become viable aberrant cells that can then switch to tumor cell characteristics [33].
Apoptosis pathways: Apoptosis is characterized by an executioner program including a family of highly conserved proteases known as caspases which occupy a critical position in signal transduction cascades associated with immune reactions. Furthermore, they are in particular responsible for dismantling cells by cleaving cellular substrates. Aberrant caspase regulation seems unequivocal to be implicated considerably in the pathogenesis of various diseases such as cancers and neurological disorders [34]. All caspases exist as inactive precursor enzymes (proenzyme) [3,35] and exist as latent zymogenes (procaspases); they are expressed as a single-chain composed of three domains: an N-terminal propeptide (or prodomain) followed by the region of two-subunit effector domain, one small and one large subunit [34,35,38]. Members of the caspases family can be classified based on their physiological roles, which are significantly different. However, all family members are similar in amino acid sequences, structure, and substrate specificity [35]. Two main groups can be distinguished: caspases related to caspase 1 (caspase-1, -4, -5, -13, and 14 as well as caspase -11, and -12) and caspases that are implicated in apoptosis (caspase-2, -3, -6, -7, -8, -9, -10) which can be further divided into initiator and effector subgroups. The initiator caspases (caspase-2, -8, -9, and -10) are responsible for activating the effector caspases cascades (caspase-3, -6, and -7), which are involved in cellular substrate cleavages [7] (Figure 3).
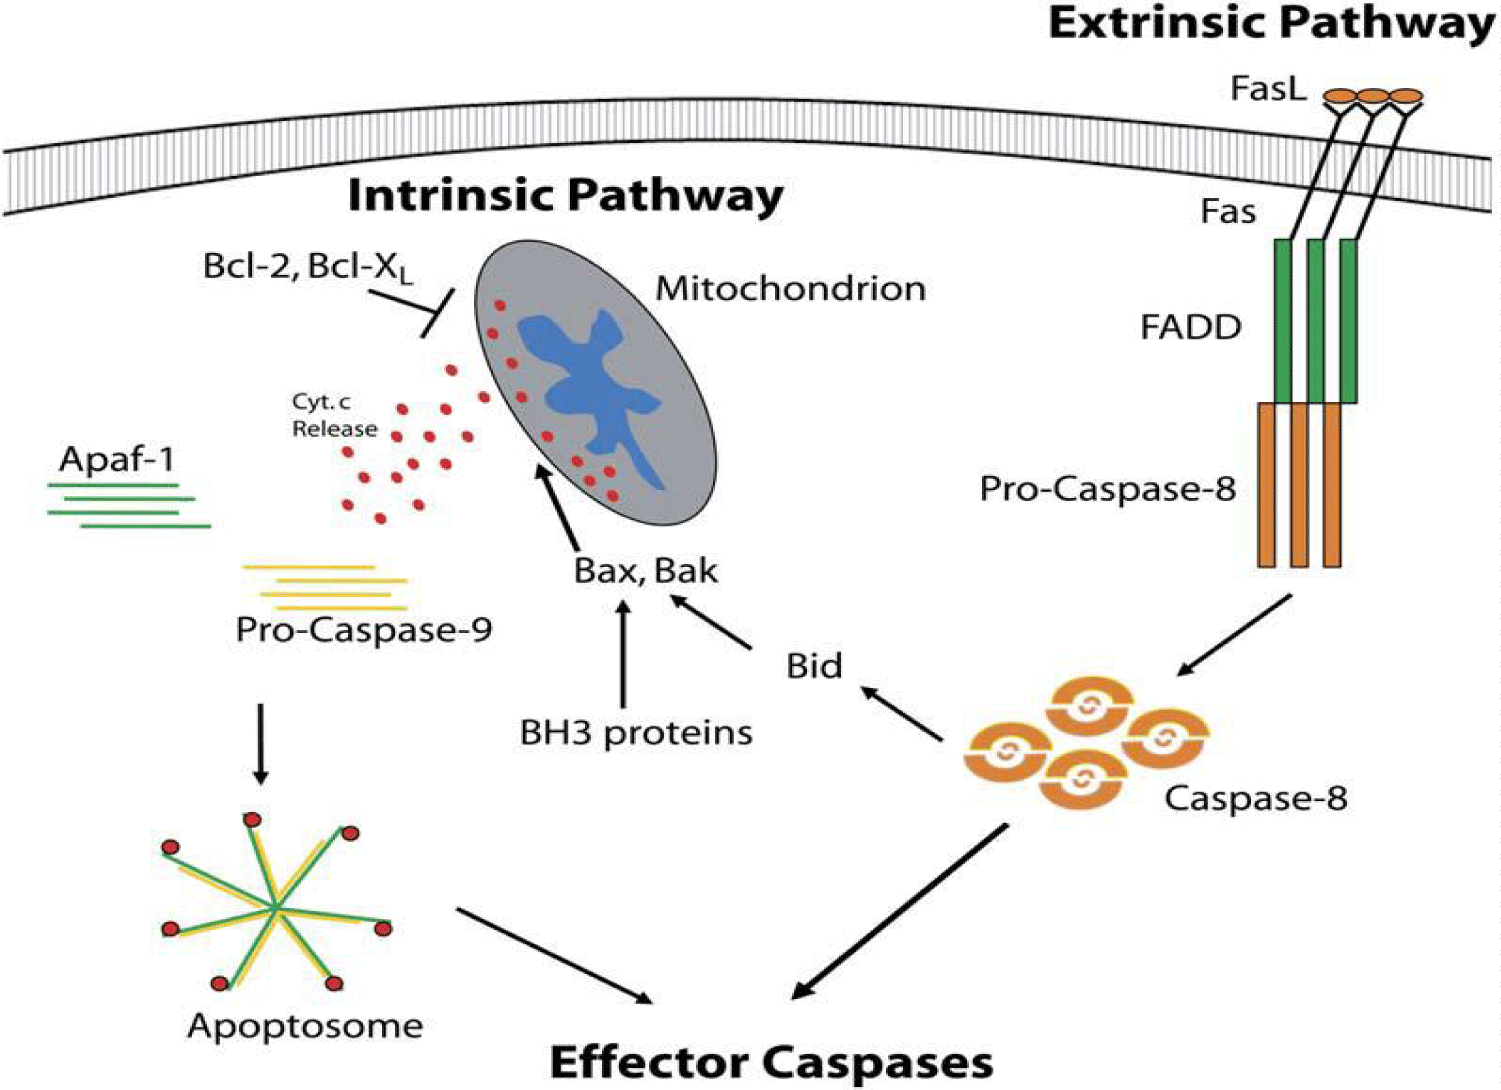
Caspases are intimately involved in both the intrinsic or extrinsic pathways of apoptosis (Figure 4) [31]. The extrinsic Pathway involves activating initiator caspases like pro-caspase-8 by extracellular binding ligands such as FasL to their cognate receptors FAS to form cytosolic adaptor protein called FADD. This FADD, in turn, activates pro-caspase-8 and subsequently activates the effector caspases for dismantling cellular substrates [38]. The activation of effector caspases is achieved during transmission of the emanating proapoptotic signals from internal stressors such as DNA damage via the intrinsic Pathway. The extrinsic and intrinsic pathways converge on mitochondria, leading to permeabilization of the outer membrane of mitochondria. Accordingly, cytochrome c subsequently releases other proapoptotic molecules into the cytosol [39,40]. Caspase-8 can cleave and activate the proapoptotic Bcl-2 family member Bid (into Bax and Bak) to promote mitochondrial cytochrome c release [41] or impede the releasing by Bcl-2 and Bcl-XL [42]. The released cytosolic cytochrome c is essential for activating caspases because it binds with Apaf-1 protein and forms a large complex called the apoptosome, which activates the initiator caspases such as caspase-9 induce apoptosis [43-45].
The physiological defects in apoptosis pathways may lead to many disorders and diseases such as AIDS, Alzheimer’s, Cancer, Parkinson’s disease, infectious diseases [46], and autoimmunity such as Addison’s disease [47]. These apoptotic defects are attributed to the deregulation in cell death processes meaning that either too much or too little cell death occurs. Such examples include self-renewing skin tissues where cell death occurs physiologically, but when normal cells fail to undergo apoptosis for some reason related to defect in apoptosis mechanisms, cell accumulation and cancers can arise [48]. To maintain the regulated apoptosis pathways which eventually prevent disease, the components of cellular regulation of apoptosis such as Bcl-2 proteins are using as integral regulators of the mitochondria apoptotic Pathway, death receptors that trigger apoptosis from the cell surface, endogenous caspases inhibitors, and caspases as the executioner enzymes as targets [49].
tert-Butyl Hydroperoxide (t-BHP)
Oxidative stress reflects an imbalance between the systemic manifestation of ROS and a biological system’s ability to detoxify the reactive intermediates readily or repair the resulting injury, both causes leading eventually to potential damage [50,51]. When ROS production is enhanced by oxidants, like those derived from nitrogen and oxygen, to such an extent to overwhelm the protection system, this may cause oxidative modification and contribute to abnormal pathological processes and biochemical functions [8,50,52). Reports refer that t-BHP participates or implicated an overproduction of intracellular ROS resulting in oxidative stress and cell injury [53] t-BHP is an organic short-chain analog of hydrogen peroxide [53,54]. It can produce free radicals through decomposition and participate in most oxidative stress situations. For example, the formation of covalent bonds with cellular molecules, peroxidation of cellular lipids, and affecting cell integrity, which leads to cell injury [54,55] rapid oxidation of reduced glutathione, and loss of cell viability [55]. The potential cellular toxicity mechanism of t-BHP can involve three pathways:
(A) Glutathione Peroxidase (GPx) rapidly metabolizes t-BHP to tert-butyl alcohol. It forms Glutathione Disulfide (GSSG), which subsequently reoxidize by Glutathione Reductase (GR), resulting in the regeneration of GSH. When GPx is available in a high amount, it may cause oxidation of pyridine nucleotides and GSH depletion. The Oxidation and depletion process is associated with the altered Ca+2 homeostasis, which considers the critical event of plasma membrane blebbing, an early sign of toxicity induced by t-BHP [55-57].
(B) The free radicals intermediate arise through the decomposition of t-BHP, which subsequently contributes to the peroxidation of membrane lipids [55,58].
(C) t-BHP free radicals may cause cell injury through the covalent bond formation with cellular molecules [55,59].
Reactive Oxygen Species (ROS)
Reactive Oxygen Species (ROS) generates continually within a cell as a result of mitochondrial electron transfer. The amounts of ROS are checked permanently by the endogenous antioxidant defense system to prevent their accumulation in the body [60]. If this balance is disturbed because of overproduction of ROS quantities or weakness of the endogenous antioxidant system defenses [61], diseases such as malignant neoplasm [62], cardiac dysfunction [63], and Alzheimer disease [64] may ensue. Moreover, the most important biological processes, in particular ATP synthesis and oxidative phosphorylation, are continually achieved by mitochondria which used 90% of the consumed O2 for this purpose. In these processes, the mitochondrial proteins probably implicate in superoxide O2.- production, leading to ROS generation (Figure 2) [65]. Therefore, mitochondria are considered the intracellular sources for normal and abnormal ROS quantities generation during average and impaired mitochondrial oxygen reduction. Besides their harmful effects, ROS are important in many physiological processes as they involve removing dead cells [61]. Now, they recognize as regulators of cell function and modulators of cell signaling pathways. They are considered part of the signaling process responsible for apoptosis induction and elimination of cancer cells [28]. Different mechanisms and pathways suggestion for ROS generation and their participation in dead cell elimination. Regarding the mitochondria pathway, the achievement of the rapid and transient ROS initiations via Fas activation and the induction of apoptosis occurs by the potent carcinogen such as cadmium Cd [66,67].
Lipid peroxidation
Lipid Peroxidations (LPO) generates in mitochondria when the free radicals attack the double bonds of carbon-carbon of unsaturated fatty acid [68,69]. During the process of lipid peroxidation, toxic by-products, known as ‘second messengers,’ are formed and cause damage to the functions of the cell [69].
Polyunsaturated Fatty Acids (PUFAs) are considered the basis on which the fluidity of phospholipids of the bilayer of biological membranes is maintained. When peroxidative attacks by free radicals on PUFAs of a biological membrane cause extensive damage and lose their essential function as a barrier, therefore, large molecules such as cytosolic enzymes can leak out considerably [70]. Moreover, LPO can cause other disorders to the membrane by cross-linking of membrane components which lead to restriction of the mobility of membrane proteins, decreasing the fluidity and electrical resistance of the membrane, as well as changing the phase properties of the membranes [68,70]. So, LPO has been implicated in decreasing enzyme activities associated with the membrane, such as cytochrome P450 and glucose-6-phosphatase. LPO also contributes to the inactivation of membrane pumps responsible for cellular ion homeostasis maintenance [69].
Endogenous antioxidant system: Glutathione (GSH)
The first line of defense against biological macromolecules that are highly active comes from the reaction between ROS, and compounds like nucleic acids, proteins, carbohydrates, and lipids are insufficient for defense. This line includes antioxidant enzymes such as SOD, GPx, catalase, and thioredoxin reductase [71]. Therefore, another sequence of enzymes such as Glutathione S-Transferase (GST), Glutathione Peroxidase (GPx), aldehyde dehydrogenase, and aldo-keto reductase protects against ROS-mediated damages.
GSH, gamma-glutamyl-cysteinyl glycine, is a cysteine-containing tripeptide [72]. It synthesizes in various organisms from glycine and y-glutamylcysteine by GSH synthetase enzyme, the active sulfur provided by methionine through the cystathionine pathway [73]. Moreover, it is present in all living cell types. It exists as oxidized forms (GSSG), known as glutathione disulfide, which are converted to the reduced form by Glutathione Reductase enzyme (GR) [74,75]. Under normal cellular redox conditions, the bulk of cellular GSH is in the endoplasmic reticulum, nucleus, and mitochondria [76]. GSH has multiple cellular functions as nucleophile and reductant and involves in many biological reactions such as redox reactions to detoxify ROS and electrophilic xenobiotics due to its thiol function [77]. Recently, changes in antioxidant enzyme activity have been regarded as a sensitive biomarker to measure the cellular response to oxidative stress [50]. This study measured Glutathione (GSH) depletion and considered it a biomarker for oxidative stress-induced in HepG2 cells by tert-Butyl Hydroperoxide (t-BHP).
Effect of antioxidants
Antioxidants are compounds known for scavenging free radicals and other oxidative species [78]. They are considered defenders to cells from ROS-mediated DNA damage, which can otherwise lead to mutation and successive carcinogenesis [28]. They recommend cancer prevention according to the inverse dissociation of high antioxidant intake with a low risk of lung cancer [78]. These protections are either direct (free radical scavenging) or indirect (up-regulation of cytoprotection proteins). Therefore and in different pathological situations, antioxidant therapy has been introduced as a new therapeutic approach to directly scavenge the free radicals through a series of reactions or remove them indirectly to minimize ROS accumulation [79]. Concerning HepG2 cells derive from hepatocellular carcinoma, they are common cancers globally [80] and represent a model system of the human liver [18]. Although HepG2 cells can differentiate and divide, they are still a valid model for applying drug testing [19], such as the protective effects of phytochemicals against pro-oxidant effects [20]. The drug testing application is accomplishing by culturing high-density cells to behave closely to those in vivo regarding functionality, metabolism, and morphology [21].
Moreover, scientists consider them a reliable model for studying the mechanism of toxicity of the oxidant agents such as t-BHP [24] and proposed cell death pathways. For example, HepG2 cells treated with t-BHP induced oxidative stress in HepG2 cells by causing apoptotic cell death with reduced glutathione content and glutathione reductase activity [25]. Moreover, the type of cell death, Necrosis, or apoptosis in response to hypoxia can elucidate in HepG2 cells where calpains are involved in hypoxia-induced cell death that is likely to be necrotic [81]. Furthermore, HepG2 cells can metabolize chemical compounds like in vivo other than cell lines which do not express chemicals metabolism capability [18,82,83]. Therefore, using the HepG2 cells culture system to study the effect of the providing actions by antioxidants or oxidants to reflect the exposure conditions in vivo exposed chemicals in the blood following the first-pass metabolism in the liver. In our study, we cultured HepG2 cells in high density to be confluent and non-dividing to allow the identification of antioxidant behavior and establish the possible mechanism of toxicity of t-BHP.
Materials and Methods
HepG2 cells culture
HepG2 cells were cultured in 175 cm2 Nunclon culture flasks in 5% CO2-in-air atmosphere using 50 ml of minimum Essential Eagles MEM medium supplemented with 10% (v/v) fetal calf serum, 2 μg/ml fungizone, 0.05 mg/ml gentamicin, 1% (v/v) non-essential amino acid solution, 2 mM L-glutamine at 37°C. The culture medium was changed every 72 hours, and cells were confluent after 7 days of sub-culturing. For experiments including treatments, cells were sub-cultured at high density in wells of a 24-well plate in 1 ml medium; under these conditions, the confluence was achieved within 24 hours.
Treatment of cells
Toxicity effects of tert-Butyl Hydroperoxide (t-BHP) on HepG2 cells by phytochemicals in serum-free medium: HepG2 cells were cultured and seeding as shown in sections 2.1 and then treated with different phytochemicals (Q, EGCG, I3C, and SFN) for 20 hours before incubation with different concentrations (0.05, 0.1, 0.2, 0.4, and 0.8 mM) of t-BHP for 5 hours in serum-free medium.
In related experiments, we studied the toxicity effect of t-BHP on the viability of HepG2 cells to determine whether t-BHP can induce apoptosis in these cells or not. HepG2 cells were distributed into a 24-well plate and exposed to t-BHP (0.4 or 0.8 mM) for 5 hours in serum-free medium and medium containing 2% serum.
Apoptosis: Programmed cell death detection
Preparation of Cell lysate samples: After exposure of the cells to the various test incubations, the plate was placed on ice, medium removed, and 150 μl of lysis buffer pH 7.6 (was prepared from dissolving 12.1 g of Tris (20 mM), 1.9 g of EGTA (1 mM), 500 μl of Triton X-100 (0.1%), 0.021g of NaF (1mM), 1.08g of b-glycerophosphate (10 mM) in 500 ml distilled water) was added. The pellet was re-suspended and homogenized using a pestle to ensure that all protein was released from the cell. The lysate (20 μl) was placed into one Eppendorf tube to estimate protein by Lowry assay, while another 100 μl was placed into another tube for western gel.
Determination of protein level: The total level of protein was determined by using the Lowry method [84]. A 1mg/ml of Bovine Serum Albumin (BSA) stock solution was prepared in water. A series of dilutions were made to produce a standard curve (see table below). Lowry solution AB was prepared by mixing 20 ml of Lowry solution A (a solution prepared by dissolving 2 gm of sodium hydroxide NaOH, 1 gm of sodium dodecyl sulfate SDS, and 10 gm of sodium carbonate Na2CO3 in 500 ml of distilled water) with a solution B (100 µl of 2% of sodium-potassium tartrate and 100 µl of 1% of Copper Sulfate CuSO4), and then 1 ml of Lowry solution was added to all samples and BSA standards. All examples and BSA standard solutions were incubated for 10 minutes at room temperature, and then 100 µl of Folin reagent dilution 1:1 (1 ml of Folin reagent added to 1 ml of distilled water) was added to all samples and standards solutions. Solutions were transferred after mixing on the vortex to a 96-well plate and incubated at room temperature for at least 45 min, and no more than 3 hours. The resulting absorbance was determined on spectra MAX 340pc plate reader at 750 nm.
| Tube number | D.H2O (µl) |
BSA (µl) |
Protein concentration (mg/ml) |
| 0 | 200 | 0 | 0 |
| 1 | 190 | 10 | 0.05 |
| 2 | 180 | 20 | 0.10 |
| 3 | 170 | 30 | 0.15 |
| 4 | 160 | 40 | 0.20 |
| 5 | 150 | 50 | 0.25 |
| 6 | 140 | 60 | 0.30 |
| 7 | 130 | 70 | 0.35 |
| 8 | 120 | 80 | 0.40 |
| 9 | 110 | 90 | 0.45 |
Detection of caspase activation
(a) By western blotting: The effect of t-BHP on treated HepG2 cells with I3C and Q was studied using western blotting and viability test.
HepG2 cells were incubated with I3C (25 μg/ml) using medium 10% serum for 20 hours prior exposure to 0.4 and 0.8 mM of t-BHP for different periods (0, 15, 30, 60, 90, 120, 150 minutes) for viability test while cells were exposed for 60 and 120 minutes for western blot using medium containing 2% serum. In addition, HepG2 cells were incubated with Q (100 μg/ml) and 0.4 and 0.8 mM of t-BHP simultaneously for different periods of time (0, 15, 30, 60, 90, 120, 150 minutes) in medium containing 2% serum. For western blot, HepG2 cells were incubated with Q (100 μg/ml) and 0.4 and 0.8 mM of t-BHP simultaneously for 60 and 120 minutes using a medium containing 2% serum.
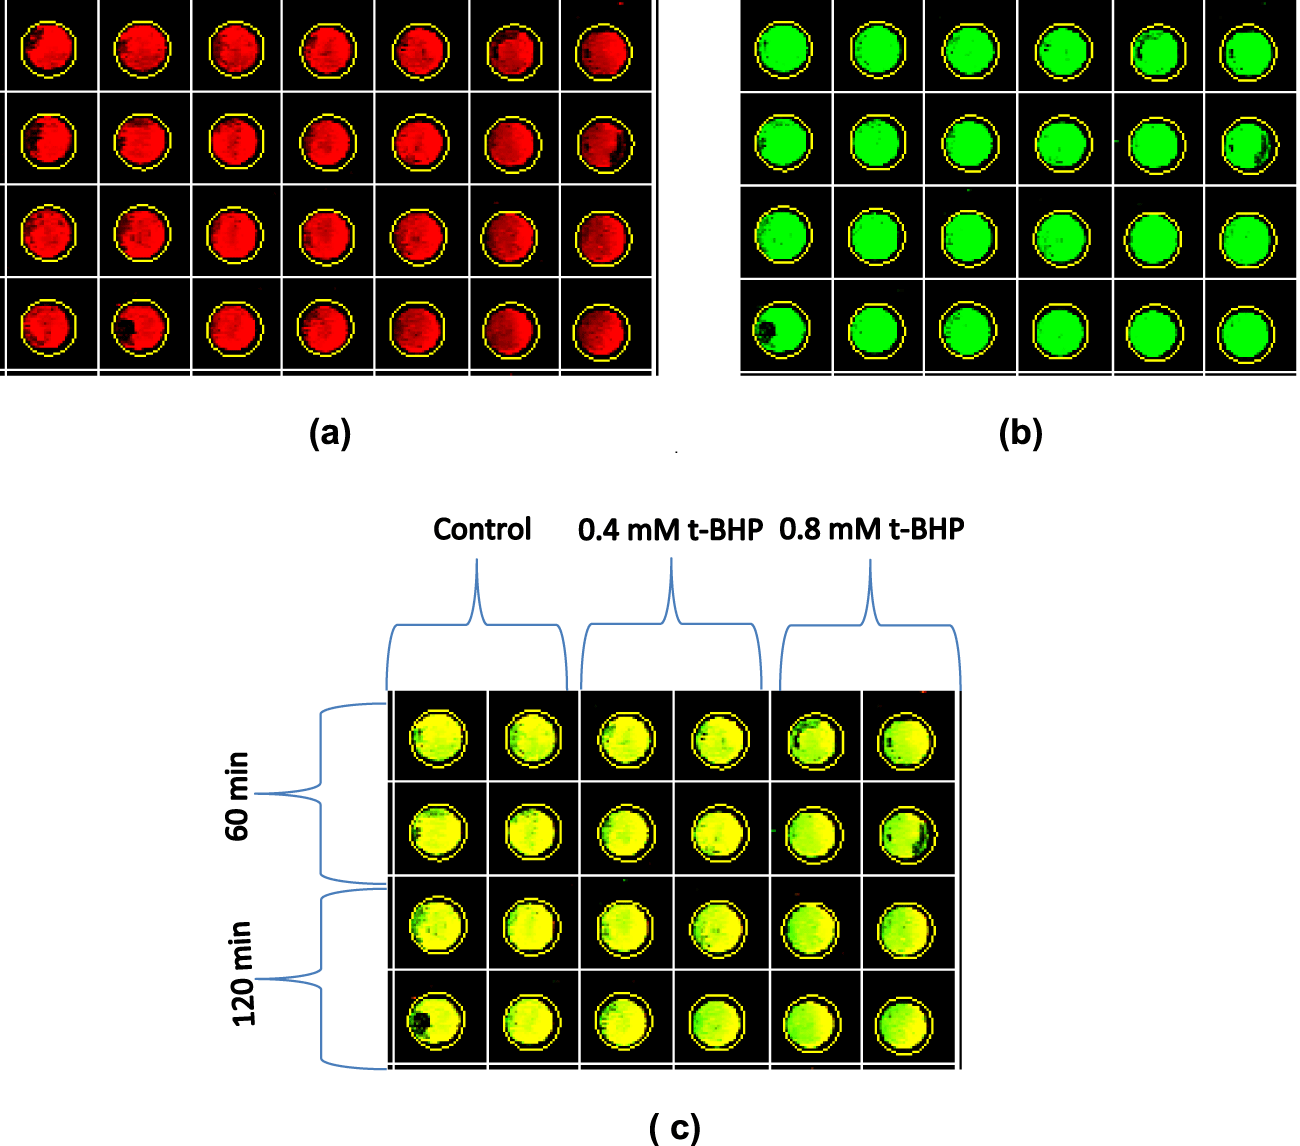
(b) In-cell western for determination of caspase-3 activity: Following exposure of HepG2 cells to t-BHP for up to 120 minutes, the cells were washed with PBS, and then fixed by adding 150 μl of (4% w/v) paraformaldehyde (20 g paraformaldehyde solid dissolved in 500 ml PBS containing 7 drops 10 M NaOH) to each well and incubating for 30 minutes at room temperature. Fixative was aspirated. Cells were re-washed with PBS before 150 μl of (0.1% v/v) Triton solution (0.1 ml Triton X-100 dissolved in 100ml PBS solution) was added to each well, and then incubated for 15 minutes at room temperature then aspirate. Cells were re-washed with PBS, and then 150 μl of (5% w/v) milk, the blocking agent (5 g milk powder dissolved in 100 ml PBS), was added to each well then left on a plate shaker for an hour at room temperature, and then aspirate. Following this, 50 μl of primary antibodies, (2:1000) caspase-3 (2 μl of caspase-3 antibody diluted in 1 ml of 5% milk) and (0.25:1000) GAPDH (0.25 μl of GAPDH antibody diluted in 1 ml of 5% of milk), were added to each test well. The plate was incubated overnight on a plate shaker in a cold room (4-6°C). The next day, primary antibodies solution was aspirated before each well was washed three times with PBS every 5 minutes and then aspirated. Following aspiration of the plate, 100 μl of secondary antibodies solution (8 μl of goat anti-rabbit IR800 and 6 μl of goat anti-mouse IR680 were diluted in 30 ml of 5% of milk) was added to each well and incubated on a closed plate shaker for 60 minutes at 37ºC. The secondary antibody was light-sensitive, so the assay plate was carried out quickly, and the assay plate was covered during incubation. When incubation was finished, solutions were aspirated, and each test well was washed three times with PBS, aspirating after each wash. After aspirating the third wash, the assay plate was scanned by an Odyssey infrared fluorescent imaging system (LI-COR) and analyzed using Odyssey V3 software.
(c) Immunocytochemistry: HepG2 cells were cultured on coverslips present in a 24-well plate for 24 hours; the next day, cells were treated with 0.4 and 08 mM t-BHP using medium 2% serum for 0, 60, and 120 minutes. After treatment, HepG2 cells were fixed by paraformaldehyde (4%) in Phosphate-Buffered Saline (PBS) for 30 min at room temperature. After then cells were washed by PBS and permeabilized using 0.1% Triton-X100 in PBS for 30 minutes. Non-specific binding sites were blocked by incubating cells with PBS containing 1% Bovine Serum Albumin (BSA) for 60 minutes at room temperature. Following this, 50 μl of primary antibodies (1:200) caspase-3 (from Cell Signaling Technology) (2 μl of caspase-3 antibody was diluted in 200 ml of 5% milk) were added to each well and incubated overnight at 4°C. The next day, the primary antibody was aspirated, and the wells were washed with PBS. After PBS washing, FITC-conjugated goat anti-rabbit IgG (1:800) (from Jackson Immuno Research) was added, and the plate was incubated for 1 hour at 37°C. Cell nuclei were stained with 4, 6-diamidino-2-phenylindole (DAPI, Molecular Probes) dye (1 μl:1000 μl PBS) for 5 minutes at room temperature to visualize all cells on coverslips. After extensive washing with PBS, coverslips were mounted with a mounting medium without DAPI (Vectashield) and viewed through a 63 x glycerine immersion lens objective with a Leica DMRA2 fluorescent microscope. Images were cropped, and brightness and contrast were adjusted equally using the ImageJ Software. Negative controls without primary antibodies were included to ensure minimal non-specific staining.
Determination of caspase activity
Activation of specific proteases called caspases is considered to be one of the initial biochemical events of apoptosis [85]. A Homogenous Caspases Assay kit from Roche was used for the determination of caspase-3 activity. After treatment, the medium was aspirated. 175 μl of the working substrate was added; the working substrate was immediately prepared by mixing 200 μl of 500 μM of DEVD-R110 stock solution in DMSO with 2.8 ml of incubation buffer (already prepared in bottle). While 87.5 μl of the working substrate was added to 87.5 μl of working positive control, which was prepared by mixing 10 μl of positive stock control (lysate from apoptotic U937 cells treated with camptothecin) with 90 μl of incubation buffer. For the standard curve, 87.5 μl of the working substrate was added to 87.5 μl of series of dilution 5, 2, 1, 0.5, 0.25, and 0.125 μM that was prepared from 10 μM of working standard solution; it was prepared by mixing 10 μl of 1 mM of stock R110 standard with 990 μl of media. For blank, 175 μl of medium containing 2% serum was added. After substrate addition, the plate was covered with a lid and incubated for not less than an hour at 37ºC. A fluorescent plate reader was used to measure caspase-3 activity at 470-500 nm excitation and emission of 499 nm.
Determination of intracellular ROS production
The intracellular ROS level was measured using the oxidation-sensitive fluorescent dye 2′, 7′-dichlorodihydrofluorescein diacetate DCFH-DA [86]. This dye is a stable nonpolar compound and cell-permeable indicator of ROS because it can get readily into the cell as a non-fluorescent compound DCFH which ROS oxidizes to the highly fluorescent DCF [66,67] DCFH-DA was dissolved in DMSO to a final concentration of 5 mM and then diluted to 10 μM in complete PBS containing Ca+2 and Mg+2 before use. For ROS measurement, HepG2 cells were washed with full PBS after pre-incubation with the probe DCFH-DA for 30 minutes. The washed cells, including DCFH-DA as DCFH, were then treated with t-BHP for different periods. Following the treatment, ROS was measured immediately in fluorescence spectrophotometry using 485 nm and 520 nm wavelengths for excitation and emission, respectively. The amount of ROS that are produced by the cells is proportional to the intensity of fluorescence generated [66].
Determination of cellular Glutathione (GSH) content
GSH in its reduced form (gamma-glutamyl cysteinyl glycine) is a major intracellular antioxidant in most eukaryotic and prokaryotic cells. It is considered an essential monitor for human diseases related to detoxification processes and oxidative stress [87]. GSH was determined by the method of [88]. Following treatment, cells were washed with PBS, and then 1 ml of 10% Trichloroacetic Acid (TCA) (10 g of TCA was dissolved in 100 ml distilled water) was added to each well. The plate was covered and placed on a shaker for 30 minutes to mix and extract glutathione into TCA. The supernatant was collected in plastic tubes. Into 96 well-plates, 50 μl of cell/TCA supernatant, glutathione standard, and TCA blank was distributed before adding 200 μl of K2HPO4/OPT mixture; this mixture was prepared before use shortly by adding 2.5 ml of O-Phthalaldehyde (OPT) (10 mg of OPT dissolved in 10 ml of methanol and stored in the dark in the fridge, this reagent was prepared weekly ) to 7.5 ml of 0.4 M of K2HPO4 buffer (pH 8.2) (35 g of K2HPO4 dissolved in 500 ml distilled water). The plate was left for 15 minutes to stand, and then the fluorescence was read on a fluorescent plate reader by using 360 nm and 460 nm wavelengths for excitation and emission, respectively. The concentration of glutathione in samples was determined by reference to the standard solutions of GSH. For glutathione standard curve, a series dilution of 100 μM, 50 μM, 25 μM, 12.5 μM, and 6.25 μM were freshly prepared from 1 mM of glutathione (3.07 mg of the reduced form of glutathione was dissolved in 10 ml of 10% TCA) by using TCA. TCA was used as blank.
Determination of Lipid Peroxidation (LPO)
After treatment, cells were collected in plastic tubes by adding 150 μl of 20% TCA (20 g of TCA dissolved in 100 ml distilled water) to each well and mixing. The tubes were left to stand for 10 minutes and then centrifuged, the precipitate being discarded. To 100 μl of supernatant (or standard), 100 μl of 0.67% TBA (2-thiobarbituric acid) (0.67 g of TBA was dissolved in 100 ml distilled water) were added, and then tubes were heated at 95ºC for 20 minutes. The tubes were placed on ice to cool for 10 minutes; the pink color appeared gradually. Finally, 1.5 ml of butanol was added to each tube and mixed before being left to stand for 5 minutes. The fluorescence of the butanol layer was read on a fluorescent plate reader using 530 nm and 590 nm wavelengths for excitation and emission, respectively. For standard curve, from 100 mM of 1,1,3,3-Tetramethoxypropane (178.7 μl was added to 10 ml of 20% TCA) a series dilution of 10, 5, 2.5, 0.625, 0.1, 0.05, 0.025, and 0.0125 mM was prepared.
Results
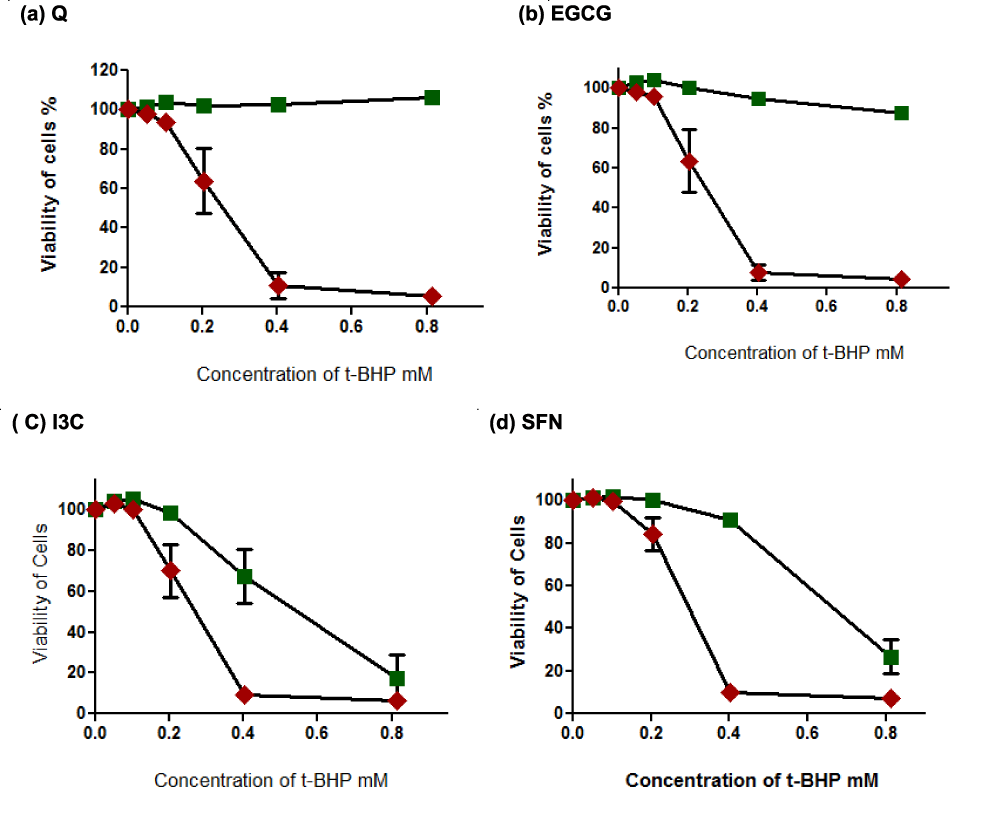
Toxicity effects of tert-Butyl Hydroperoxide (t-BHP) on treated HepG2 cells by phytochemicals in serum-free medium (Table 1).
| Table 1: TC50 values for untreated and treated HepG2 cells with four chemicals Q, EGCG, I3C, and SFN for 20 hours prior exposure to different concentrations of t-BHP (0, 0.05, 0.1, 0.2, 0.4, and 0.8 mM) for 5 hours using serum-free medium. Values are Mean ± SEM of 3 independent experiments. | ||
| Phytochemical µg/ml |
Absence of Phytochemical | Presence of phytochemical |
| Q | 0.29 ± 0.05 | ≥ 0.8 |
| EGCG | 0.27 ± 0.07 | ≥ 0.8 |
| I3C | 0.21 ± 0.08 | 0.54 ± 0.098 |
| SFN | 0.17 ± 0.07 | 0.62 ± 0.063 |
Time dependence of t-BHP toxicity on HepG2 cells
Although 0.4 and 0.8 mM t-BHP elicited a similar level of toxicity (See figure 5), it was apparent that I3C and SFN provided good cytoprotection only at the 0.4 mM concentration of t-BHP. Accordingly, 0.4 and 0.8 concentrations of t-BHP were employed in further studies into the possible mechanism (s) underlying the toxicity of t-BHP to HepG2 cells and protection gained by the phytochemicals.
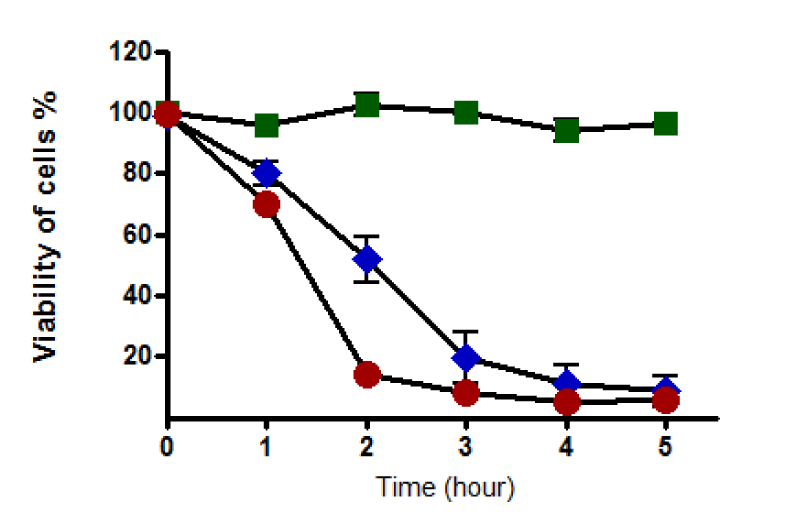
(a) In the presence of 2% serum-containing medium: When serum concentration in the culture medium was set at 2%, results showed that HepG2 cells retained their viability during an incubation time of 5 hours in the absence of t-BHP. On the other hand, the viability of cells was affected by 0.4 mM of t-BHP when they were incubated for similar periods. Notably, with this concentration of t-BHP, cell viability dropped gradually from 100% at zero time to reach about 10% after 5 hours of incubation. It seems that about 20% of cells died after one hour of incubation. Similarly, HepG2 cells recorded a decline in their viability when 0.8 mM of t-BHP was used. Cell death was notable with a higher concentration of t-BHP, and about 90 % of cells were dead after two hours (cell viability reached nearly 10% after two hours of incubation (Figure 6).
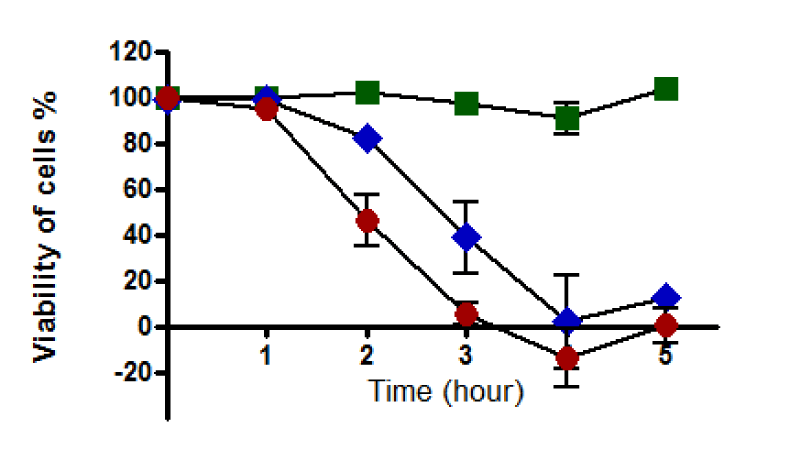
b) In the presence of serum-free medium: Results displayed that HepG2 cells were still alive during incubation with serum-free medium for different periods (0-5 hours). The omission of serum from the culture medium for this did not affect the viability of cells. The number of dead cells started to increase when cells were incubated with 0.4 mM t-BHP after one hour, and total cell death occurred after four hours of incubation where non-viable cells were 100%. Similarly, extreme cell death was notable with 0.8 mM t-BHP during the incubation time course. More than 50% of cells were dead after two hours of incubation, and all cells were dead after three hours when cell viability was recorded to be 0% (Figure 7).
Detection of caspase-3 activation
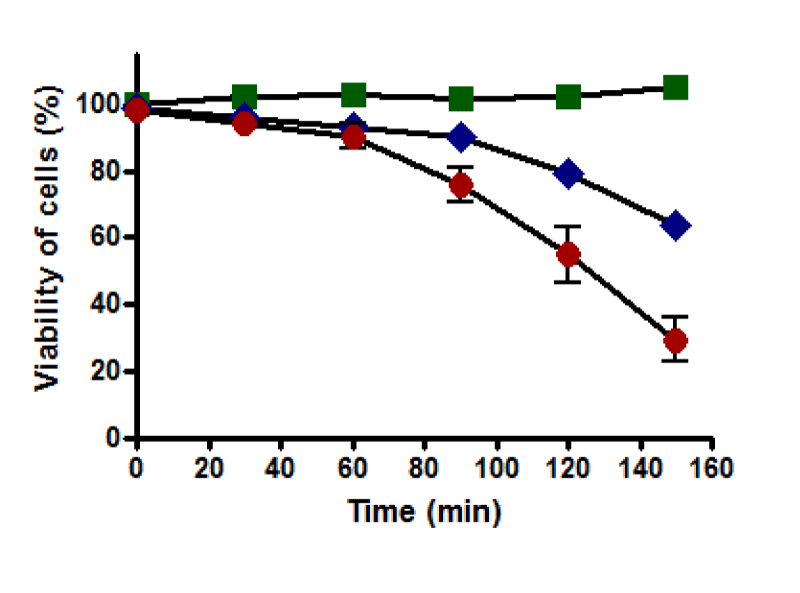
(a) With western blotting: The viability of untreated HepG2 cells was unaffected, and cells retained 100% viability during incubation up to 150 minutes. A notable decline in the viability of HepG2 cells was recorded after 60 minutes of incubation with 0.4 and 0.8 mM. Cell death was increased as the incubation time increased to reach the maximum at 150 minutes of incubation, where the viability of treated HepG2 cells with 0.4 mM was dropped to about 60% while it dropped to about 25% with 0.8 mM (Figure 8). Therefore, HepG2 cells were incubated with t-BHP using 0.4 and 0.8 mM for a specific incubation time (60, 90, and 120 minutes) in a 2% serum medium to detect caspase-3 activation under these conditions.
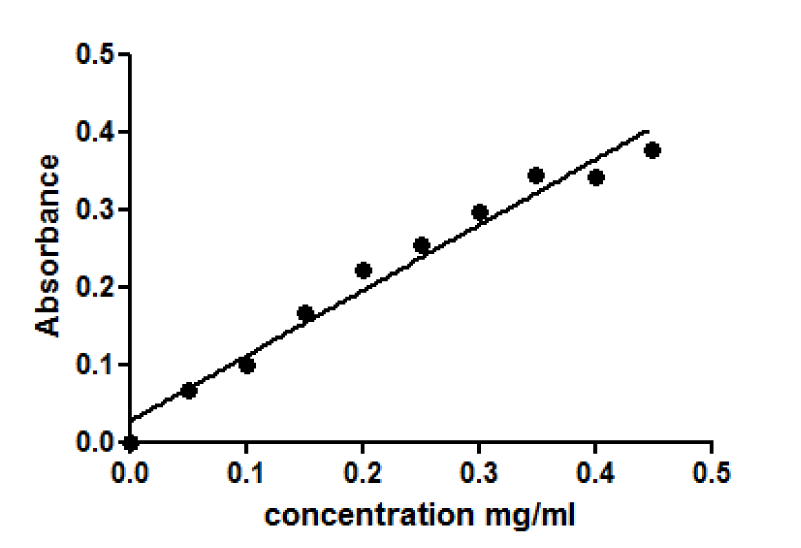
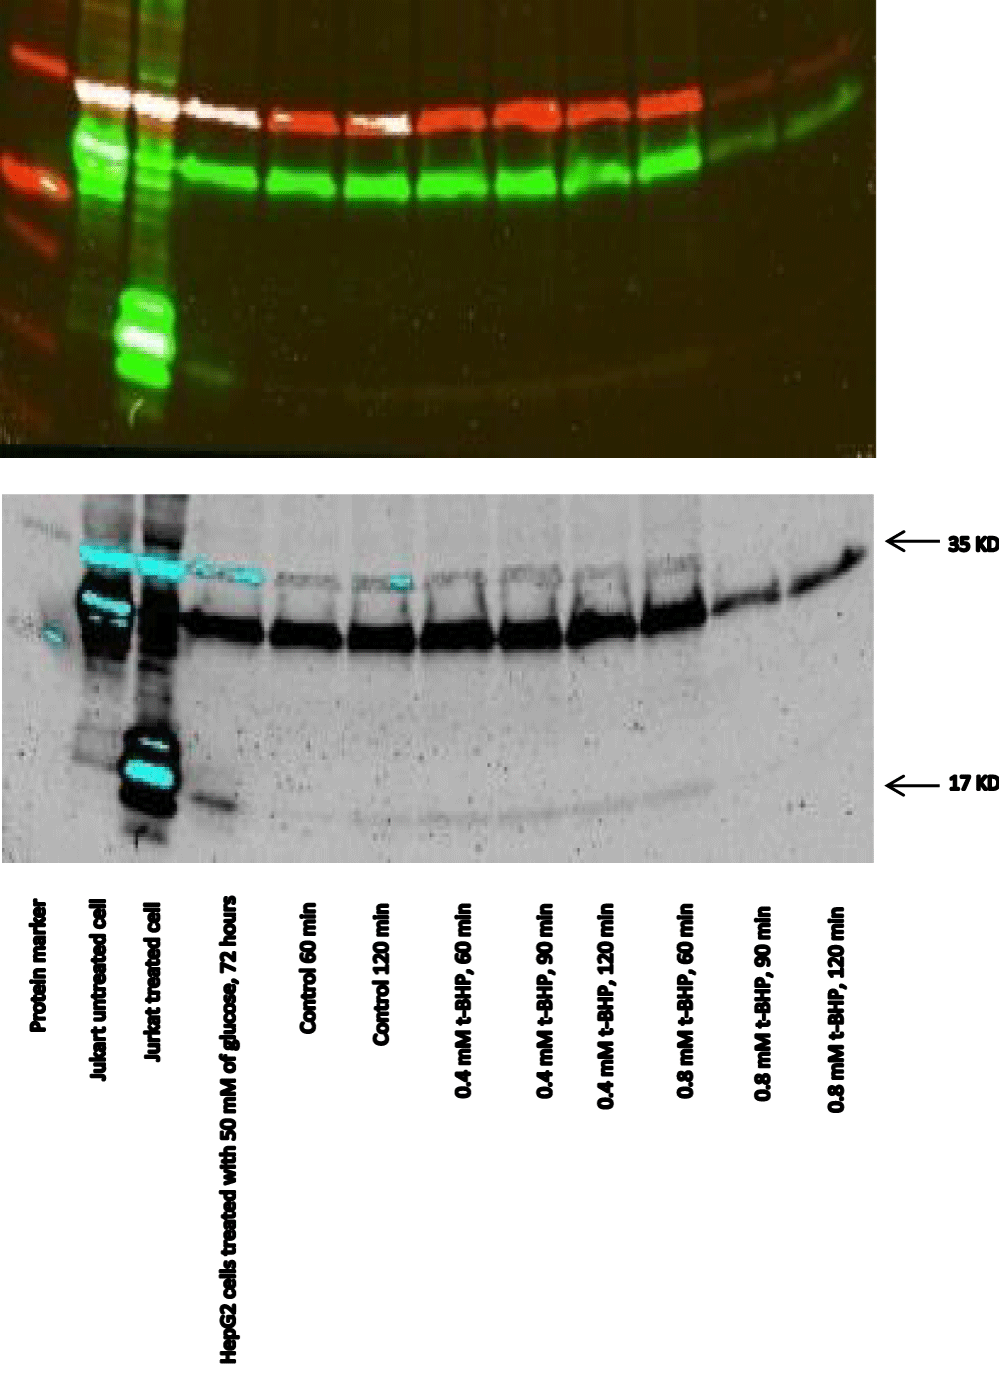
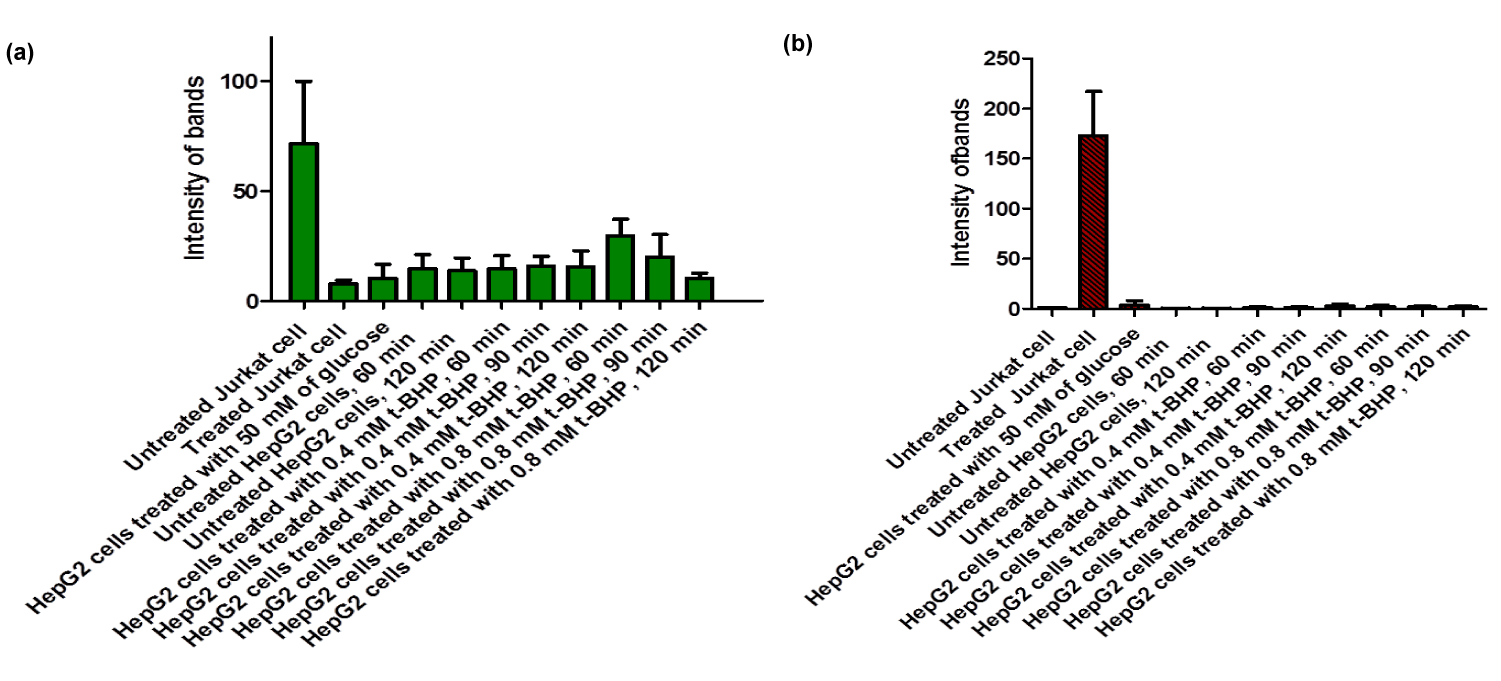
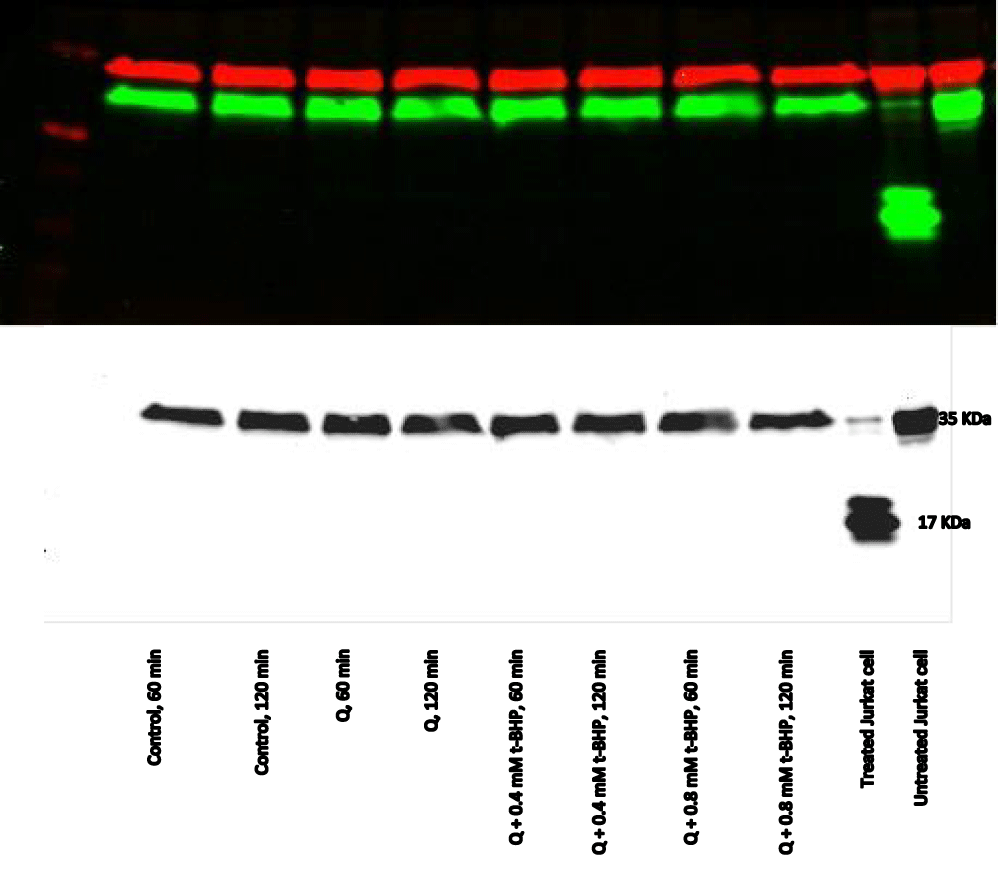
Equivalent amounts of protein from all HepG2 cell studies were loaded onto the electrophoresis gel after determination of protein content by Lowry assay by interpretation from a standard linear curve (Figure 9). The positive control of Jurkat cells and the positive control of HepG2 cells treated with 50 mM of glucose for 72 hours were showed strong bands of procaspase-3 and active caspase-3 at 35 and 17 KDa, respectively. Moreover, the procaspase-3 band of negative control of Jurkat cells at 35 KDa was also marked, while no activation for caspase-3 could be seen at 17 KDa (Figure 10). This evidence shows that caspase cleavage can be detected in HepG2 cells undergoing apoptosis. Procaspase-3 for untreated and treated HepG2 cells with t-BHP at 60, 90, and 120 min has been shown with strong bands at 35 KDa except samples treated with 0.8 mM of t-BHP at 90 and 120 minutes where bands were lighter than others. On the other hand, no strong evidence for caspase activation could be reported where all samples displayed faint bands of active caspase-3 at 17 kDa. Still, the fewer light bands from all of them were the untreated HepG2 cells at 60 and the treated cells with 0.8 mM of t-BHP at 90 and 120 minutes (Figures 10,11a,b).
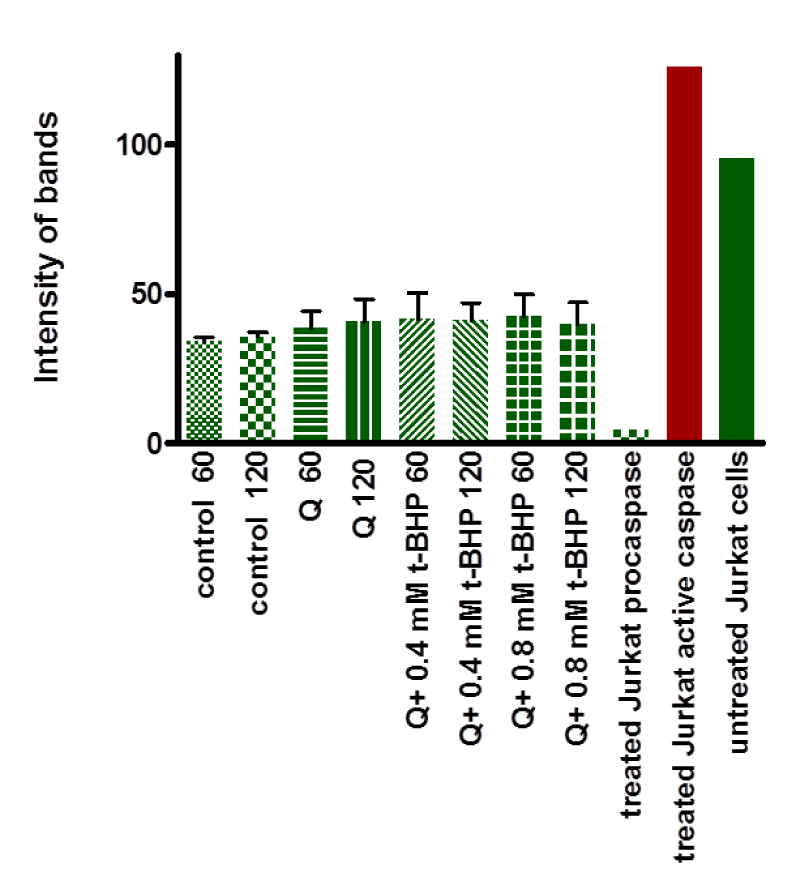
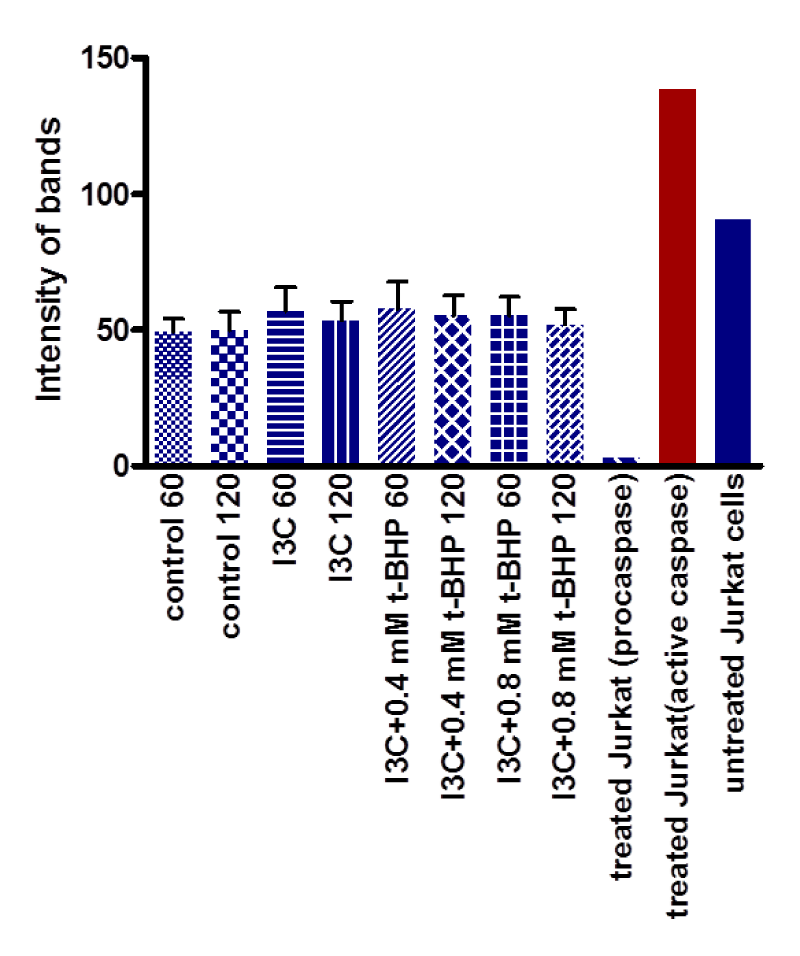
(b) In-cell western: Results showed no noticeable variation between untreated and treated HepG2 with 0.4 and 0.8 mM t-BHP for 60 and 120 minutes (Figure 12). For 60 minutes incubation, no differences between incubated cells with 0.4 and 0.8 mM t-BHP and control. Similarly, for 120 minutes of incubation, no variations between untreated HepG2 cells treated with 0.4 and 0.8 mM. Results showed that there was no evidence for activation of caspase-3 (Figure 13a,b)
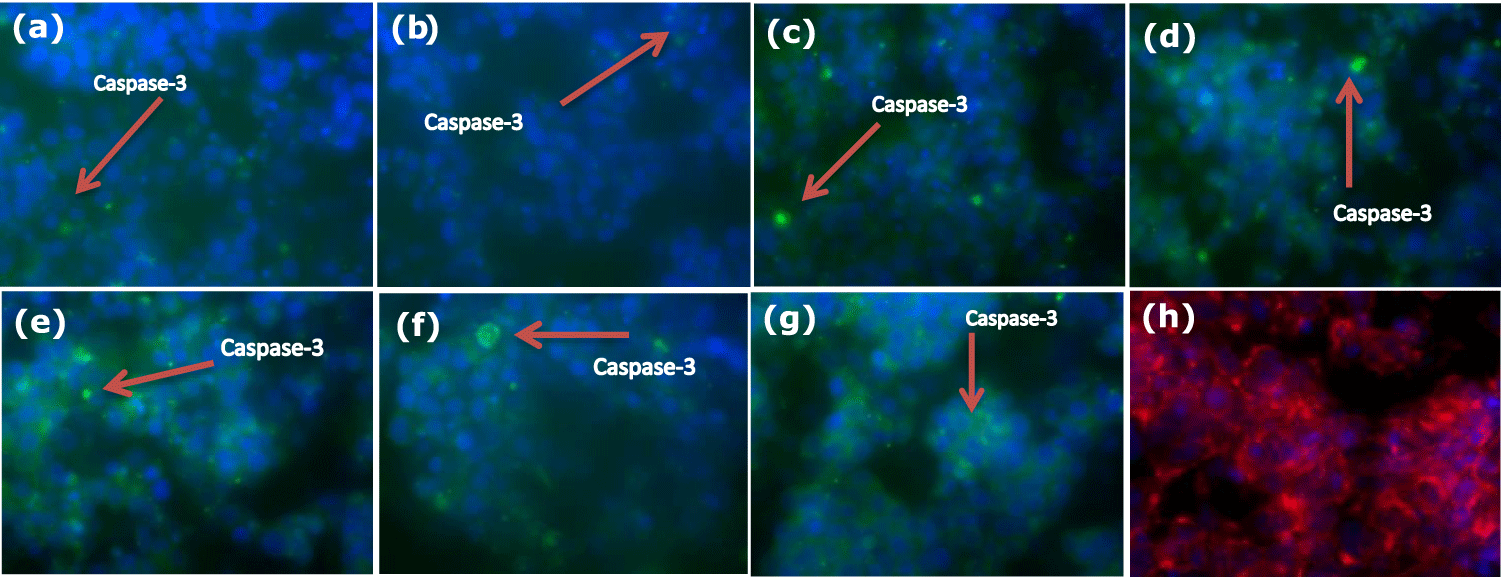
(c) Immunocytochemistry: Although the number of dead cells increased with the increase of incubation time of HepG2 cells with 0.4 and 0.8 mM of t-BHP using medium 2% serum (Figure 6), the immunocytochemistry results showed that incubation of HepG2 cells in the absence or presence of 0.4 and 0.8 mM t-BHP at zero, 60, and 120 minutes had a small effect on the activation of caspase-3 where a little variation can be seen during incubation with 0.4 and 0.8 mM t-BHP at 60 and 120 minutes (Figure 14).
Caspase activity
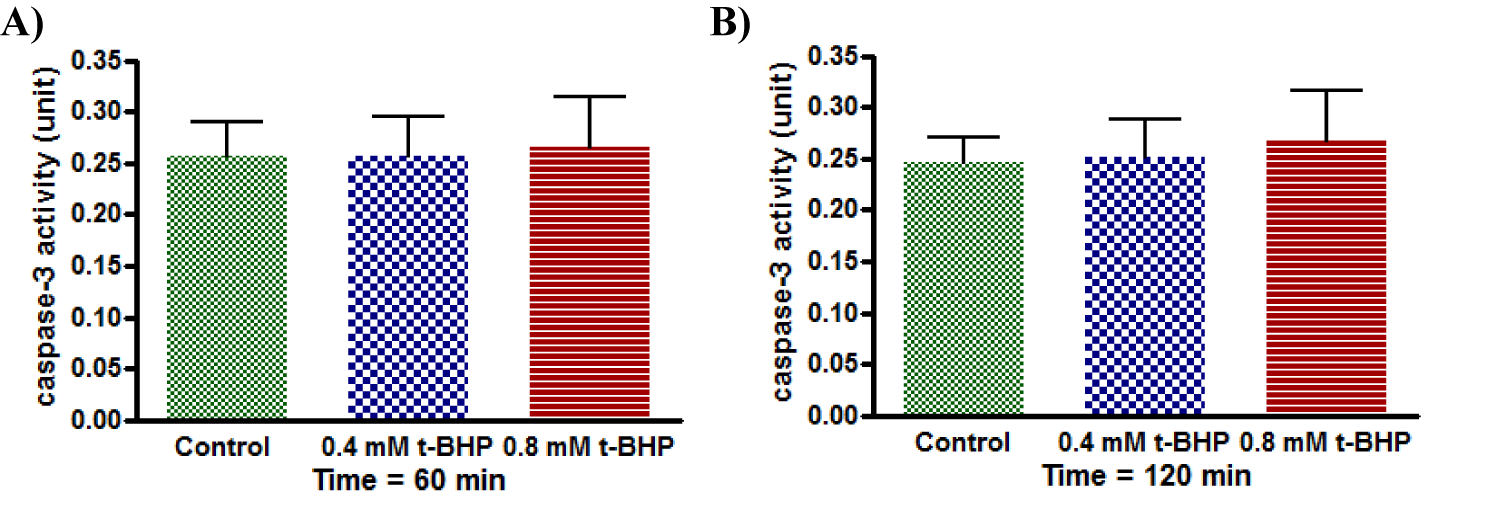
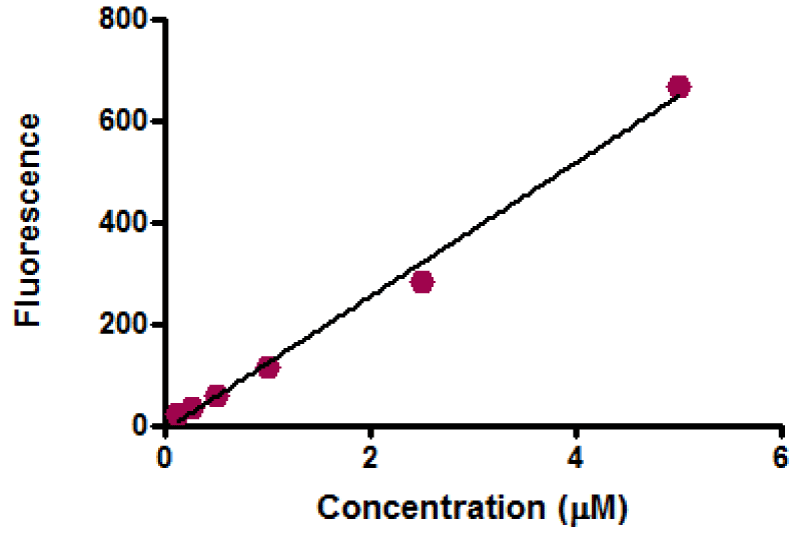
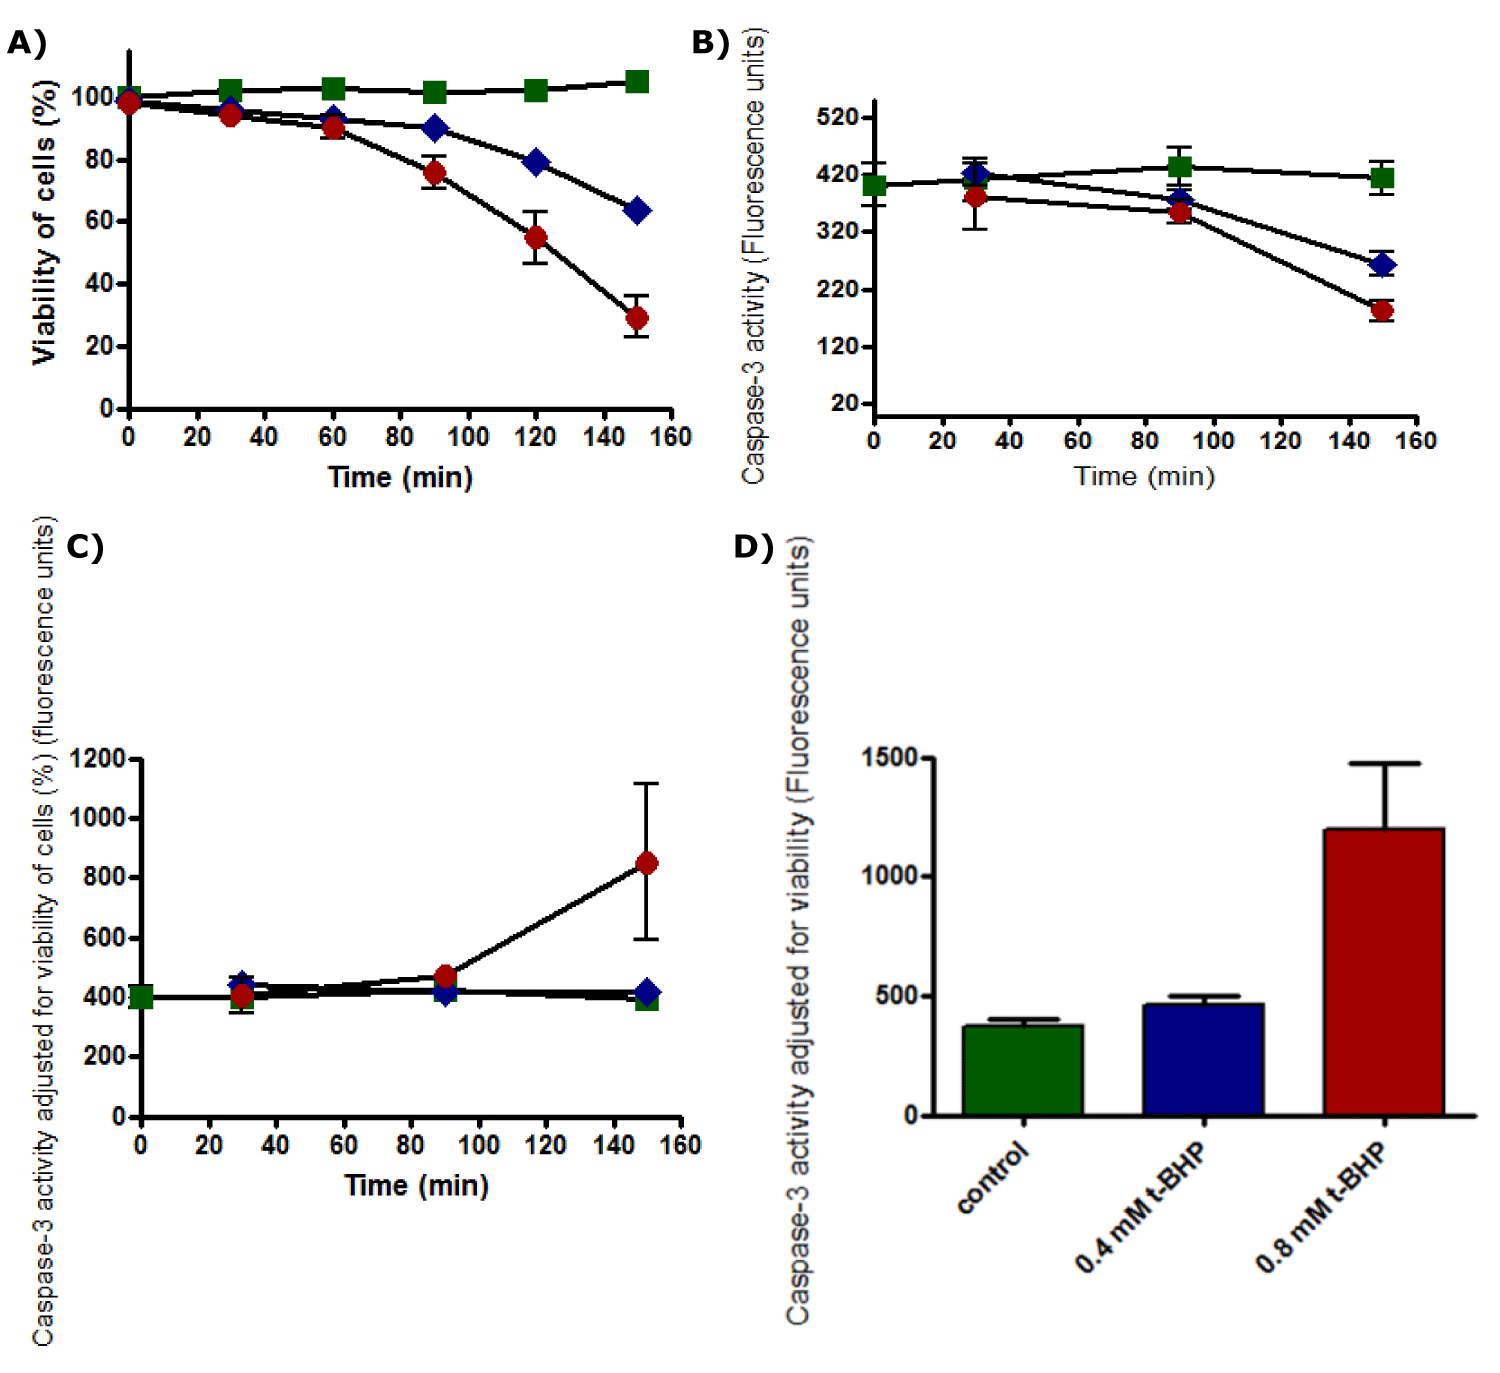
The standard curve for caspase-3 activity was displayed a linear response (Figure 15). Cell viability was recorded that untreated HepG2 cells remained alive through incubation time for up to 150 minutes. Still, it was not the same for treated cells with 0.4 and 0.8 mM t-BHP, where it was declined from 90% to about 60% and 30%, respectively (Figure 16a). Results of caspase enzyme activity showed that the activity of an enzyme in untreated HepG2 cells was unchanged during the incubation time up to 150 minutes. Cells treated with 0.4 and 0.8 mM t-BHP displayed similar behaviors as their caspase enzyme activity declined after 30 minutes of incubation from 400 to reach about 300 and 200 for cells treated with 0.4 and 0.8 Mm t-BHP, respectively (Figure 16b). When caspase activity was adjusted for viability, some variations were observed at 150 minutes for HepG2 cells treated with 0.8 mM t-BHP. Results obtained from Friedman test for untreated and treated HepG2 cells with 0.4 and 0.8 mM t-BHP at 150 minutes showed significance and p-value was 0.0278 (p ≤ 0.05) and resulted obtained by Dunn’s Multiple Comparison Test indicated a significant increase in caspase activity at 0.8 mM t-BHP but not at 0.4 mM t-BHP (Figures 16c,d).
In summary, results of the western bolt, in-cell western, and immunocytochemistry indicate no much evidence for apoptosis when HepG2 cells were incubated with 0.4 and 0.8 mM for 60, 90, and 120 minutes using a medium containing 2% serum. Still, there was a significantly increase in caspase-3 activity at 0.8 mM t-BHP. On the other hand, cell death was increased under the same applied conditions.
Effect of phytochemicals on t-BHP: western blot data
Although there was the only modest indication for apoptosis in western blot, in-cell western, and immunocytochemistry during incubation of HepG2 cells with t-BHP for up to 2 hours, there was obvious evidence for cell death and decline in the viability of cells under these conditions. Therefore, the purpose of this experiment was to show the cytoprotective effect of direct and indirect antioxidants against the toxicity effect of t-BHP to induce apoptosis even the induction was slight. We chose 60 and 120 minutes specifically because, at these times, caspase-3 was activated slightly, and faint bands appeared at 17 KDa (Figure 10). Moreover, Q was selected as an example of a direct antioxidant and I3C as an indirect antioxidant to attain the cytoprotection effect against t-BHP. To achieve the best cytoprotection by an antioxidant, we relied on specific conditions from previous cytoprotection experiments, including the non-toxic concentration of antioxidant, cytoprotection pattern, and serum concentration.
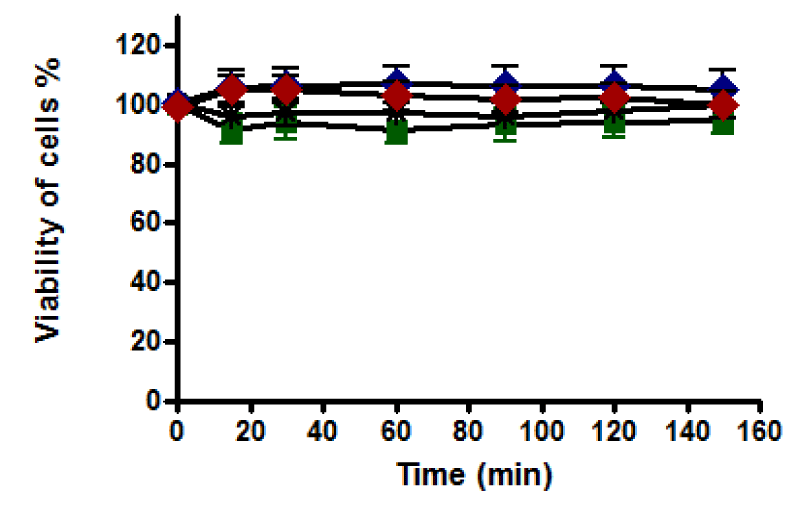
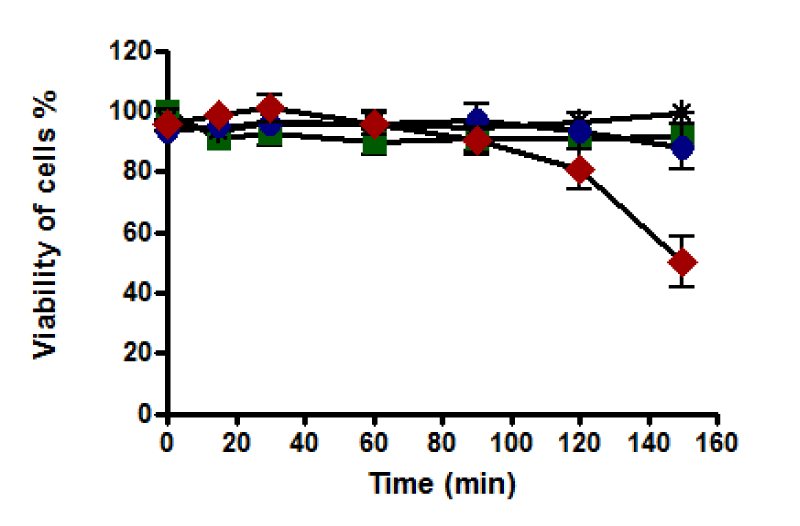
(a) Direct cytoprotection: The best cytoprotection by Q against the t-BHP effect was displayed by using a direct cytoprotection pattern where HepG2 cells were incubated with Q (100 μg/ml) and 0.8 mM of t-BHP simultaneously for 5 hours using a medium containing 2% serum [23]. Therefore, incubation of treated HepG2 cells with Q (100 μg/ml) and 0.4 and 0.8 mM t-BHP simultaneously for up to 150 minutes using a medium containing 2% serum was studied. Under these conditions, cell viability was unaffected throughout the incubation with Q, which means that Q was not toxic to the cells at that selected concentration, and cell viability was retained at 100%. Moreover, Q protected cells from the toxic effect of t-BHP, and no decline in the viability of cells was recorded at any time of incubation (Figure 17). Furthermore, caspase-3 for all the treated samples at 60, 90, and 120 min has been shown at 37 KDa with no evidence for caspase-3 cleavage at 17 KDa being identified at any time during the incubation (Figures 18,19).
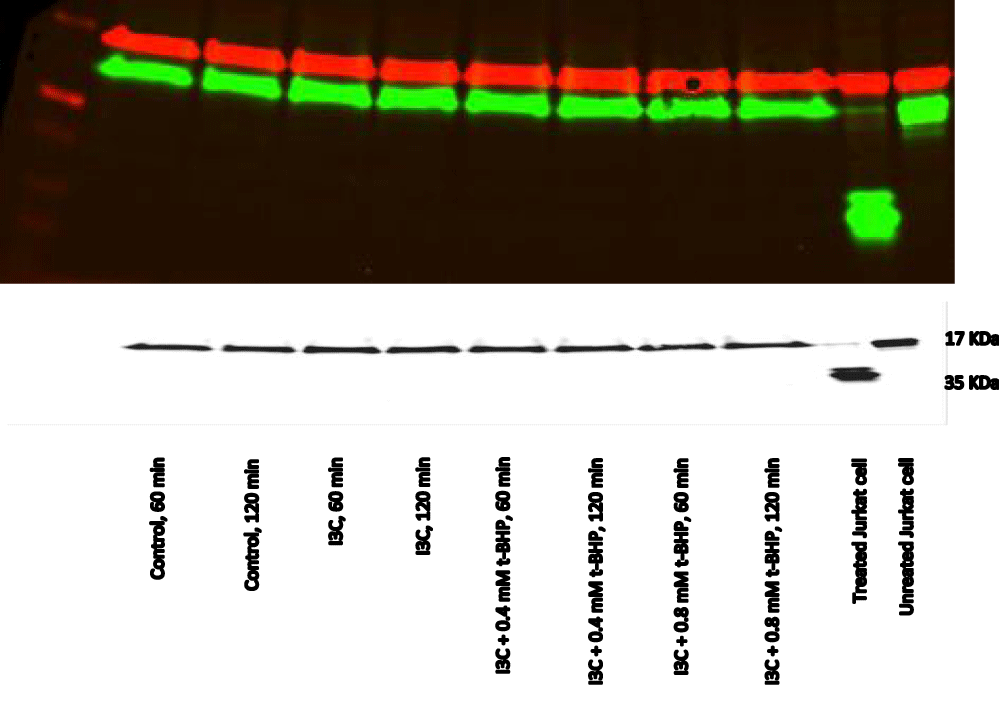
(b) Indirect cytoprotection: The best cytoprotection by I3C against the toxicity effect of t-BHP was shown by using an indirect cytoprotection pattern where HepG2 cells were incubated with I3C (25 μg/ml) for 20 hours in a medium containing 10% serum prior exposed to 0.8 mM t-BHP for 5 hours using medium containing 2% serum [23]. Incubation of treated HepG2 cells with I3C (25 μg/ml) using 10% serum for 20 hours prior exposure to 0.4 and 0.8 mM t-BHP for up to 150 minutes displayed good results. Under these conditions, cell viability results indicated that I3C was not toxic to the cells at that selected concentration and cells remained alive by 100% during all the time. Moreover, it could protect cells from the toxic effect of t-BHP till 90 min and recorded 100% cell viability. Still, after that time, a decline in viability was recorded at 120 and 150 minutes, which decreased to 75 and 50 %, respectively (Figure 20). Moreover, caspase-3 for all the treated samples at 60, 90, and 120 min was visible at 37 KDa, whereas the cleaved caspase-3 was not apparent at 17 KDa min compared with the positive control (Figures 21,22).
Reactive Oxygen Species (ROS)
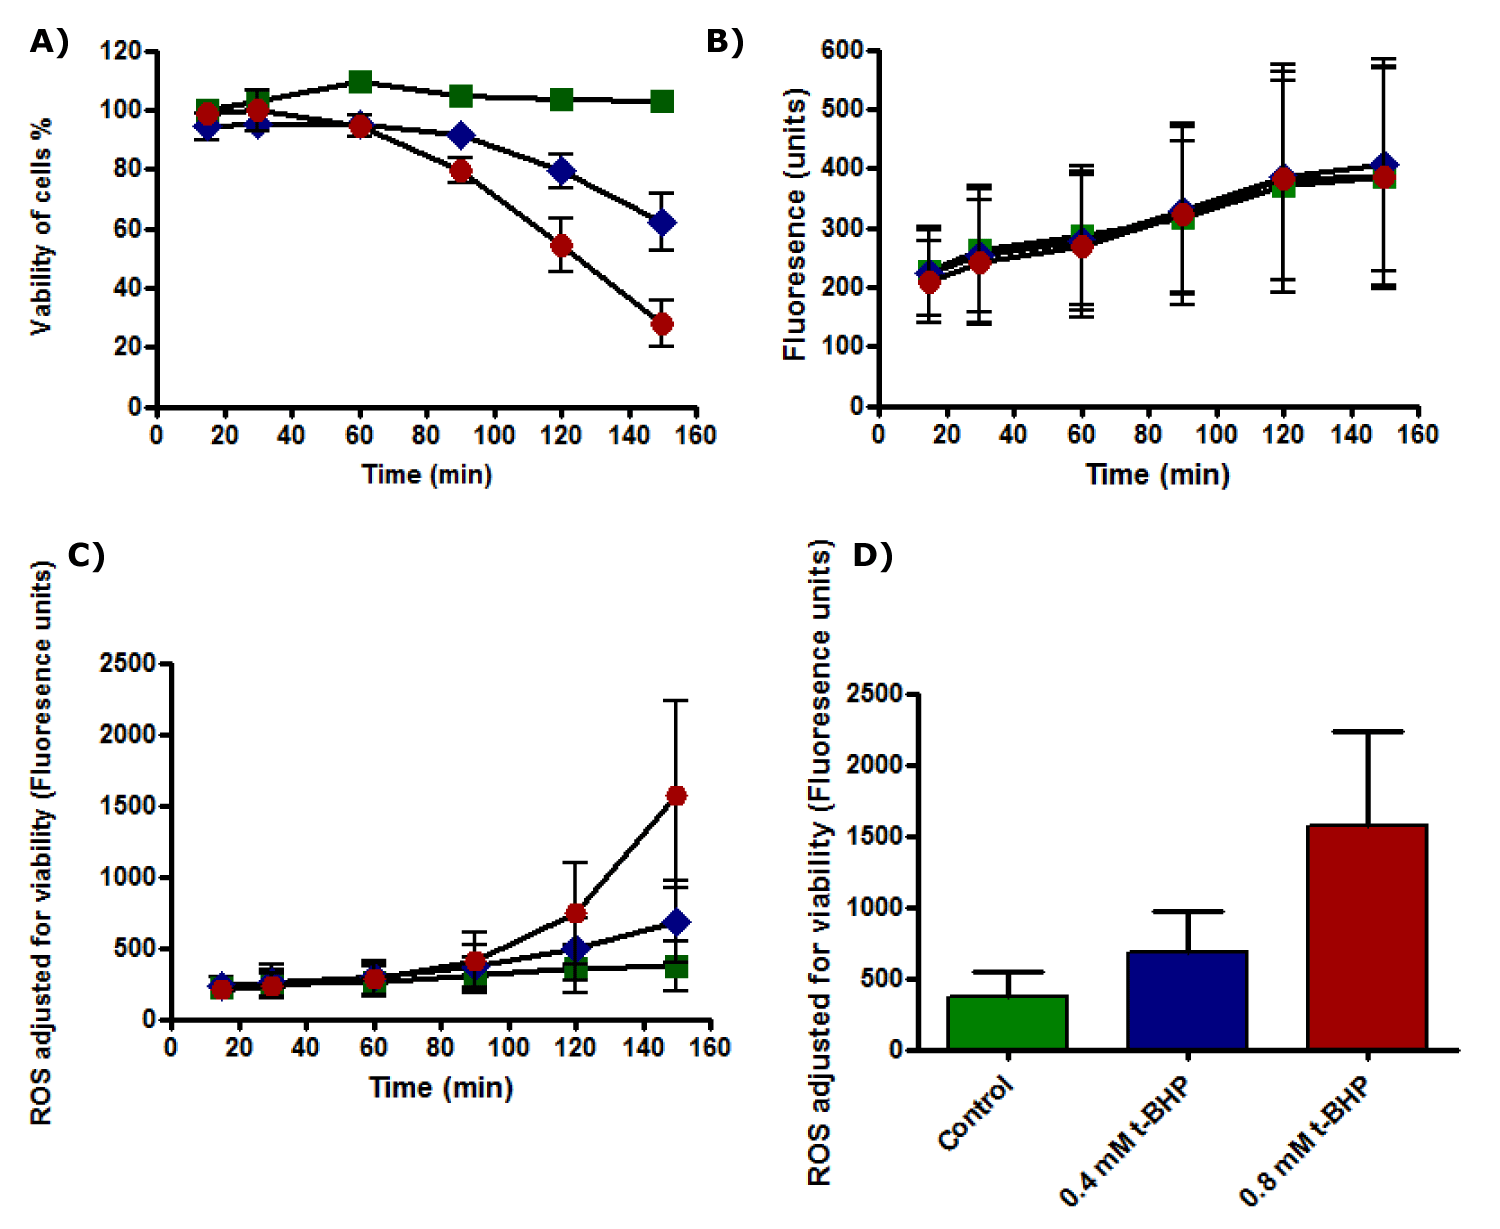
Results showed that cell viability of untreated HepG2 cells was not affected during all incubation time and viability of cells was 100% during the incubation while the viability of the treated cells with 0.4 and 0.8 mM t-BHP decreased from 80% to about 60% and from % 75 to 25% after 2.5 hours of incubation with 0.4 and 0.8 mM t-BHP respectively (Figure 23a). ROS production increased gradually with an incubation time of HepG2 cells with or without t-BHP, using medium 2% serum. HepG2 produced ROS during incubation with 0.4 and 0.8 mM t-BHP for up to 150 minutes (Figure 23b). No significant variation could be detected between untreated HepG2 and HepG2 cells treated with 0.4 mM of t-BHP. When ROS production by HepG2 cells was adjusted for the viability of HepG2 cells incubated with 0.4 and 0.8 mM t-BHP for up to 150 minutes, results showed that no differences between untreated and treated HepG2 cells with 0.4 and 0.8 mM of t-BHP during incubations for up to 120 minutes but statistical differences were observed between untreated and treated cells with 0.8 mM t-BHP at 150 minutes (Figure 23c). Statistical analysis results from the Friedman test followed by Dunn’s Multiple Comparison Test showed significance between control and treated cell with 0.8 mM t-BHP at 150 minutes, and p-value equals 0.0278 (p ≤ 0.05) (Figure 23d).
Glutathione (GSH)
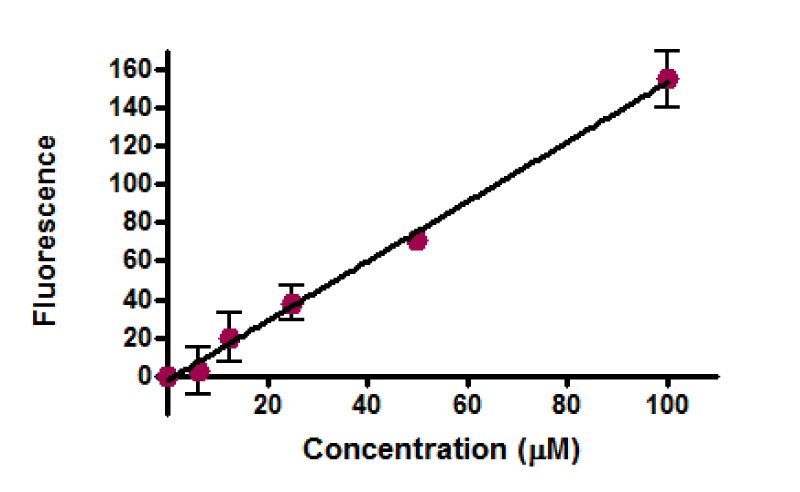
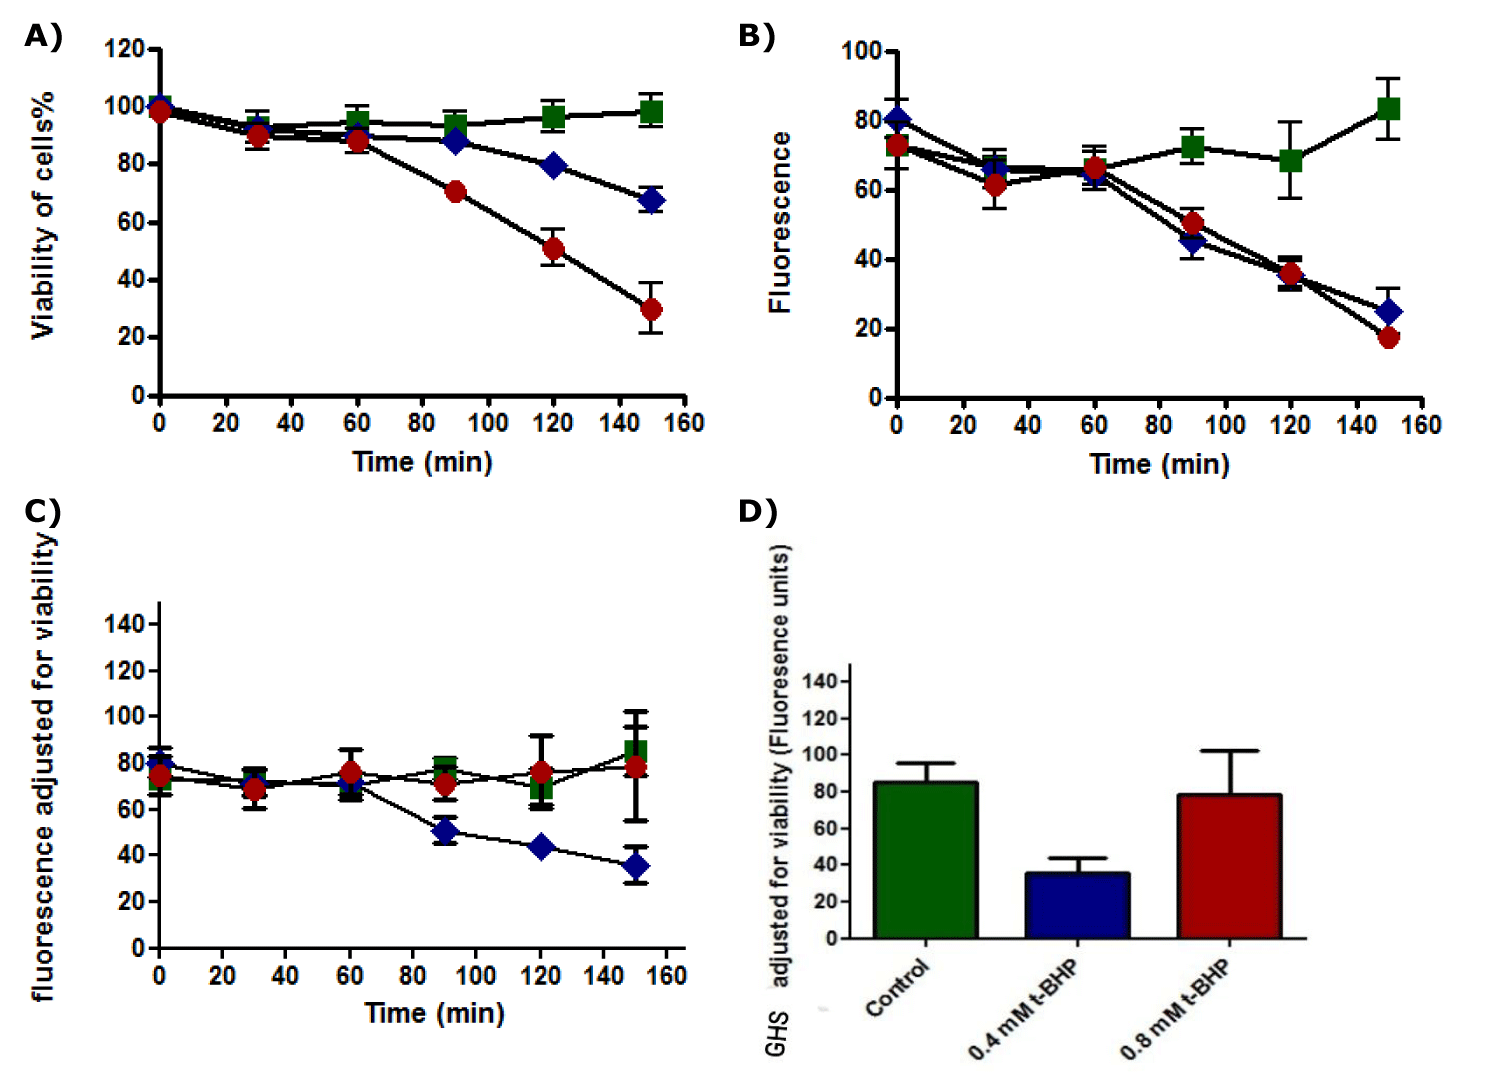
Results of the standard curve for GSH demonstrated linear response (Figure 24). The viability of untreated HepG2 cells remained unaffected during incubation for different periods (0, 30, 60, 90, 120, and 150 minutes). In contrast, the number of dead cells treated with 0.4 and 0.8 mM of t-BHP was increased when incubation time increased, and viability of cells was declined after 2.5 hours of incubation from 80% to about 60% and 25% for cells treated with 0.4 and 0.8 mM t-BHP respectively (Figure 25a). Glutathione (GSH) content for untreated HepG2 cells remained approximately constant when cells were incubated for up to 150 minutes in the absence of t-BHP, while the amount of GSH for treated HepG2 cells with 0.4 and 0.8 mM of t-BHP was decreased after 2.5 hours of incubation from 70 fluorescence units to reach about 25-30 fluorescence units for both treatments (Figure 25b). When GSH production by HepG2 cells was adjusted for the viability of HepG2 cells that incubated with 0.4 and 0.8 mM of t-BHP for 15, 30, 60, 90, 120, and 150 minutes, results showed that no differences between untreated and treated HepG2 cells with 0.4 and 0.8 mM t-BHP during incubations for up to 150 minutes (Figure 25c). The results from the Friedman test and Dunn’s Multiple Comparison Test showed no significance at 150 minutes, where the p-value equals 0.0608 (p ≥ 0.05) (Figure 25d).
Lipid Peroxidation (LPO)
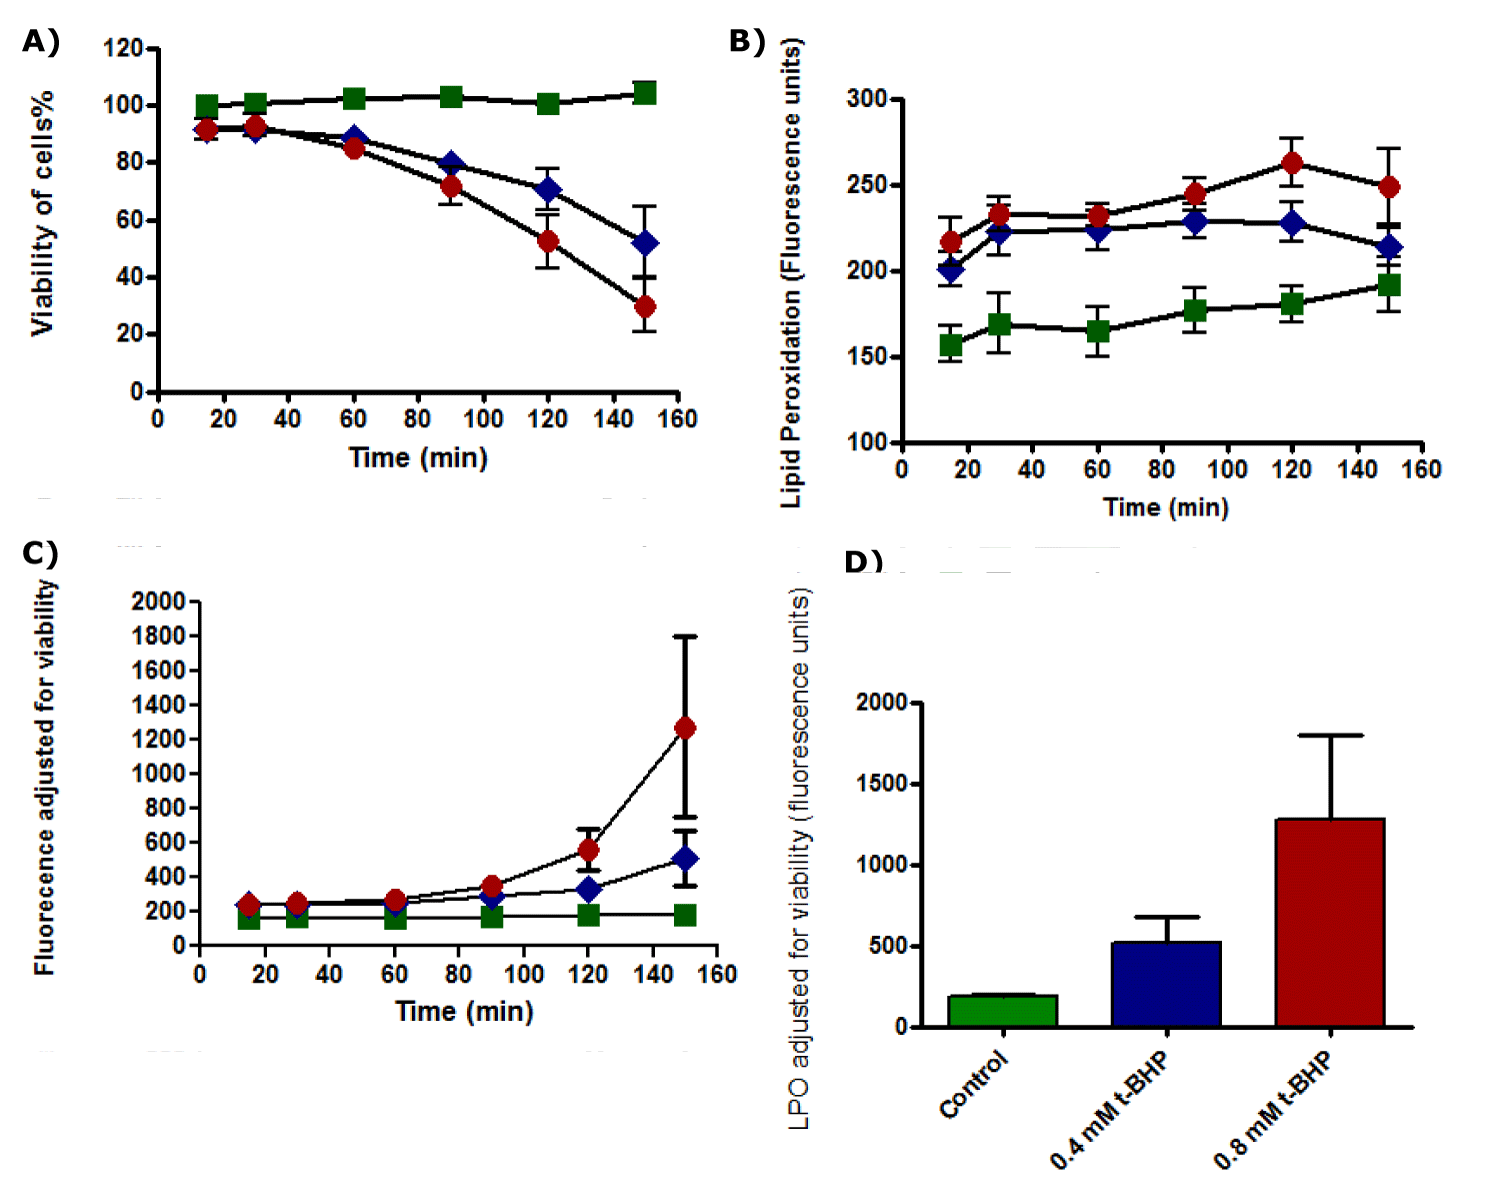
The viability of untreated and treated HepG2 cells with 0.4 and 0.8 mM of t-BHP for different periods 15, 30, 60, 90, 120, and150 minutes showed that the untreated cells were alive during all the incubation time. In contrast, the viability of both treated cells with 0.4 and 0.8 mM of t-BHP was declined after 2.5 hours of incubation from 80% to about 60% and 30% for 0.4 and 0.8 mM of t-BHP, respectively (Figure 26a).
Lipid Peroxidation (LPO) increased gradually for untreated HepG2 cells and HepG2 cells treated with 0.4 and 0.8 mM t-BHP for up to 150 minutes. LPO produced by untreated cells increased from 150 fluorescence units to about 180 fluorescence units. In comparison, LPO produced by HepG2 cells treated with 0.4 mM of t-BHP was increased from 200 fluorescence units to about 220 fluorescence units at 120 and declined to 210 fluorescence units again. Similarly, with 0.8 mM of t-BHP treated cells, it produced LPO, which increased from 220 fluorescence units to about 260 fluorescence units at 120 minutes and declined again to about 250 fluorescence units at 150 minutes (Figure 26b). When LPO production was adjusted for viability, it displayed different results. Results showed that no differences between all untreated and treated cells during incubation time from 15 to 90 minutes, and a minimal variation could be noticed between them at 120 minutes of incubation. Still, a big difference and significant variation were observed at 150 minutes of incubation between untreated and treated cells with 0.8 mM t-BHP where p equals 0.0046 (p ≤ 0.05) (Figure 26c,d).
Discussion
Toxicity effect of t-BHP
We chose t-BHP as a model to study oxidative stress in cell systems and cell death pathways. Because it considers one of the most common pro-oxidant agents used in cell lines such as HepG2 cells [22,89], it can decompose to free radicals [90], a primary factor for hepatotoxicity [54].
Regarding t-BHP, it induced cell death at concentrations higher than 0.2 mM with the different time course of toxicity and effectiveness of phytochemicals at concentrations of 0.4 and 0.8 mM t-BHP. However, the total toxic effect of the two concentrations of t-BHP was similar after 5 hours of exposure. These findings led us to explore the mechanism (s) of toxicity of t-BHP at these two concentrations. The initial thoughts suggest that cell viability and damage occurs by t-BHP by using 0.4 is less than 0.8 [24,89].
Effect of phytochemicals
Under identical conditions, Q and EGCG significantly protected cells against oxidative damage initiated by t-BHP. This cellular defense is attributed to the scavenging properties of these two compounds because they possess direct antioxidants properties [91]. They can scavenge free radicals initiated by t-BHP, which increases protection and prevents injuries. In contrast, the indirect antioxidants I3C and SFN [91] failed to provide complete protection against cellular damages at concentrations higher than 0.2 mM t-BHP. It visualizes as the only partial protection from I3C at 0.4 mM t-BHP. This failing may rely on indirect antioxidants and cannot scavenge free radicals like Q and EGCG. Moreover, the toxicity concentrations of I3C and SFN may significantly interact with t-BHP in cell death in the absence of serum and increased free radicals amounts. The omission of albumin represents the absence of its antioxidant properties (Kanno, et al. [23]) which probably increased oxidative damages induced by t-BHP, high concentration of I3C, and SFN.
Time dependence and effect of serum
Regarding incubation time with t-BHP, the cellular oxidative damage caused by 0.8 mM t-BHP was higher than 0.4 mM t-BHP at the extended incubation time in the presence or absence of serum albumin. The generated amounts of free radicals by the t-BHP increase as the concentration of the t-BHP increase, which means the amounts of free radicals produced by 0.8 mM are more than in 0.4 mM. Therefore, cells are considerably damaged when exposed to 0.8 mM t-BHP comparing with 0.4 mM. These damages were significantly proportional to the time of incubation. Moreover, the effect of serum to reduce the number of dead cells either in 0.4 or 0.8 mM with the time was obvious where it decreases cell death according to its antioxidant protective effects [23,92].
Detection of caspase-3 activation
When cells undergo apoptosis, proteases (caspases) are cleaved [93]. Participation of this caspase family, in particular caspase-3, in signaling and apoptosis represents the crucial importance of these enzymes in this form of cell death [93]. This study analyzed caspase-3 cleavage by western blotting and detected its activity to ascertain if t-BHP initiated apoptosis in HepG2 cells. Approximately 40 to 70% of cell death occurred after 150 minutes of incubation with 0.4 and 0.8 mM t-BHP, respectively (Figure 7). Accordingly, and relying on the fact that apoptosis and activation of caspase-3 occur during the early stages of the cell death cascade. We selected the best time for incubation (60, 90, and 120 minutes) to analyze caspase-3 and determine apoptosis of treated and untreated HepG2 cells with t-BHP. Apoptosis and Caspase-3 activation are confirmed in HepG2 cells treated and untreated with glucose and Jurkat cells as a positive and negative control.
Regarding HepG2 cells treated with glucose, the high amount of glucose and prolonged exposure to the oxidant allow for caspase-3 activation and apoptosis. We cannot rely on the same explanation for treated HepG2 cells with t-BHP. We have cell death without apoptosis where bands of activated caspase-3 were not markedly elevated or remained low compared with positive and negative control. Moreover, in cell-western and immunocytochemistry results, we could not find evidence of caspase-3 activation in untreated or treated HepG2 cells with t-BHP for 60 and 120 minutes. The possible suggestion is that calpains may play a role in the down-regulation of caspase-3 activation during the cell death pathway due to chronic mitochondrial defects [95]. The predominance of Calpain over caspase-3 despite a transient activation of caspase-9 has remained a speculative assumption [96]. On the other side, scientists have discovered a cross-talk between caspases and calpains [97-100]. The mechanism of this cross-talk includes abnormal activation of Calpain due to an increase in the intracellular Ca+2, and the caspase-9/-3 apoptotic Pathway then may be partially blocked by Calpain, which leads to the cell death as well as inactivation of caspase-3 [95].
Caspase activity
Caspase-3 activity increased significantly in treated HepG2 cells with 0.8 mM at 150 minutes (Figure 16). No proof for apoptosis and activation of caspase-3 with little bands western blotting (Figure 10) and no visual signal in immunocytochemistry (Figure 14 )and in-cell western (Figure 12), but this may be due to the role of Calpain, which may prevent apoptosis due to direct or partial blocked for caspase-3 activation [95].
Effect of Q and I3C on caspase-3 activation
Stop apoptosis and inactivation of caspases does not mean there is no cellular death. Cell death occurs but blocked through the cross-talk between Calpain and caspases [95]. So, we decided to involve two compounds Q and I3C, that possess cytoprotection properties [91] in this event to provide protection against cellular damage induced by t-BHP and completely prevent that weak activation of caspase-3 in western blotting. Choosing Q and I3C is based on their cytoprotective properties by using the optimum conditions of concentration, cytoprotection pattern, and presence of serum [23]. Q directly contributed to the defense of HepG2 cells against t-BHP, where cells retained 100% viable during all the time (Figure 17). Hydroxyl groups belonging to Q contribute to protection by attacking free radicals produced by t-BHP and inactivated them [91]. Western blot results come identical to the viability test, with no visual evidence for the thin bands (Figure 18) because of the action of Q in providing defense and preventing the cleavage of caspase-3 and apoptosis in treated HepG2 cells with 0.4 mM t-BHP at 60, 90, and 120 minutes and 0.8 mM t-BHP at 60 minutes. Choosing the suitable antioxidant to participate in the cytoprotection process requires attention.
Regarding I3C, it displayed a toxic effect on HepG2 cells during incubation for prolonged [23]. Accordingly, the right concentration for I3C is 25 mg, the amount required for achieving protection without any toxicity effect, and the extended incubation time is also essential for up-regulation proteins because I3C is an indirect antioxidant [23]. We also gave the serum albumin great attention to achieve the optimum conditions for completing cytoprotection by I3C against oxidative damage provoked by t-BHP in HepG2 cells. Therefore, we incubate I3C with HepG2 cells for 20 hours in 10% medium before exposure to t-BHP using medium 2% serum. The high amount of albumin protects the cells against the toxicity effects of I3C [23,101] and allows the up-regulation proteins mechanism to by I3C tp proceed ideally. Western blot results were identical with viability. There was no evidence for activated caspase-3 bands, which means that I3C was not toxic at that concentration. It even protected cells from 0.4 mM t-BHP probably by up-regulating proteins, prevented caspases activation, and stopped apoptosis induction.
On the other hand, although I3C partially protects the treated HepG2 cells with 0.8 mM t-BHP at 120 and 150 minutes, there was no evidence for apoptosis in western blot accompanying cell death. The reason for this, the low concentration of I3C was unable to protect cells against 0.8 mM t-BHP for a long time which caused low activation of caspase-3. This imperceptible activation did not display as bands in blot, maybe because of the role of Calpain, which blocked even that slight activation and stopped apoptosis.
Reactive oxygen species
Although ROS generated in small amounts in treated HepG2 cells with 0.4 and 0.8 mM t-BHP for up to 120 minutes, increased the apparent cell death was observed at 150 minutes in HepG2 cells treated with 0.8 mM t-BHP where ROS amounts increased significantly. ROS initiate in the early stages of apoptosis. Before the complete death of cells, they are just signals. Secondly, when there is impaired mitochondrial oxygen reduction, this causes alterations in mitochondrial permeability, leading to ROS production. Finally, the produced ROS induce the depolarization of the mitochondrial membrane and lead to further mitochondrial dysfunction [66,67]. Moreover, because the total cell death occurred after 2.5 hours, ROS probably generates after 90 minutes of incubation, which then impaired and, consequently, is low or observed later than the exact time. This impairing attributes to NAC, the scavenger of ROS, which may abolish the increased amounts of ROS [102].
Glutathione (GSH)
GSH plays a fundamental role in protecting cells from oxidative stress by scavenging ROS [10], and therefore, GSH decreases when ROS increases [102]. Our findings indicated no significant depletion in GSH amounts. The reasonable explanation for this is that ROS is not enough to cause GSH content depletion. Our previous finding represented that t-BHP induced apoptosis because caspase-3 activity and ROS were increased significantly in treated HepG2 cells with 0.8 mM t-BHP at 150 minutes. Moreover, relying on our suggestion about ROS, the remaining ROS after NAC involvement was not too much to consume a large amount of GSH, which led to a slightly decreased GSH. This imperceptible decrease in GSH was accompanied by increased cell death.
Lipid peroxidation
The free radicals and the peroxidation of the lipids-containing lipoprotein system of cells implicate oxidative stress and damaging cell components (Wallin, et al. [103]). Participation Lipid Peroxidation (LPO) in damaging the treated HepG2 cells with 0.4 and 0.8 mM t-BHP could provoke cell death comparing with the control. According to this, besides statistical results of LPO, ROS, and caspase-3 activity, we suggest that lipid peroxidation initiation can induce apoptosis in HeG2 cells and cause cellular damage.
Conclusion
In conclusion, apoptosis induces in treated HepG2 cells treated with t-BHP. Still, we could not determine the exact time for induction successfully because many confusing factors may contribute to apoptosis signaling disorder, such as Calpain in caspase-3 activation and NAC in ROS, which delays apoptosis. We recognize the prominent role of phytochemicals involves in cytoprotection to reduce toxicity. This participation should consider the concentration of phytochemicals, the pattern of incubation, and the presence or absence of serum albumin.
Acknowledgment
The authors thank The University of Nottingham and the School of Life Sciences (UK) for their scientific support. The author, Dr. Maha J Hashim, would like to thank her supervisor in Ph.D. (including this research), Dr. Jeffrey R Fry at the School of Life Sciences, The University of Nottingham (UK), for all his guidance and assistance. Also, big thanks from Dr. Maha J Hashim to her father, Mr. Jalal Hashim Mohammed Tabana, in Iraq, who has funded her Ph.D. study (including this research) with all living costs in the United Kingdom for five years.
References
- Green DR. Apoptotic pathways: the roads to ruin. Cell. 1998 Sep 18;94(6):695-8. doi: 10.1016/s0092-8674(00)81728-6. PMID: 9753316.
- Huang Z. The chemical biology of apoptosis. Exploring protein-protein interactions and the life and death of cells with small molecules. Chem Biol. 2002 Oct;9(10):1059-72. doi: 10.1016/s1074-5521(02)00247-8. PMID: 12401491.
- Fink SL, Cookson BT. Apoptosis, pyroptosis, and necrosis: mechanistic description of dead and dying eukaryotic cells. Infect Immun. 2005 Apr;73(4):1907-16. doi: 10.1128/IAI.73.4.1907-1916.2005. PMID: 15784530; PMCID: PMC1087413.
- Wyllie AH, Kerr JF, Currie AR. Cell death: the significance of apoptosis. Int Rev Cytol. 1980;68:251-306. doi: 10.1016/s0074-7696(08)62312-8. PMID: 7014501.
- Martin KR. Targeting apoptosis with dietary bioactive agents. Exp Biol Med (Maywood). 2006(b) Feb;231(2):117-29. doi: 10.1177/153537020623100201. PMID: 16446487.
- Boatright KM, Salvesen GS. Mechanisms of caspase activation. Curr Opin Cell Biol. 2003 Dec;15(6):725-31. doi: 10.1016/j.ceb.2003.10.009. PMID: 14644197.
- Los M, Wesselborg S, Schulze-Osthoff K. The role of caspases in development, immunity, and apoptotic signal transduction: lessons from knockout mice. Immunity. 1999 Jun;10(6):629-39. doi: 10.1016/s1074-7613(00)80062-x. PMID: 10403638.
- Bae SJ, Lee JS, Lee EK, Kim JM, Choi J, Heo HS, Yu BP, Chung HY. The anti-apoptotic action of 5-hydroxyindole: protection of mitochondrial integrity. Biol Pharm Bull. 2010;33(4):550-5. doi: 10.1248/bpb.33.550. PMID: 20410584.
- O’Callaghan YC, Woods JA, O’Brien NM. Characteristics of 7 beta-hydroxycholesterol-induced cell death in a human monocytic blood cell line, U937, and a human hepatoma cell line, HepG2. Toxicol In Vitro. 2002 Jun;16(3):245-51. doi: 10.1016/s0278-6915(02)00050-9. PMID: 12020597.
- Reed DJ. Glutathione: toxicological implications. Annu Rev Pharmacol Toxicol. 1990;30:603-31. doi: 10.1146/annurev.pa.30.040190.003131. PMID: 2188580.
- Gilmont RR, Dardano A, Young M, Engle JS, Adamson BS, Smith DJ Jr, Rees RS. Effects of glutathione depletion on oxidant-induced endothelial cell injury. J Surg Res. 1998 Nov;80(1):62-8. doi: 10.1006/jsre.1998.5328. PMID: 9790816.
- Mans DR, Schuurhuis GJ, Treskes M, Lafleur MV, Retèl J, Pinedo HM, Lankelma J. Modulation by D,L-buthionine-S,R-sulphoximine of etoposide cytotoxicity on human non-small cell lung, ovarian and breast carcinoma cell lines. Eur J Cancer. 1992;28A(8-9):1447-52. doi: 10.1016/0959-8049(92)90541-9. PMID: 1325177.
- Schneider E, Yamazaki H, Sinha BK, Cowan KH. Buthionine sulphoximine-mediated sensitisation of etoposide-resistant human breast cancer MCF7 cells overexpressing the multidrug resistance-associated protein involves increased drug accumulation. Br J Cancer. 1995 Apr;71(4):738-43. doi: 10.1038/bjc.1995.144. PMID: 7710938; PMCID: PMC2033716.
- Martin KR. Targeting apoptosis with dietary bioactive agents. Exp Biol Med (Maywood). 2006(a) Feb;231(2):117-29. doi: 10.1177/153537020623100201. PMID: 16446487.
- Cai J, Jiang WG, Mansel RE. Inhibition of angiogenic factor- and tumour-induced angiogenesis by gamma linolenic acid. Prostaglandins Leukot Essent Fatty Acids. 1999 Jan;60(1):21-9. doi: 10.1054/plef.1998.0004. PMID: 10319914.
- Rose DP, Connolly JM, Liu XH. Effects of linoleic acid and gamma-linolenic acid on the growth and metastasis of a human breast cancer cell line in nude mice and on its growth and invasive capacity in vitro. Nutr Cancer. 1995;24(1):33-45. doi: 10.1080/01635589509514391. PMID: 7491296.
- Nicholson DW, Thornberry NA. Caspases: killer proteases. Trends Biochem Sci. 1997 Aug;22(8):299-306. doi: 10.1016/s0968-0004(97)01085-2. PMID: 9270303.
- Mateos R, Goya L, Bravo L. Metabolism of the olive oil phenols hydroxytyrosol, tyrosol, and hydroxytyrosyl acetate by human hepatoma HepG2 cells. J Agric Food Chem. 2005 Dec 28;53(26):9897-905. doi: 10.1021/jf051721q. PMID: 16366672.
- Cui J, Nan KJ, Tian T, Guo YH, Zhao N, Wang L. Chinese medicinal compound delisheng has satisfactory anti-tumor activity, and is associated with up-regulation of endostatin in human hepatocellular carcinoma cell line HepG2 in three-dimensional culture. World J Gastroenterol. 2007 Nov 7;13(41):5432-9. doi: 10.3748/wjg.v13.i41.5432. PMID: 17907285; PMCID: PMC4171276.
- Jimenez-Lopez JM, Cederbaum AI. Green tea polyphenol epigallocatechin-3-gallate protects HepG2 cells against CYP2E1-dependent toxicity. Free Radic Biol Med. 2004 Feb 1;36(3):359-70. doi: 10.1016/j.freeradbiomed.2003.11.016. PMID: 15036355.
- Provin C, Takano K, Yoshida T, Sakai Y, Fujii T, Shirakashi R. Low O2 metabolism of HepG2 cells cultured at high density in a 3D microstructured scaffold. Biomed Microdevices. 2009 Apr;11(2):485-94. doi: 10.1007/s10544-008-9254-8. PMID: 19082898.
- Alía M, Ramos S, Mateos R, Granado-Serrano AB, Bravo L, Goya L. Quercetin protects human hepatoma HepG2 against oxidative stress induced by tert-butyl hydroperoxide. Toxicol Appl Pharmacol. 2006(b) Apr 15;212(2):110-8. doi: 10.1016/j.taap.2005.07.014. Epub 2005 Aug 29. PMID: 16126241.
- Hashim MJ, Fry JR. A Cell-Based Assay for Antioxidant Behaviour of Phytochemicals: Influence of Exposure Time and Presence of Serum. J Biomed Res Environ Sci. 2021 July 27;2(7):610-617. doi: 10.37871/jbres1286 Article ID: JBRES1286. https://bit.ly/2YjVlRs
- Piret JP, Arnould T, Fuks B, Chatelain P, Remacle J, Michiels C. Mitochondria permeability transition-dependent tert-butyl hydroperoxide-induced apoptosis in hepatoma HepG2 cells. Biochem Pharmacol. 2004;67(4):611-20. https://bit.ly/3gVFezY
- Kim CH, Yasumoto K, Suzuki T, Yoshida M. tert-butyl hydroperoxide-induced hemolysis of alpha-tocopherol-decreased erythrocytes from selenium-deficient and selenium-adequate rats. J Nutr Sci Vitaminol (Tokyo). 1988 Oct;34(5):481-90. doi: 10.3177/jnsv.34.481. PMID: 3230419.
- Meier P, Finch A, Evan G. Apoptosis in development. Nature. 2000 Oct 12;407(6805):796-801. doi: 10.1038/35037734. PMID: 11048731.
- Kerr JF, Wyllie AH, Currie AR. Apoptosis: a basic biological phenomenon with wide-ranging implications in tissue kinetics. Br J Cancer. 1972 Aug;26(4):239-57. doi: 10.1038/bjc.1972.33. PMID: 4561027; PMCID: PMC2008650.
- Lopaczynski W, Zeisel SH. Antioxidants, programmed cell death, and cancer. Nutrition Research. 2001;21(1-2):295-307 doi: 10.1016/S0271-5317(00)00288-8.
- Lauber K, Blumenthal SG, Waibel M, Wesselborg S. Clearance of apoptotic cells: getting rid of the corpses. Mol Cell. 2004 May 7;14(3):277-87. doi: 10.1016/s1097-2765(04)00237-0. PMID: 15125832.
- Rodriguez M, Schaper J. Apoptosis: measurement and technical issues. J Mol Cell Cardiol. 2005 Jan;38(1):15-20. doi: 10.1016/j.yjmcc.2004.11.002. Epub 2004 Dec 9. PMID: 15623418.
- Schafer ZT, Kornbluth S. The apoptosome: physiological, developmental, and pathological modes of regulation. Dev Cell. 2006 May;10(5):549-61. doi: 10.1016/j.devcel.2006.04.008. PMID: 16678772.
- Green DR, Bissonnette RP, Cotter TG. Apoptosis and cancer. Important Adv Oncol. 1994:37-52. PMID: 8206494.
- Malaguarnera L. Implications of apoptosis regulators in tumorigenesis. Cancer Metastasis Rev. 2004 Aug-Dec;23(3-4):367-87. doi: 10.1023/B:CANC.0000031774.32572.df. PMID: 15197336.
- Riedl SJ, Shi Y. Molecular mechanisms of caspase regulation during apoptosis. Nat Rev Mol Cell Biol. 2004 Nov;5(11):897-907. doi: 10.1038/nrm1496. PMID: 15520809.
- Creagh EM, Conroy H, Martin SJ. Caspase-activation pathways in apoptosis and immunity. Immunol Rev. 2003 Jun;193:10-21. doi: 10.1034/j.1600-065x.2003.00048.x. PMID: 12752666.
- Walker NP, Talanian RV, Brady KD, Dang LC, Bump NJ, Ferenz CR, Franklin S, Ghayur T, Hackett MC, Hammill LD, et al. Crystal structure of the cysteine protease interleukin-1 beta-converting enzyme: a (p20/p10)2 homodimer. Cell. 1994 Jul 29;78(2):343-52. doi: 10.1016/0092-8674(94)90303-4. PMID: 8044845.
- Wilson KP, Black JA, Thomson JA, Kim EE, Griffith JP, Navia MA, Murcko MA, Chambers SP, Aldape RA, Raybuck SA, et al. Structure and mechanism of interleukin-1 beta converting enzyme. Nature. 1994 Jul 28;370(6487):270-5. doi: 10.1038/370270a0. PMID: 8035875.
- Nagata S. Fas ligand-induced apoptosis. Annual Review of Genetics. 1999;33:29-55. doi: 10.1146/annurev.genet.33.1.29.
- Green DR, Kroemer G. The pathophysiology of mitochondrial cell death. Science. 2004 Jul 30;305(5684):626-9. doi: 10.1126/science.1099320. PMID: 15286356.
- Olson M, Kornbluth S. Mitochondria in apoptosis and human disease. Curr Mol Med. 2001 Mar;1(1):91-122. doi: 10.2174/1566524013364239. PMID: 11899246.
- Danial NN, Korsmeyer SJ. Cell death: critical control points. Cell. 2004 Jan 23;116(2):205-19. doi: 10.1016/s0092-8674(04)00046-7. PMID: 14744432.
- Cory S, Adams JM. The Bcl2 family: regulators of the cellular life-or-death switch. Nat Rev Cancer. 2002 Sep;2(9):647-56. doi: 10.1038/nrc883. PMID: 12209154.
- Liu X, Kim CN, Yang J, Jemmerson R, Wang X. Induction of apoptotic program in cell-free extracts: requirement for dATP and cytochrome c. Cell. 1996 Jul 12;86(1):147-57. doi: 10.1016/s0092-8674(00)80085-9. PMID: 8689682.
- Srinivasula SM, Ahmad M, Fernandes-Alnemri T, Alnemri ES. Autoactivation of procaspase-9 by Apaf-1-mediated oligomerization. Mol Cell. 1998 Jun;1(7):949-57. doi: 10.1016/s1097-2765(00)80095-7. PMID: 9651578.
- Zou H, Henzel WJ, Liu X, Lutschg A, Wang X. Apaf-1, a human protein homologous to C. elegans CED-4, participates in cytochrome c-dependent activation of caspase-3. Cell. 1997 Aug 8;90(3):405-13. doi: 10.1016/s0092-8674(00)80501-2. PMID: 9267021.
- Thompson CB. Apoptosis in the pathogenesis and treatment of disease. Science. 1995 Mar 10;267(5203):1456-62. doi: 10.1126/science.7878464. PMID: 7878464.
- Zhang ZL, Wang Y, Zhou W, Hao YJ. Addison’s disease secondary to connective tissue diseases: a report of six cases. Rheumatol Int. 2009 Apr;29(6):647-50. doi: 10.1007/s00296-008-0749-7. Epub 2008 Oct 19. PMID: 18932000.
- Reed JC. Apoptosis-regulating proteins as targets for drug discovery. Trends Mol Med. 2001 Jul;7(7):314-9. doi: 10.1016/s1471-4914(01)02026-3. PMID: 11425640.
- Fischer U, Schulze-Osthoff K. Apoptosis-based therapies and drug targets. Cell Death Differ. 2005 Aug;12 Suppl 1:942-61. doi: 10.1038/sj.cdd.4401556. PMID: 15665817.
- Alía M, Ramos S, Mateos R, Bravo L, Goya L. Response of the antioxidant defense system to tert-butyl hydroperoxide and hydrogen peroxide in a human hepatoma cell line (HepG2). J Biochem Mol Toxicol. 2005;19(2):119-28. doi: 10.1002/jbt.20061. PMID: 15849717.
- Kehrer JP. Free radicals as mediators of tissue injury and disease. Crit Rev Toxicol. 1993;23(1):21-48. doi: 10.3109/10408449309104073. PMID: 8471159.
- Hyslop PA, Hinshaw DB, Halsey WA Jr, Schraufstätter IU, Sauerheber RD, Spragg RG, Jackson JH, Cochrane CG. Mechanisms of oxidant-mediated cell injury. The glycolytic and mitochondrial pathways of ADP phosphorylation are major intracellular targets inactivated by hydrogen peroxide. J Biol Chem. 1988 Feb 5;263(4):1665-75. PMID: 3338986.
- Lee KJ, Choi JH, Hwang YP, Chung YC, Jeong HG. Protective effect of caffeic acid phenethyl ester on tert-butyl hydroperoxide-induced oxidative hepatotoxicity and DNA damage. Food Chem Toxicol. 2008 Jul;46(7):2445-50. doi: 10.1016/j.fct.2008.03.032. Epub 2008 Apr 7. PMID: 18485557.
- Sohn JH, Han KL, Choo JH, Hwang JK. Macelignan protects HepG2 cells against tert-butylhydroperoxide-induced oxidative damage. Biofactors. 2007;29(1):1-10. doi: 10.1002/biof.5520290101. PMID: 17611289.
- Rush GF, Gorski JR, Ripple MG, Sowinski J, Bugelski P, Hewitt WR. Organic hydroperoxide-induced lipid peroxidation and cell death in isolated hepatocytes. Toxicol Appl Pharmacol. 1985 May;78(3):473-83. doi: 10.1016/0041-008x(85)90255-8. PMID: 4049396.
- Lötscher HR, Winterhalter KH, Carafoli E, Richter C. Hydroperoxide-induced loss of pyridine nucleotides and release of calcium from rat liver mitochondria. J Biol Chem. 1980 Oct 10;255(19):9325-30. PMID: 6773965.
- Lötscher HR, Winterhalter KH, Carafoli E, Richter C. Hydroperoxides can modulate the redox state of pyridine nucleotides and the calcium balance in rat liver mitochondria. Proc Natl Acad Sci U S A. 1979 Sep;76(9):4340-4. doi: 10.1073/pnas.76.9.4340. PMID: 41241; PMCID: PMC411570.
- Thornalley PJ, Trotta RJ, Stern A. Free radical involvement in the oxidative phenomena induced by tert-butyl hydroperoxide in erythrocytes. Biochim Biophys Acta. 1983 Aug 23;759(1-2):16-22. doi: 10.1016/0304-4165(83)90183-6. PMID: 6309246.
- Orrenius S, Ormstad K, Thor H, Jewell SA. Turnover and functions of glutathione studied with isolated hepatic and renal cells. Fed Proc. 1983 Dec;42(15):3177-88. PMID: 6315493.
- Tiwari M, Kakkar P. Plant derived antioxidants - Geraniol and camphene protect rat alveolar macrophages against t-BHP induced oxidative stress. Toxicol In Vitro. 2009 Mar;23(2):295-301. doi: 10.1016/j.tiv.2008.12.014. Epub 2008 Dec 24. PMID: 19135518.
- Henricks PAJ, Nijkamp FP. Reactive oxygen species as mediators in asthma. Pulmonary Pharmacology & Therapeutics. 2001;14(6):409-421 doi: 10.1006/pupt.2001.0319.
- Valko M, Rhodes CJ, Moncol J, Izakovic M, Mazur M. Free radicals, metals and antioxidants in oxidative stress-induced cancer. Chem Biol Interact. 2006 Mar 10;160(1):1-40. doi: 10.1016/j.cbi.2005.12.009. Epub 2006 Jan 23. PMID: 16430879.
- Keith M, Geranmayegan A, Sole MJ, et al. Increased oxidative stress in patients with congestive heart failure. Journal of the American College of Cardiology. 1998;31(6):1352-1356 doi: 10.1016/S0735-1097(98)00101-6.
- Christen Y. Oxidative stress and Alzheimer disease. American Journal of Clinical Nutrition. 2000;71(2):621s-629s.
- Kakkar P, Singh BK. Mitochondria: a hub of redox activities and cellular distress control. Mol Cell Biochem. 2007 Nov;305(1-2):235-53. doi: 10.1007/s11010-007-9520-8. Epub 2007 Jun 12. PMID: 17562131.
- Oh SH, Lim SC. A rapid and transient ROS generation by cadmium triggers apoptosis via caspase-dependent pathway in HepG2 cells and this is inhibited through N-acetylcysteine-mediated catalase upregulation. Toxicol Appl Pharmacol. 2006 May 1;212(3):212-23. doi: 10.1016/j.taap.2005.07.018. Epub 2005 Sep 16. PMID: 16169029.
- Segovia M, Berges JA. INHIBITION OF CASPASE-LIKE ACTIVITIES PREVENTS THE APPEARANCE OF REACTIVE OXYGEN SPECIES AND DARK-INDUCED APOPTOSIS IN THE UNICELLULAR CHLOROPHYTE DUNALIELLA TERTIOLECTA(1). J Phycol. 2009 Oct;45(5):1116-26. doi: 10.1111/j.1529-8817.2009.00733.x. Epub 2009 Sep 28. PMID: 27032357.
- Devasagayam TP, Boloor KK, Ramasarma T. Methods for estimating lipid peroxidation: an analysis of merits and demerits. Indian J Biochem Biophys. 2003 Oct;40(5):300-8. PMID: 22900323.
- Raha S, Robinson BH. Mitochondria, oxygen free radicals, disease and ageing. Trends Biochem Sci. 2000 Oct;25(10):502-8. doi: 10.1016/s0968-0004(00)01674-1. PMID: 11050436.
- Rice-Evans C, Burdon R. Free radical-lipid interactions and their pathological consequences. Prog Lipid Res. 1993;32(1):71-110. doi: 10.1016/0163-7827(93)90006-i. PMID: 8415800.
- Masella R, Di Benedetto R, Varì R, Filesi C, Giovannini C. Novel mechanisms of natural antioxidant compounds in biological systems: involvement of glutathione and glutathione-related enzymes. J Nutr Biochem. 2005 Oct;16(10):577-86. doi: 10.1016/j.jnutbio.2005.05.013. PMID: 16111877.
- Meister A, Anderson ME. Glutathione. Annu Rev Biochem. 1983;52:711-60. doi: 10.1146/annurev.bi.52.070183.003431. PMID: 6137189.
- Beatty PW, Reed DJ. Involvement of the cystathionine pathway in the biosynthesis of glutathione by isolated rat hepatocytes. Arch Biochem Biophys. 1980 Oct 1;204(1):80-7. doi: 10.1016/0003-9861(80)90009-0. PMID: 7425648.
- Briviba K, Klotz LO, Sies H. Defenses against peroxynitrite. Nitric Oxide, Pt C. 1999;301-311.
- Kalyanaraman B, Karoui H, Singh RJ, Felix CC. Detection of thiyl radical adducts formed during hydroxyl radical- and peroxynitrite-mediated oxidation of thiols--a high resolution ESR spin-trapping study at Q-band (35 GHz). Anal Biochem. 1996 Oct 1;241(1):75-81. doi: 10.1006/abio.1996.0380. PMID: 8921168.
- Pompella A, Visvikis A, Paolicchi A, De Tata V, Casini AF. The changing faces of glutathione, a cellular protagonist. Biochem Pharmacol. 2003 Oct 15;66(8):1499-503. doi: 10.1016/s0006-2952(03)00504-5. PMID: 14555227.
- Reiners JJ Jr, Mathieu P, Okafor C, Putt DA, Lash LH. Depletion of cellular glutathione by conditions used for the passaging of adherent cultured cells. Toxicol Lett. 2000 May 19;115(2):153-63. doi: 10.1016/s0378-4274(00)00189-2. PMID: 10802391.
- Wright ME, Mayne ST, Stolzenberg-Solomon RZ, Li Z, Pietinen P, Taylor PR, Virtamo J, Albanes D. Development of a comprehensive dietary antioxidant index and application to lung cancer risk in a cohort of male smokers. Am J Epidemiol. 2004 Jul 1;160(1):68-76. doi: 10.1093/aje/kwh173. PMID: 15229119.
- Chang TN, Huang GJ, Ho YL, Huang SS, Chang HY, Chang YS. Antioxidant and antiproliferative activities of Crossostephium chinensis (L.) Makino. Am J Chin Med. 2009;37(4):797-814. doi: 10.1142/S0192415X09007259. PMID: 19655416.
- Fukuda H, Ebara M, Okuyama M, Sugiura N, Yoshikawa M, Saisho H, Shimizu R, Motoji N, Shigematsu A, Watayo T. Increased metabolizing activities of the tricarboxylic acid cycle and decreased drug metabolism in hepatocellular carcinoma. Carcinogenesis. 2002 Dec;23(12):2019-23. doi: 10.1093/carcin/23.12.2019. PMID: 12507924.
- Kim MJ, Oh SJ, Park SH, Kang HJ, Won MH, Kang TC, Hwang IK, Park JB, Kim JI, Kim J, Lee JY. Hypoxia-induced cell death of HepG2 cells involves a necrotic cell death mediated by calpain. Apoptosis. 2007 Apr;12(4):707-18. doi: 10.1007/s10495-006-0002-3. Epub 2006 Dec 30. PMID: 17195093.
- O’Leary KA, Day AJ, Needs PW, Mellon FA, O’Brien NM, Williamson G. Metabolism of quercetin-7- and quercetin-3-glucuronides by an in vitro hepatic model: the role of human beta-glucuronidase, sulfotransferase, catechol-O-methyltransferase and multi-resistant protein 2 (MRP2) in flavonoid metabolism. Biochem Pharmacol. 2003 Feb 1;65(3):479-91. doi: 10.1016/s0006-2952(02)01510-1. PMID: 12527341.
- van der Woude H, Boersma MG, Vervoort J, Rietjens IM. Identification of 14 quercetin phase II mono- and mixed conjugates and their formation by rat and human phase II in vitro model systems. Chem Res Toxicol. 2004 Nov;17(11):1520-30. doi: 10.1021/tx049826v. PMID: 15540950.
- Lowry OH, Rosebrough NJ, Farr AL, Randall RJ. Protein Measurement with the Folin Phenol Reagent. Journal of Biological Chemistry. 1951;193(1):265-275.
- Alnemri ES, Livingston DJ, Nicholson DW, Salvesen G, Thornberry NA, Wong WW, Yuan J. Human ICE/CED-3 protease nomenclature. Cell. 1996 Oct 18;87(2):171. doi: 10.1016/s0092-8674(00)81334-3. PMID: 8861900.
- Sakuma S, Miyoshi E, Sadatoku N, Fujita J, Negoro M, Arakawa Y, Fujimoto Y. Monochloramine produces reactive oxygen species in liver by converting xanthine dehydrogenase into xanthine oxidase. Toxicol Appl Pharmacol. 2009 Sep 15;239(3):268-72. doi: 10.1016/j.taap.2009.06.006. Epub 2009 Jun 12. PMID: 19527742.
- Lewicki K, Marchand S, Matoub L, Lulek J, Coulon J, Leroy P. Development of a fluorescence-based microtiter plate method for the measurement of glutathione in yeast. Talanta. 2006 Nov 15;70(4):876-82. doi: 10.1016/j.talanta.2006.02.009. Epub 2006 Mar 24. PMID: 18970853.
- Hissin PJ, Hilf R. A fluorometric method for determination of oxidized and reduced glutathione in tissues. Anal Biochem. 1976 Jul;74(1):214-26. doi: 10.1016/0003-2697(76)90326-2. PMID: 962076.
- Sardão VA, Oliveira PJ, Holy J, Oliveira CR, Wallace KB. Vital imaging of H9c2 myoblasts exposed to tert-butylhydroperoxide--characterization of morphological features of cell death. BMC Cell Biol. 2007 Mar 16;8:11. doi: 10.1186/1471-2121-8-11. PMID: 17362523; PMCID: PMC1831770.
- Flora K, Hahn M, Rosen H, Benner K. Milk thistle (Silybum marianum) for the therapy of liver disease. Am J Gastroenterol. 1998 Feb;93(2):139-43. doi: 10.1111/j.1572-0241.1998.00139.x. PMID: 9468229.
- Hashim MJ, Fry JR. Evaluation of Direct and Indirect Antioxidant Properties of Selected Four Natural Chemical Compounds: Quercetin, Epigallocatechin-3-Gallate, Indole-3-Carbinol and Sulforaphane by DPPH Radical Scavenging Assay. J Biomed Res Environ Sci. 2020 Dec 15;1(8):389-392. doi: 10.37871/jbres1170 Article ID: JBRES1170.
- Kanno S, Kurauchi K, Tomizawa A, Yomogida S, Ishikawa M. Albumin modulates docosahexaenoic acid-induced cytotoxicity in human hepatocellular carcinoma cell lines. Toxicol Lett. 2011 Feb 5;200(3):154-61. doi: 10.1016/j.toxlet.2010.11.009. Epub 2010 Nov 23. PMID: 21108996.
- Nagata S. Apoptotic DNA fragmentation. Experimental Cell Research. 2000;256(1):12-18. doi: 10.1006/excr.2000.4834.
- Thornberry NA. Caspases: a decade of death research. Cell Death Differ. 1999 Nov;6(11):1023-7. doi: 10.1038/sj.cdd.4400607. PMID: 10578170.
- Bizat N, Hermel JM, Humbert S, Jacquard C, Créminon C, Escartin C, Saudou F, Krajewski S, Hantraye P, Brouillet E. In vivo calpain/caspase cross-talk during 3-nitropropionic acid-induced striatal degeneration: implication of a calpain-mediated cleavage of active caspase-3. J Biol Chem. 2003 Oct 31;278(44):43245-53. doi: 10.1074/jbc.M305057200. Epub 2003 Aug 12. PMID: 12917435.
- Bizat N, Hermel JM, Boyer F, Jacquard C, Créminon C, Ouary S, Escartin C, Hantraye P, Kajewski S, Brouillet E. Calpain is a major cell death effector in selective striatal degeneration induced in vivo by 3-nitropropionate: implications for Huntington’s disease. J Neurosci. 2003 Jun 15;23(12):5020-30. doi: 10.1523/JNEUROSCI.23-12-05020.2003. Erratum in: J Neurosci. 2003 Oct 29;23(30):9960. PMID: 12832525; PMCID: PMC6741191.
- Blomgren K, Zhu C, Wang X, Karlsson JO, Leverin AL, Bahr BA, Mallard C, Hagberg H. Synergistic activation of caspase-3 by m-calpain after neonatal hypoxia-ischemia: a mechanism of “pathological apoptosis”? J Biol Chem. 2001 Mar 30;276(13):10191-8. doi: 10.1074/jbc.M007807200. Epub 2000 Dec 21. PMID: 11124942.
- Chua BT, Guo K, Li P. Direct cleavage by the calcium-activated protease calpain can lead to inactivation of caspases. J Biol Chem. 2000 Feb 18;275(7):5131-5. doi: 10.1074/jbc.275.7.5131. PMID: 10671558.
- Lankiewicz S, Marc Luetjens C, Truc Bui N, Krohn AJ, Poppe M, Cole GM, Saido TC, Prehn JH. Activation of calpain I converts excitotoxic neuron death into a caspase-independent cell death. J Biol Chem. 2000 Jun 2;275(22):17064-71. doi: 10.1074/jbc.275.22.17064. PMID: 10828077.
- Wolf BB, Goldstein JC, Stennicke HR, Beere H, Amarante-Mendes GP, Salvesen GS, Green DR. Calpain functions in a caspase-independent manner to promote apoptosis-like events during platelet activation. Blood. 1999 Sep 1;94(5):1683-92. PMID: 10477693.
- Maha J Hashim, Jeffrey R Fry. Influence of Extracellular Protein on the Cytoprotectiv Effects of Two Model Phytochemicals. Mol Biol. 2019;8(1). doi: 10.4172/2168 9547.1000227. https://bit.ly/3zHKgqY
- l’Hoste S, Chargui A, Belfodil R, Corcelle E, Duranton C, Rubera I, Poujeol C, Mograbi B, Tauc M, Poujeol P. CFTR mediates apoptotic volume decrease and cell death by controlling glutathione efflux and ROS production in cultured mice proximal tubules. Am J Physiol Renal Physiol. 2010 Feb;298(2):F435-53. doi: 10.1152/ajprenal.00286.2009. Epub 2009 Nov 11. PMID: 19906953.
- Wallin B, Rosengren B, Shertzer HG, Camejo G. Lipoprotein oxidation and measurement of thiobarbituric acid reacting substances formation in a single microtiter plate: its use for evaluation of antioxidants. Anal Biochem. 1993 Jan;208(1):10-5. doi: 10.1006/abio.1993.1002. PMID: 8434778.
Content Alerts
SignUp to our
Content alerts.
 This work is licensed under a Creative Commons Attribution 4.0 International License.


