> Medicine Group. 2021 Mar 11;2(3):139-168. doi: 10.37871/jbres1204.
A Hundred-Year Researching History on the Low Ionic Strength in Red Blood Cells: Literature Review
Fuhrmann GF* and Netter KJ
Abstract
This review article provides a critical survey of work from 1904 to 2003 on the effects of low ionic strength in Red Blood Cells (RBCs) incubated in media with impermeable sugars such as sucrose. In 1904 Gürber A washed RBCs of different species with isotonic sucrose solution to eliminate the outside ions in order to better analyse their intracellular ionic composition; however, this approach was not feasible because of a substantial salt efflux from the cells.
A prominent feature of the salt loss is the shrinking of the RBCs. A central role in the understanding of the ionic movements is thereby the new Donnan equilibrium of the anions. Experimental evidence has been given by Jacobs MH and Parpart AK in 1933. In the sucrose medium two phases could be predicted: 1) a very rapid anionic shift resulting in an unequal distribution of chloride and hydroxyl anions on both sides of the membrane and 2) a leakage of salts from the RBCs.
In 1940 Wilbrandt W assumed that a positive membrane potential is in line with the salt loss at low ionic strength in RBCs.
In 1977 Knauf PA, Fuhrmann GF, Rothstein S and Rothstein A observed in RBCs an inhibition of both, anion exchange and also of net anion efflux, by incubation with disulfonic stilbene derivates. At low ionic strength the Donnan equilibrium is immediately obtained by the Anion Exchanger Protein (AEP). The resulting positive membrane potential opens at least two new types of cation pores or channels. Thereby is the conductivity pathway for the anions, namely the AEP, in charge of the net anion loss at low ionic strength. The AEP pathway is extensively blocked by disulfonic stilbene compounds. The permeability ways for cations through these pores or channels are not yet explored.
Differences in Red Cell Species by Sucrose Treatment
It seemed such a simple idea of August Gürber [1] to use an isotonic sucrose solution, to wash RBCs free of their adhering serum with ions and to analyse thereafter the cells for their salt content. Sucrose is a disaccharide consisting of two sugars, a glucose and fructose residue, connected by a α-glycosidic linkage. This molecule is not taken up by any of the red blood cell species. Washing of the red blood cells in isotonic sucrose solution was performed with the help of a centrifuge with about 2500 rpm, driven by water pressure. The following RBCs from: Cattle or ox, mutton, pig, rabbit, dog, cat and horse were examined. After the first centrifugation the serum on top was discarded and the cells washed again and again up to 34 times with two or three volumes of isotonic sucrose solution. RBCs were weighted every time and after the third centrifugation the washing solution without the cells was examined for serum, chloride, sodium and potassium.
The result of washing RBCs in sucrose solution was quite unexpected. Instead of receiving after a few washes a serum and ion free washing solution, the sucrose solution contained besides chloride also the positively charged cations sodium and potassium. There is, however, no net loss of chloride in isotonic solutions because anions are restrained by electrical forces, if cations do not accompany them. The appearance of cations was completely against the predominant opinion at that time, that RBCs are only permeable to exchangeable anions and not to cations, which were here obviously lost as cations accompanied by anions from those cells during sucrose washing.
On hand of the behaviour of the different RBCs during the washing procedure three types of cells could be differentiated: Best suited were the RBCs from cattle or ox, mutton, pig and rabbit. After the fifth and sixth centrifugation no serum could be detected anymore in the washing solution, but there was chloride, sodium and potassium, the latter very prominent presented from pig RBCs. The second type contained the RBCs of the dog, which were completely unsuited, because of strong haemolysis already after the first wash. The third type was horse and cat RBCs. Horse RBCs change already by contact with sucrose the colour from pink to dark red and start clotting. In horse RBCs agglutination and shape change with spicules at their surface, giving rise to crenated cells (Stomatocytes) with slow sedimentation rates of those cells, and cloudiness of the washing solution was noticed. By the fifth and sixth centrifugation a tight agglutination of the cells occurred, which could not anymore be dissolved, as with cattle RBCs.
Thus, the simple intention of August Gürber to analyse the salt content of RBCs by washing them with isotonic sucrose solution, could not be realized. The RBCs lost anions and cations during this washing procedure and demonstrated osmotic fragility, agglutination with shape changes and subsequent final haemolysis. Best suited were the RBCs of cattle or ox, but they still showed sodium and potassium loss by semi- quantitative flame analysis.
The effect of the non-permeable non-electrolytes on cation efflux in RBCs proved to be very interesting in future science. With a further physico-chemical analysis Ivor Bang [2] confirmed the loss of electrolytes in sucrose solutions and showed that washing of RBCs increased their resistance against hypotonic media. He explained the dark red colour of ox blood as taken from the vena subclavia by the slaughter and the light red cattle blood as taken from the carotis.
Using Cation Permeable RBCs of the Ox after Treatment with Sucrose as Model Cells for Conductivity Measurements
Rudolf Höber [3] used the washing procedure of cattle or ox RBCs with the isotonic sucrose solution of August Gürber to induce an electrolyte loss. The efflux was measured by conductance change of the red cell suspension. He demonstrated the intactness of the RBC membrane by saponine treatment, which immediately increased the conductivity. Saponines are amphipathic glycosides, which act by complexation with cholesterol of the RBC membranes by forming pores and subsequent haemolysis.
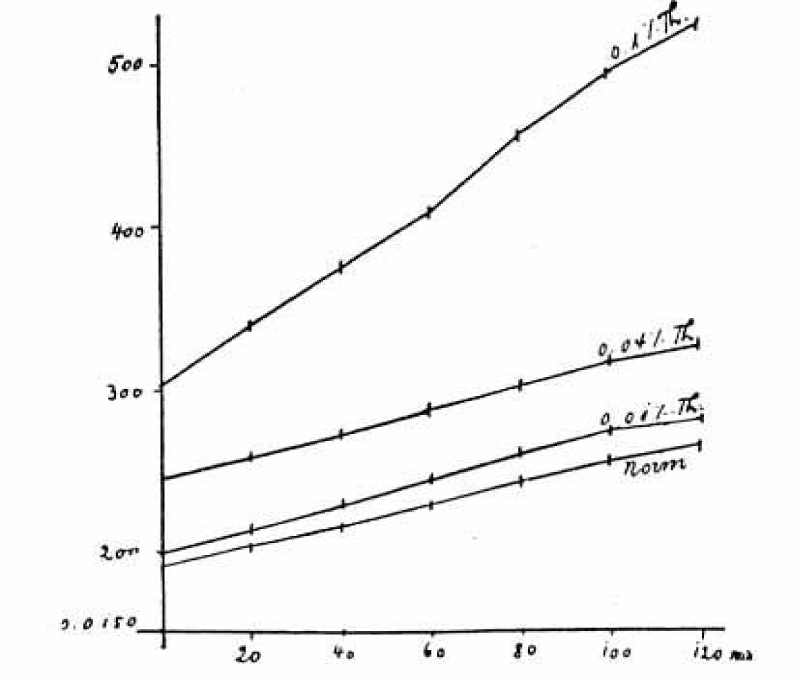
A young scientist Arthur Joel [4] was advised by Rudolf Höber to use the method of August Gürber to produce in cattle or ox RBCs an electrolyte loss by sucrose and test the effects of narcotics. In contrast to intact RBCs, sucrose treated cells (3 times washed with 10% sucrose, 292 mM, on a centrifuge and tested for conductivity by the method of Kohlrausch) produced an increase in conductivity with time, obviously by their loss of electrolytes. In parallel experiments the following narcotics phenylurea, phenylurethane, isobutylurethane, phenylcarbaminic acid, amylalcohol, heptylalcohol, acetophenone, thymol and chloroform added in different concentrations were tested.
At low concentration they inhibited the conductivity change produced by sucrose and stabilized the cells. At high concentration the narcotics increased the conductivity and caused haemolysis. So, the method of conductivity measurement of RBCs confirms salt loss from the cells evoked by sucrose treatment. The change in conductivity was nearly linear with and without narcotics and lasted in some experiments up to 120 minutes (Figure 1). Only at low concentrations of narcotics the inhibition was reversible.
Two Phases of Loss of Osmotic Content in Ox RBCs After Sucrose Exposition
In contrast to Arthur Joel, who used cattle or ox RBCs after pre-treatment with 3 times washing on a centrifuge in 10% sucrose solution for his conductivity measurements, the authors Jacobs MH and Parpart AK [5] investigated RBCs from ox right after mixing of two drops of defibrinated blood in 50 ml hypotonic 200 mM sucrose solution at 20°C to test their osmotic content by measuring their haemolysis in an even more hypotonic sucrose solution of only 125 mM. This method has the advantage that the time for haemolysis of 75% of the RBCs can be measured within seconds by a convenient opacimetric method.
This is absolutely necessary because in the experiments with sucrose already after one second of time a dramatic loss in osmotic content occurred, which could be deduced from the fast prevention of haemolysis in 125 mM sucrose. Within 20 second the change was greater than ever obtained in a day with a hypotonic NaCl solution. This process lasted for about 2 minutes after which a slower loss of osmotic content was following.
The authors asked the important question, if such results would indicate an equally great difference in the rate of escape of salts from the RBs in sucrose solution.
Their answer was that the change, which occurs in RBs exposed to non-electrolyte solutions, consists of two phases: a very rapid ionic shift, whose effect is apparent within a few seconds, and is complete within a minute or two. Following this, usually after a distinct pause, which in the presented experiment amounted to approximately 10 or 15 minutes, a much slower leakage of salts from these cells occurs.
In respect to the slow second change the authors are in agreement with Ivor Bang [2] and with Eric Ponder and George Saslow [6], who reported a salt loss of both anions and cations from RBCs suspended in sucrose solution. However, Jacobs and Parpart had a different explanation for the first and more striking change, which had apparently not previously been recognized as a different phenomenon.
Jacobs MH and Parpart AK considered the newly recognized rapid initial changes as being due to an ionic exchange rather than to a leakage of salts. Its rapidity and its reversibility suggest an ionic exchange modus, while the slower salt loss is not reversible.
The reversibility was shown in an experiment in which ox RBCs at 20°C were exposed to 200 mM sucrose plus 2 mM NaCl. Therefore, the cells were after 3 minutes exposure to 200 mM sucrose placed in 200 mM sucrose plus 2 mM NaCl for varying times and the resulting suspension was suddenly diluted to 125 mM sucrose plus 1 mM NaCl. By the presence of 2 mM NaCl the percentage of haemolysis returned to about its initial high value. In other experiments it was found that CaCl2 is roughly twice as effective as NaCl in reversing the non-electrolyte effect.
For the first fast effect in sucrose the authors proposed an exchange of OH- outside against Cl- inside the RBCs in respect to the Donnan equilibrium [7]. The usual cause is the presence of a different charged substance (For example negative charged haemoglobin) that is unable to pass through the membrane and thus creates an uneven electrical charge.
[Cl]inside / [Cl]outside = [OH]inside / [OH]outside = [H]outside / [H]inside
Donnan equilibrium as above in accordance with the general theory given by Hans Netter [8]. For attainment of the equilibrium condition there must be an exchange of OH- from the external solution for Cl- from the RBCs. Such an exchange leads to an increase of negative charge of haemoglobin and binding of potassium, causing a decreased osmotic pressure within the RBCs.
Jacobs’s MH and Parpart’s AK calculations showed that the expected osmotic effect of such an exchange is in the order of magnitude actually observed. So, the first fast decrease in osmotic content seemed only be related to the OH-/Cl- exchange, while the second slow process was explained by a salt loss.
Cation Loss of Human RBCs in 7% Glucose Solution
Montague Maizels [9] found, that human RBCs are more resistant than the RBCs of other species to changes in their cation content. He used heparinised human blood and centrifuged the blood into sealed graduated and calibrated capillaries. The volume of about 0.1 ml red cells was accurately measured, the supernatant plasma removed and the RBCs suspended for given times in 7 ml of KCl, NaCl or glucose test solution. The suspension was then centrifuged, the new volume of the RBCs estimated and the pH of the supernatant fluid measured. Finally, the potassium in the RBCs was determined as potassium cobaltnitrite. The findings in 53 normal cases were 107 milli-equivalent K+ per litre of RBCs, the lowest value 87 and the highest 119 milli-equivalent K+ per litre of RBCs. This result is well comparable with our flame photometry method of today.
Since cell cation changes very little when RBCs are suspended in electrolyte solution, the effect of suspending 1.4% cells in a 7% glucose (388.5 mM) solution was investigated.
It was found convenient to use a glucose concentration with a slightly higher osmotic pressure than that of normal and it causes some immediate shrinkage. The subsequent permeation of glucose into the RBCs increases their osmotic pressure and causes them to swell, so that after one hour’s suspension in glucose cell volume is 97% of what it was before suspension. In such a solution a considerable loss of RBC potassium occurs and this loss is greatly increased by raising the temperature or prolonging the time of suspension (See Q in table 1).
Table 1: Q is the ratio of K+ present in unit of volume of “original” RBCs resulting from suspension in glucose solution. to that present before suspension. Thus Q = Kf x V/K0. where Kf is the K+ content per litre of suspended RBCs. K0 is the K+ content per litre original RBCs and V is the ratio of the volume after suspension to that before [9] table 5. |
||||||
| 0.1 ml. cells in 7 ml. glucose (7%). Initial pH 6-6. | ||||||
| Temp. °C. | “0” min. Glucose. |
“5” min. Glucose. |
“60” min Glucose. |
|||
| Final external pH | Q | Final external pH | Q | Final external pH | Q | |
| 5 | — | — | — | — | 5.8 | 0.83 |
| 10 | — |
|
— | — | 5.8 | 0.83 |
| 20 | — | — | — | — | 6.4 | 0.73 |
| 24 | 5.6 | 0.93 | 5.8 | 0.90 | 6.4 | 0.58 |
| 31 | 5.6 | 0.91 | 5.8 | 0.88 | 7.8 | 0.33 |
Freshly prepared glucose solution was slightly acidic with a pH of 6.4 to 6.6. If RBCs are centrifuged in such solution after only a few moments of suspension, the supernatant glucose becomes more acid (Second column, final external pH), but if the RBCs and glucose solution are left in contact for one hour, the external supernatant shows a marked increase in pH of 7.8 to 8.0 (See column 6, final external pH). In respect to the mechanism the analysis of K+ and Cl- efflux after 5 minutes glucose incubation is given in the publication, for potassium with 14 milli-equivalent K+ against 12.5 milli-equivalent chloride. From the point of the analysis these differences are hardly significant. After one hour at 31°C suspension in glucose solution practically all RBCs chloride, about 45 milli-equivalent Cl- (And presumably about 13 milli-equivalent of cell HCO3-) has diffused outwards, while some 65 milli-equivalent K+ have been lost.
The K+- loss in glucose solution could greatly be accelerated at 20°C by increasing the initial pH of the glucose solution from 6.6 to 9.4. In contrast the addition of 11 mM NaCl or KCl decreased at 30°C the glucose induced potassium efflux from 110 to 94 K+ milli-equivalent, a decrease of only 14.5%. NaCl is almost as efficient as KCl in preventing cation loss. If RBCs are centrifuged immediately after suspension in pure glucose solution, their volume shrinks to 90% of the original volume in plasma, because the external solution is relatively hypertonic. If the suspension is allowed to stand for one hour, however, some glucose penetrates into the RBCs, carrying water with it, so that the cell volume increases to 95%. If, however, the outflow of potassium is prevented by adding NaCl or KCl to the glucose, RBCs swell to about 132 to 135%. It is interesting to note, that we investigated about 70 years after Maizels M experiments the cation loss in human RBCs with 300 mM glucose at 37°C and attained very similar results [41].
The Effect of Non-Electrolytes on Cation Loss in Different RBC Species
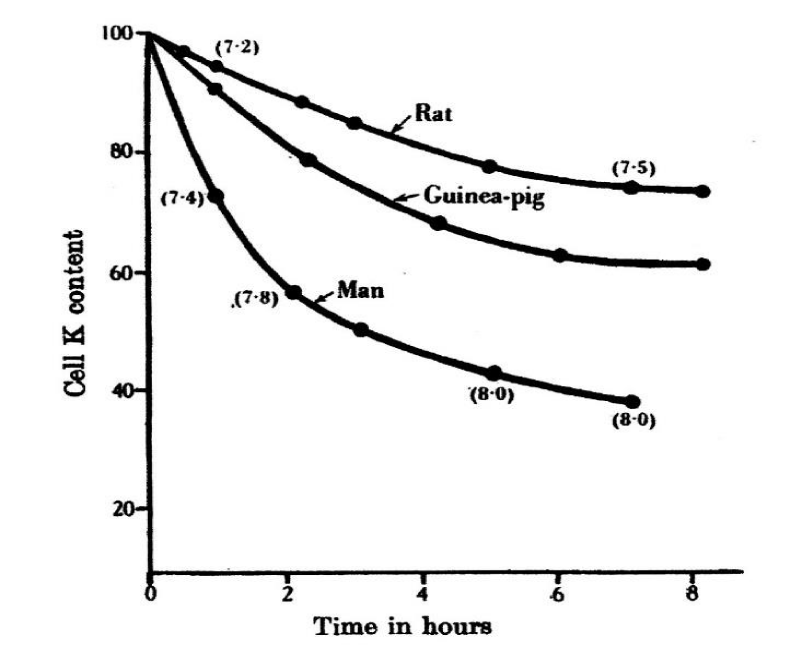
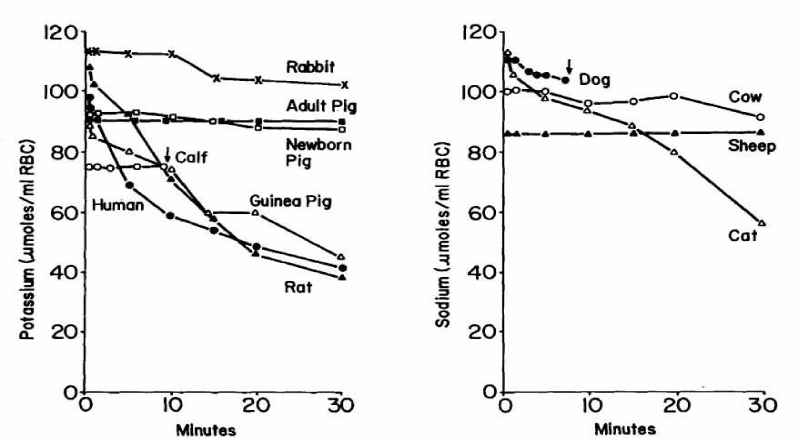
Another study on the permeability of erythrocytes was presented by Hugh Davson [10]. He investigated RBCs of human, guinea-pig, rat, pig, rabbit, ox and cat. The non-electrolyte solution used was 320 mM glucose for all species except human for which 320 mM sucrose was used, since human RBCs are comparatively permeable to glucose. The whole blood was added to the non-electrolyte solution, contained in a centrifuge tube immersed in a thermostat at 25°C; the ratio of volumes to suspension medium was 1:10. Samples were taken every hour by centrifugation, the supernatant fluid removed and the K+ and Na+ content of the RBCs determined chemically. pH changes in the suspension medium were determined colorimetrically.
The results give an overview about expected effects in different species. However, the method of diluting whole blood and not the RBCs without serum by 1:10 is not very precise, because it is not known how much of anions from the serum are still present. Also, the few samplings after one hour every hour does not give information about the kinetics.
Table 2: The variation of the K+ content of the RBCs of different species with time of suspension in a non-electrolyte medium. Temperature 25°C. |
|||||||||||||||
|
Man | Guinea-pig | Rat | Pig | Rabbit | ||||||||||
| Time | I | II | III | I | II | III | I | II | III | I | II | III | I | II | III |
| Control | 100 | 100 | 100 | 100 | 100 | 100 | 100 | 100 | 100 | 100 | 100 | 100 | 100 | 100 | 100 |
| 1 hr. | 74 | 80 | 82 | 84 | 91 | 98 | 95 | 93 | 92 | 99 | — | 99 | 98 | 100 | 101 |
| 2 hr. | 57 | 69 | 69 | 76 | 79 | 94 | 89 | 87 | 86 | 99 | 99 | 99 | 98 | 99 | 100 |
| 3 hr. | 52 | 60 | 59 | 69 | 74 | 93 | 86 | 83 | — | 93 | — | 99 | 98 | 99 | 96 |
| 6 hr. | — | — | — | — | — | — | — | — | — | — | 96 | 98 | — | — | — |
| Table 3: The variation of the K+ and Na+ content of RBCs of the ox and cat with time of suspension in a non-electrolyte medium. Temperature 25°C Hugh Davson [10], please see table 2 and 3 followed by figure 2. | ||||||||||||
| Ox | Cat | |||||||||||
| I | II | III | I | II | III | |||||||
| Time | K | Na | K | Na | K | Na | K | Na | K | Na | K | Na |
| Control | 100 | 100 | 100 | 100 | 100 | 100 | 100 | 100 | 100 | 100 | 100 | 100 |
| 1 hr. | 95 | 98 | 95 | 96 | 100 | 100 | 99 | 98 | 94 | 97 | 95 | 92 |
| 2 hr. | 95 | 98 | 92 | 91 | 97 | 98 | 92 | 85 | 88 | 94 | 87 | 71 |
| 3 hr. | 92 | 95 | 91 | 90 | 93 | 96 | 89 | 66 | 87 | 90 | 78 | 34 |
| 5 hr. | 70 | 77 | — | — | — | — | — | — | — | — | — | — |
It is suspected that from serum chloride of 97 to 108 mM and a haematocrit of 45% by a dilution of 1:10 about 5 to 6 mM chloride is present in such experiments. So only the order of RBC species should be taken with human > guinea-pig > rat > cat > ox > pig and rabbit.
Addition of NaCl or KCl to the sucrose solution decreased the salt losses.
Are the two Phases of Osmotic loss in RBCs by Non-Electrolytes Causally Related?
In 1940 Walther Wilbrandt [11] tried by experiments in human RBCs suspended in isotonic sucrose solution to investigate, whether the first phase of OH-/Cl- exchange, which influences the equilibrium, is the cause for the salt loss in the second phase.
In contrast to Hugh Davson, who took the whole blood for suspension, Walther Wilbrandt centrifugated human blood and used the packed RBCs for his experiments. He diluted 2 ml of those packed cells with 20 ml isotonic sucrose solution and measured continuously the pH change of the unbuffered sucrose solution at 20°C with a glass electrode and for comparison the dilution of the cells in only isotonic NaCl solution. In addition, he tried to measure the pH inside the red cells by saponine haemolysis.
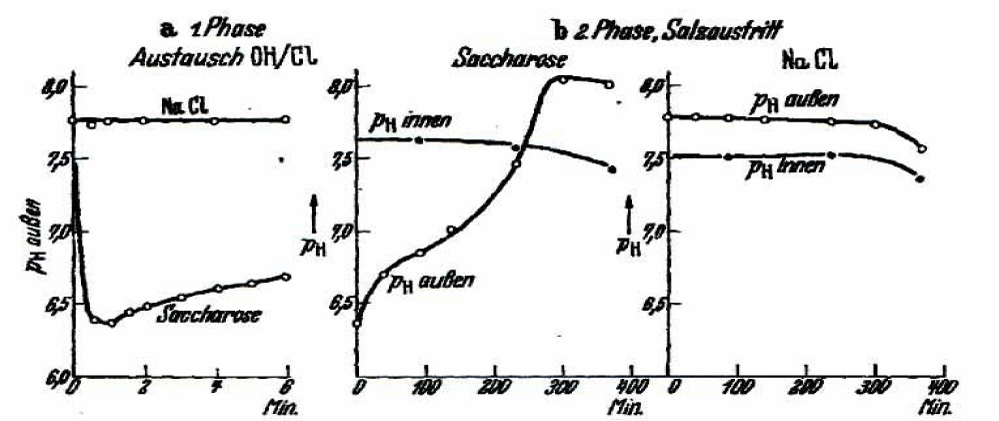
Figure 3a shows a sharp change from above of pH 7.5 in the outside pH of the unbuffered isotonic sucrose solution to less than a pH-value of 6.5, which is most probably the expression of an exchange of OH- ions from the outside against Cl- from the inside of the cells. It can be assumed that the cell interior will become by OH-/Cl- or OH-/HCO3- exchange inside alkaline. This will change the haemoglobin buffer capacity and haemoglobin itself has more negative charges (polyanion) leading to additional potassium binding and reduction of osmotic pressure.
At the other hand the decrease in outside pH will generate from HCO3- a CO2 increase (pK1 = 6.4), which easily penetrates the cell membrane and reducing inside pH by combining reversible to N-terminal amino groups of haemoglobin to form carbamates (Bohr effect, 1904) or with carboanhydrase and H2O, to produce a proton and HCO3-. Wilbrandt has also tried to measure inside pH (Figure 3b). However, his first time point is taken at 100 minutes, which might not be responsible for the 1. phase of OH-/Cl- exchange.
Figure 3b is representative for the salt loss in the 2. phase, the outside pH rises with time in this phase to a pH value above 8, which is very similar to the results described by Maizels M and Davson H. Wilbrandt discussed in addition the possibility of an electrical silent exchange of K+ against H+. Such an exchange would also produce an increase of the pH outside. However, because of the excessive potassium loss such mechanism would result in pH values above 11 to 12 and not of pH8 as shown in figure 3b. Therefore, he excluded an exchange of K+ against H+.
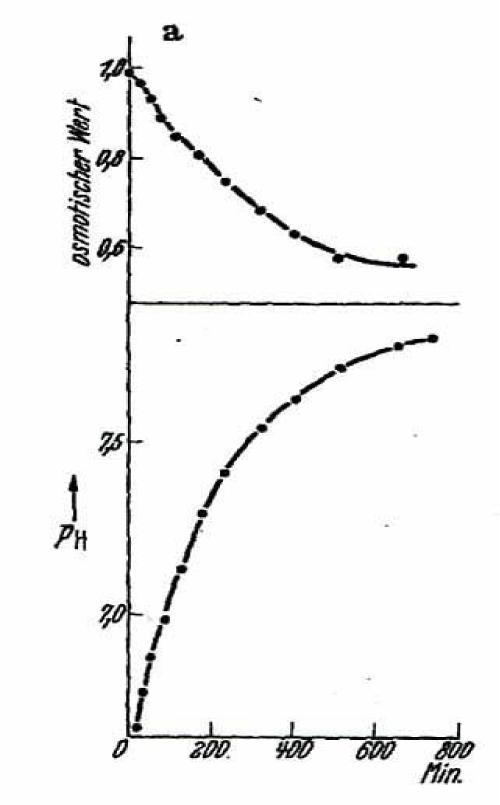
Walther Wilbrandt further demonstrated in the next figure 4, that the pH changes as shown in figure 3b might be connected with the observed osmotic change, which is directly related to the salt loss by an equivalent change in the outside pH.
The two figures show curves with the same profile in time. This has been taken as evidence, that both curves are directly connected. Wilbrandt concluded that the change of pH and the loss of osmotic content in isotonic sucrose have the same causality namely the loss of salt from the RBCs.
Also the reversibility of the sucrose effect was investigated with help of the photoelectrical method. An osmotic resistance curve produced after 30 to 90 seconds of incubation in sucrose was identical with a control in isotonic NaCl solution. Thus, the effect of sucrose seemed to be completely reversible for this short 1. phase. If, however, the time for sucrose incubation was extended to 1-4 hours an increasing left shift of the osmotic resistance curves demonstrated an increase in resistance of the RBCs by an irreversible salt loss in the 2. phase. In addition, a deviation of those resistance curves from the norm could be explained by different cell populations, by which some have lost salts and some less or not at all (All- or non- response).
The last part of Walther Wilbrandt’s experimental work is devoted to the cause of the cation loss in the 2. phase of sucrose treatment. Davson H has already pointed out that the unequal distribution of ions must be followed by a membrane potential, which Wilbrandt calculated according to the pH change at begin in figure 3 and 4 to about +70 to +80 mV. He demonstrated in two following experiments, that a change in equilibrium influences the velocity of the salt loss. By an increased dilution of the packed RBCs in sucrose solution he reduced the outside salt content. The result was an increase in salt loss and a decrease of the pH-minimum. The decrease in salt loss was in accordance with Davson’s H experiments, who added NaCl to the sucrose solution.
The second kind of experiments were done with hypertonic and hypotonic sucrose solution. The equilibrium inside the cells will be changed by shrinking of the RBCs in hypertonic sucrose solution with an increase of chloride and by hypotonic sucrose with swelling of the volume and a decrease of chloride concentration. The result was an increase in salt loss in hypertonic and a decrease in salt loss in hypotonic sucrose. The pH-minimum in the sucrose solution was lowest in hypertonic, for example in 1.6 isotonic sucrose a pH of 6.4 and for hypotonic sucrose of 0.6 isotonic units a pH-minimum of 6.75 was measured. So, the dependence of inside chloride concentration on the salt loss in sucrose was demonstrated. Wilbrandt pointed out that the driving force acting on the cation was not only its concentration gradient, but also the electrical gradient contributed by the anion equilibrium.
The last part was devoted to the relationship between the above results and the proposed change of anion in elective cation permeability in pig and ox RBCs by Rudolf Mond [13] in 1927.
Wilbrandt’s Criticism about the Experiments of Rudolf Mond on the Reversion of Anion in Cation Permeability in RBCs
Rudolf Mond [13] proposed very enthusiastically that the question about the cause of elective ion permeability has been solved, since the famous experiments of Leonor Michaelis [14] in artificially charged collodium membranes.
Rudolf Mond postulated that the presence of fixed charges in water filled channels of RBC membranes might account for the ion selectivity. Positive fixed charges would allow anions to pass through the channel but would exclude cations because of electrostatic repulsion.
Mond used defibrinated blood from pig or ox, centrifuged the blood once, eliminated the serum and took 5 ml of packed RBCs for his experiments. To change the pH in the suspension he added 1 N = 1M NaOH solution. The difficulty was to prevent haemolysis of the RBCs by this strongly alkaline salt solution. Therefore, he stabilized the RBCs by suspension in 7 ml isotonic sucrose solution (10.5 % = 306.7 mM) before the addition of NaOH.
This mixture with a dilution of the packed RBCs by only 1: 2.4 would be expected to have already a high outside NaCl concentration from the contamination by remaining serum. After 25 minutes of incubation of RBCs in this mixture, probably at room temperature, the suspension was centrifugated with 6000 rpm, and RBCs and medium were analysed. The next table 4 gives the results of such an experiment. Since pig RBCs at physiological pH according to Hugh Davson do not loose salts in one hour, thus the inside concentration of chloride without NaOH is 52.6 mM (186.5 mg%) and the outside concentration 8.9 mM chloride (31.4 mg%), representing the initial conditions without NaOH treatment in the first row of the table 4.
| Table 4: The composition of the mixture of 5 ml packed pig RBCs with 10.5% sucrose solution and 1N-NaOH. Analysis of the volume of RBCs was done after 25 minutes of incubation by centrifugation at 6000 rpm in calibrated haematocrit tubes and determination of Chloride Inside (Cl-i) and outside (Cl-o) the RBCs and potassium in mg in the outside solution [13] table 1. | ||||||||
| Mixture of pig RBCs | Results after 25 minutes incubation | |||||||
| pig RBCs | sucrose | NaOH = 1 M | Volume ml | mg% Cl-i | mg% Cl-o | Cl-i/Cl-o | K+o mg | pH |
| 5 ml | 7.00 ml | 0.00 ml | 4.08 = 81.6 % | 186.5 | 31.4 | 5.940 | 0.28 | 6.92 |
| 5 ml | 6.90 ml | 0.10 ml | 3.80 = 76.0 % | 113.0 | 70.8 | 1.600 | 0.29 | 7.51 |
| 5 ml | 6.85 ml | 0.15 ml | 3.70 = 74.0 % | 96.0 | 79.0 | 1.210 | 0.29 | 7.72 |
| 5 ml | 6.80 ml | 0.20 ml | 3.60 = 72.0 % | 52.0 | 98.0 | 0.520 | 0.32 | 7.99 |
| 5 ml | 6.75 ml | 0.25 ml | 3.53 = 70.6 % | 25.7 | 108.0 | 0.238 | 0.72 | 8.7 |
| 5 ml | 6.70 ml | 0.30 ml | 3.45 = 69.0 % | 25.1 | 107.5 | 0.234 | 1.21 | 9.3 |
| 5 ml | 6.60 ml | 0.40 ml | 3.47 = 69.4 % | 25.8 | 107.3 | 0.240 | 4.26 | 10.1 |
From these results the conclusion was drawn, that RBCs change with increasing pH their permeability from selective anion exchangeable (Row 2 to 4) to selective cation exchangeable (Row 5 to 8). Rudolf Mond further suggested that fixed charge groups of basic membrane proteins might be responsible for this change with an isolelectric point between pH 8 and 8.3, so that at pH values below the isoelectric point only anions pass the positively charged pores and above the isoelectric point negatively charged pores facilitate an exchange of cations. This result should be considered as an analogy to the mechanism proposed by Leonor Michelis in artificial collodium membranes.
Walther Wilbrandt [11] had some doubt about the above conclusions of Rudolf Mond. He cited the work of Hugh Davson and James Frederic Danielli [15], who repeated the experiments of Rudolf Mond without success; however, alkalization was done with buffered salt solutions without sucrose. From this it seemed that the use of the non-electrolyte sucrose is very important and might be the cause of the K+ loss.
Rudolf Mond used in his experiments shown in table 4 RBCs from the pig. Hugh Davson [10] measured in pig RBCs continuously for 5 to 6 hours at 25°C incubation in 320 mM glucose as non-electrolyte a negligible loss of cations. These RBCs are not very sensitive to non-electrolyte treatment. Walther Wilbrandt [11] showed in his experiments with human RBCs that by changing to alkaline pH the Donnan equilibrium for OH- and Cl- anions is drastically changed, leading to a considerably increased osmotic loss of salts in isotonic sucrose solution. These results are in agreement with Hugh Davson [10], who also demonstrated that the loss of potassium in human RBCs is increased in alkaline solution. The 25 minutes of incubation in sucrose solution in Rudolf Mond’s experiments [13] at different alkaline pH values result in experimental data, which are not directly comparable, because there is only one time point obtained at very different equilibrium conditions. In his experiments Rudolf Mond discussed an exchange of Cl- with OH- anions by the high concentration of added NaOH of 14.3 to 28.6 mM below pH 8, the isoelectric point for the pore proteins. Above pH 8 by addition of 35.7 to 57.1 mM NaOH he postulated a passive cation exchange of K+ against Na+, which to our present knowledge does not exist.
It is not surprising, that in view of the unusual treatment of RBCs with 1 M NaOH the survival of RBCs is threatened, which would drastically change pH, ion content, osmolality and cause membrane damage. Therefore, the results of Rudolf Mond remain difficult to interpret.
Discovery of the Na+ - K+ ATPase in Human RBCs
The human RBC has a high concentration of about 150 mM K+ in cell water against 4.5 mM in serum and about 10 mM Na+ in cell water against 145 mM Na+ in serum. These ionic gradients are generated by a specific transport system, the Na+ - K+ ATPase, discovered by Jens Skou in 1957 from the shore crab [16] and 3 years later found by Post RL, et al. [17] in the human RBC.
The accuracy of measuring fluxes of Na+ and K+ was greatly increased by using the radioactive isotopes 24Na and 42K [18]. Three Na+ out and two K+ in the human RBC are transported per ATP hydrolysed, which shows that the ATPase is working electrogenic.
These results clearly demonstrate that the RBC is not at all selectively permeable for anions. However, the chloride permeability is about 2 million-fold higher than the corresponding permeability for sodium and potassium (4 x 10⁻⁴ cm/sec against 2 x 10⁻¹⁰ cm/sec) [19].
The Role of the Potential across the RBC Membrane in a Medium of Low Ionic Strength
In 1960 Walther Wilbrandt and Hans Jörg Schatzmann [20] asked the important question, whether the cation loss in low electrolyte media yielded results that can be interpreted as due to a change in ion permeability with membrane polarization qualitatively similar to that in excitable cells. RBCs are by many orders of magnitude more permeable to anions than to cations. Since the distribution of anions at low ionic strength follows very quickly the Donnan equilibrium, a large potential difference from mainly an exchange of Cl- for OH- results in acidification of the medium. The magnitude of the potential E (In mV) can be calculated from the Nernst equation:
E = RT/F ln Clo/Cli
using the chloride concentration outside Clo and inside Cli of the membrane.
Defibrinated fresh or cold stored human blood was 2 to 3 times washed with saline or a mixture of saline (165 mM) and isotonic sucrose solutions (10.2 % = 298 mM), and centrifugated.
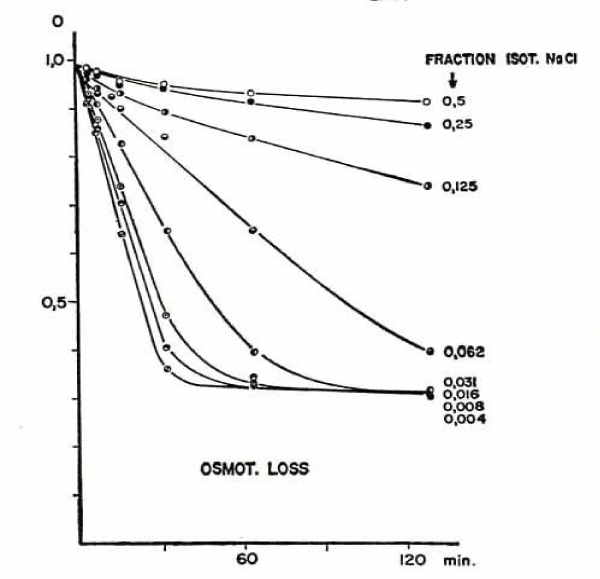
The rate of osmotic loss in isotonic low electrolyte media varies systematically with the concentration ratio electrolyte vs. non-electrolyte as shown in figure 6.
Fraction of isotonic NaCl are: 0.5 = 82.5 mM, 0.25 = 41.3 mM, 0.125 = 20.6 mM, 0.062 = 10.2 mM, 0.031 = 5.1 mM, 0.016 = 2.6 mM, 0.008 = 1.3 mM, 0.004 = 0.7 mM chloride. The equilibrium reached in the sucrose medium with the lowest NaCl concentration from 0.7 to 5.1 mM NaCl is practically independent of the electrolyte concentration. Its numerical value of about 0.3, which is the fractional amount of remaining osmotically active material in the cell mainly haemoglobin and agrees with the expectation for the Donnan equilibrium in cation permeable RBCs.
A comparison of the osmotic with the potassium loss yields closely related values, demonstrating that the osmotic changes can be used safely as an approximate measure for changes in the ion content of the RBCs.
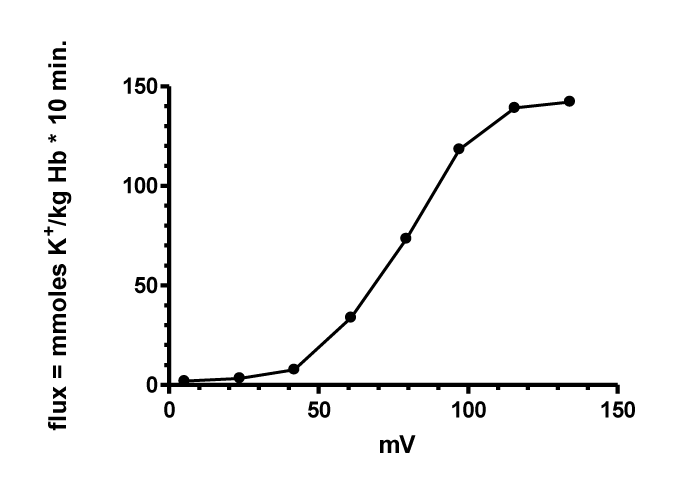
By recalculation of the cation fluxes from figure 6 in mmoles K+/kg haemoglobin per 10 minutes by one exponential decay model and determination of the potential by the Nernst equation with Cli = 100 mM (Instead of 50 mM as given by Ponder 1948 a more realistic value of 100 mM given by Robert G Gun and Otto Fröhlich [21] figure 7 was reconstructed.
The dependence of the rate of cation loss and the outside concentration of Cl- are in the right direction for an action of a positive membrane potential either as driving force or on the membrane permeability. However, the rate of cation loss is at high potential (> + 100 mV) and at low potential (< + 50 mV) not directly proportional to the membrane potential. This is expected from the method of flux measurements at high RBCs of 5% by changing continuously the outside concentration from chloride efflux in addition to 0.7 or 1.3 mM chloride by about 5 mM chloride and at the high chloride concentration changing the rate of permeable RBCs.
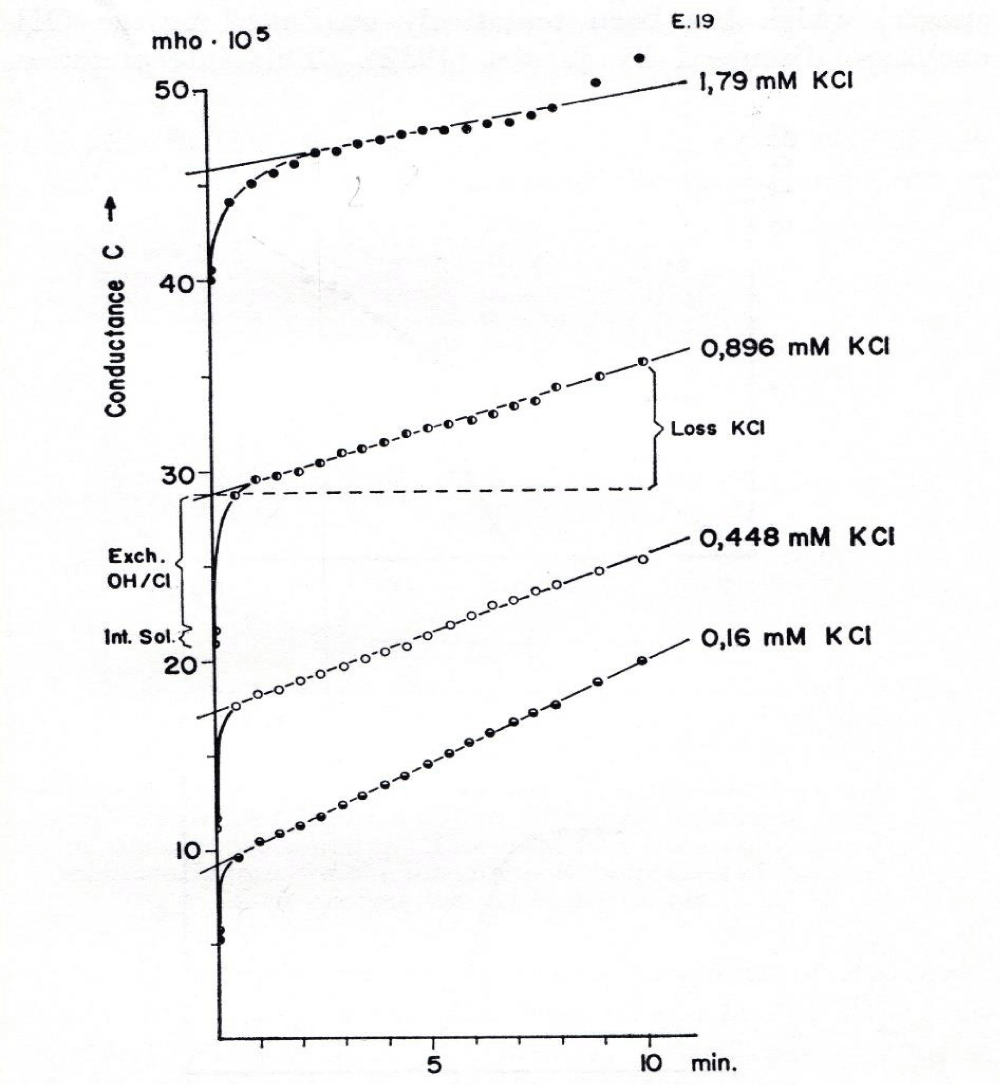
In addition to cation determination by the osmotic methods or flame photometry Wilbrandt and Schatzmann measured the changes in cation permeability with the more sensitive conductivity method. For the conductivity measurements a Philips conductometer was used and the cells were washed with a mixture of 9 volumes isotonic sucrose (298 mM) and 1 volume isotonic KCl solution (165 mM). This method is in advantage in the range of very low electrolyte concentrations, which result in higher potentials and enable an immediate and continuous measurement of cation loss by the electric signal. In general 2% of centrifugated RBCs were suspended in various mixtures of isotonic sucrose and isotonic KCl solutions to give the KCl concentrations indicated in figure 8.
It is marked at the curve with 0.896 mM KCl that the rise of conductivity with time after the addition of human RBCs into sucrose medium consists of three components. The first relatively small component stems from the trapped fluid introduced with the RBCs (Int. Sol).
The second component shows a steep rise within seconds, which has been tentatively attributed to the OH-/Cl- exchange as discussed by Jacobs and Parpart [5], but the conductivity change here is undoubtedly due to electrolyte loss. The second process clearly increases in time with the increase in KCl concentration in the sucrose medium. At the highest concentration of 1.79 mM KCl the curve takes about 2 to 3 minutes to reach finally the third component, the linear slope.
This third linear component was analysed for the relationship between potential and electrolyte loss over a time period of ten minutes. The rate of change in conductivity per minute was in addition plotted against the membrane potential and gave a similar result as shown in figure 7.
Further, urethane, low concentration of cocaine and calcium chloride decreases the induced cation permeability. K+ and Na+ efflux is approximately equal.
Efflux of Salt from Human RBCs Suspended in Isotonic Sucrose Plus Low Concentration of Salt Measured under Steady State Conditions
In 1968 Paul L LaCelle and Aser Rothstein [22] used a new technique to measure under “steady state” conditions the salt loss from human RBCs suspended in isotonic sucrose plus a range of very low to high salt concentrations. In their previous experiments, especially at high RBC haematocrit, the outside concentration changes continuously by the salt loss from the cells. For example, a 10% cell suspension with about 100 mM K+ per litre cells with 1 mM KCl in the outside sucrose solution changes from begin of the experiment until to the end continuously the concentration from 1 to 11 mM K+ plus an equivalent of anion, mainly Cl-. There are two possibilities to overcome this situation. The first would be to use a high dilution of the RBCs as for example Jacobs and Parpart [5] used with two drops about 100µl of ox RBCs in 50 ml suspension, so that the contribution of electrolyte outflow becomes negligible at the used outside concentration. The second would be to use initial rates as also Jacobs and Parpart [5] by haemolysis technique and Wilbrandt and Schatzmann [20] in their conductivity measurements performed.
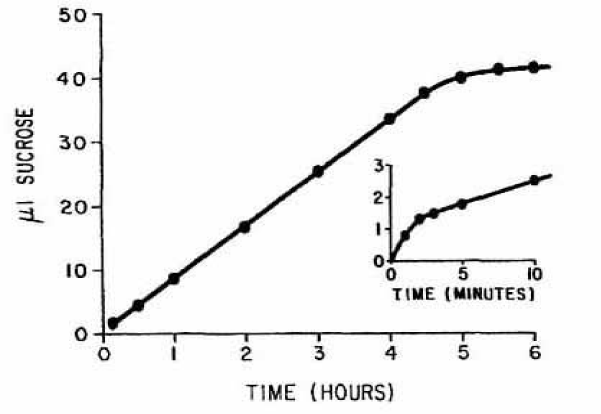
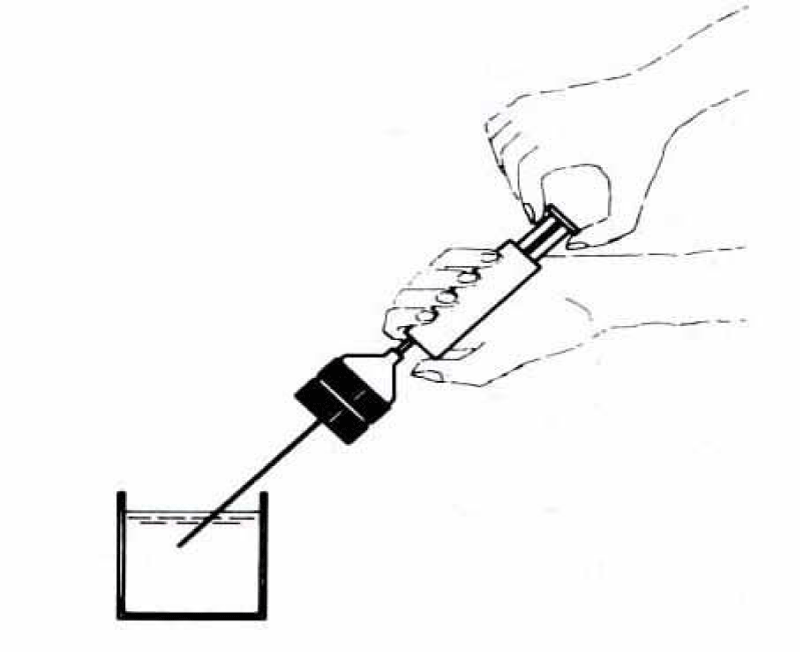
A new method has been introduced by the above authors in using automatic titration by a Radiometer Autotitrator-Titrigraph. The salt-statting device consisted of a conductivity meter as a sensing device, coupled to a titrigraph with a syringe drive for adding required amounts of sucrose solution. The device kept the chosen outside concentration during the experiment at a constant level (“Steady state”) and the rate of addition of sucrose, recorded automatically, is directly proportional to the rate of salt leakage. The desired concentration of salt was estimated from the conductivity of the suspension using a calibration curve of known salt solution in isotonic sucrose and was checked directly by flame photometry.
Human RBCs from normal adults, collected in ACD (Acid-citrate-dextrose) and stored 5 to 30 days at 4°C, were used in most experiments, but fresh RBCs, collected in heparin or EDTA, deprived of glucose (12 hr incubation at 37°C) produced similar results. Before use the RBCs were separated from plasma, washed in Na-TRIS buffer at pH 7.4 to remove plasma protein, and then washed twice in 0.95% NaCl. At start of an experiment, isotonic sucrose with salt was added to packed cells, usually 2%, which were kept in suspension and aerated by stirring with a siliconized glass rod. A typical experiment is shown in figure 9.
In the first minute a readjustment of pH was observed (Inserted figure), representing the Cl--OH- shift noted by Jacobs and Parpart [5] and studied in detail by Wilbrandt [11]. In the second phase the loss of salt proceeded at a virtually constant rate until about 25 to 30% of the total salt content of the RBCs remained. Thereafter the rate diminished gradually and finally ceased. All following measurements of rates reported in the above paper were within the second linear phase of the curve excluding the first immediate equilibrium period, the usual observation period being 10 to 30 minutes with a salt efflux of less than 10%.
With no control exerted upon the pH, the initial value of the suspension averaged pH 6.8 with an extreme range of 6.5 and 7.0 and with only small changes (0.1 pH unit) during the course of a 10 to 30 min. experiment. In many experiments the pH was also maintained at a constant level by a second statting device. The pH was sensed by a glass electrode and the acid produced was compensated by addition of isotonic sucrose plus NaOH solution at the same conductivity level as in the RBC suspension so that the pH-stat did not disturb the conductivity-stat.
Human RBCs suspended in a medium in which most of the electrolyte is replaced by an osmotically equivalent concentration of the non-penetrating non-electrolyte sucrose, large outward concentration gradients are imposed on the anions and cations. Water, however, is initially in equilibrium. As the experiment proceeds, water as well as the salt is lost by the RBCs, with the rate of water outflow such that the cells lose isotonic salt solution and shrink in volume. They therefore remain in osmotic equilibrium throughout the course of such an experiment. However, the leakage of the salt is not dependent on the movement of water. No change in the rate of salt outflow occurs, if net water flow is prevented by a continuous addition of a penetrating non-electrolyte such as glycerol.
The driving force acting on cations remains relatively constant during the experiment because the external salt concentration is regulated by the statting device and the internal salt concentration stays constant by isotonic salt leakage and by shrinking of the RBCs. So, the chemical gradient is the concentration between 150 mM salt concentration inside and the salt concentration in the outside medium. The electrical gradient is more complicated, but can be estimated from the Nernst equation: E = RT/F log Cl-outside/Cl-inside. Cl- at the outside is known, but Cl- inside depends in addition to Cl- inside on the concentration of anionic groups in haemoglobin, which in turn depends on the cellular pH and on the haemoglobin dissociation curve assuming that the total cellular anion is free of bicarbonate. By using the titration curve of haemoglobin of Harries EJ and Maizels M [23], the ratio Cl-outside/Cl-inside has been calculated for RBCs suspended in low electrolyte media of known pH. The observed ratios were almost the same as those predicted from the Donnan equilibrium (Jacobs and Parpart, Wilbrandt).
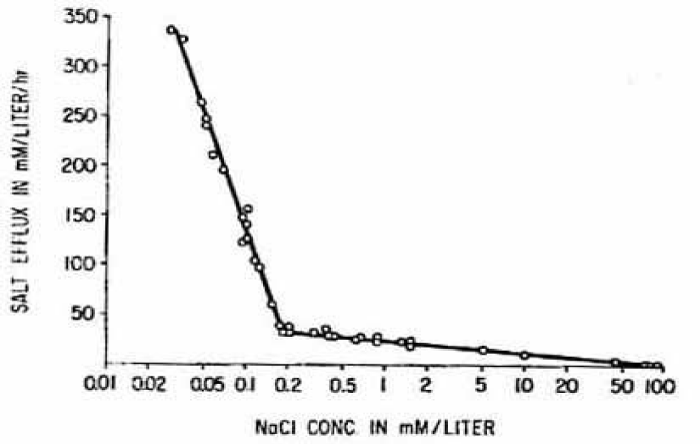
It is genial to plot the logarithm of the outside chloride concentration against the flux in order to demonstrate a dependence of the cation flux on the Nernst potential. Since RT/F is a constant factor at 23 °C of 58.8 mV and since the concentration of isotonic NaCl washed RBCs should be about 100 mM chloride inside the cell as a constant divider of the outside chloride concentration according to Jerome Donlon [24]. If this is the case, figure 10 shows 2 precise linear regions from 0.028 mM chloride (NaCl) to 30 mM chloride. The first steep linear slope is from 0.028 mM to about 0.18 mM and the second slow linear slope from 0.18 to 30 mM chloride. Thus, a linear dependence on potential as driving force exists between + 209 to + 161mV and + 161 to + 31mV. This could mean that one channel type changes permeability with potential or two channel types may exist.
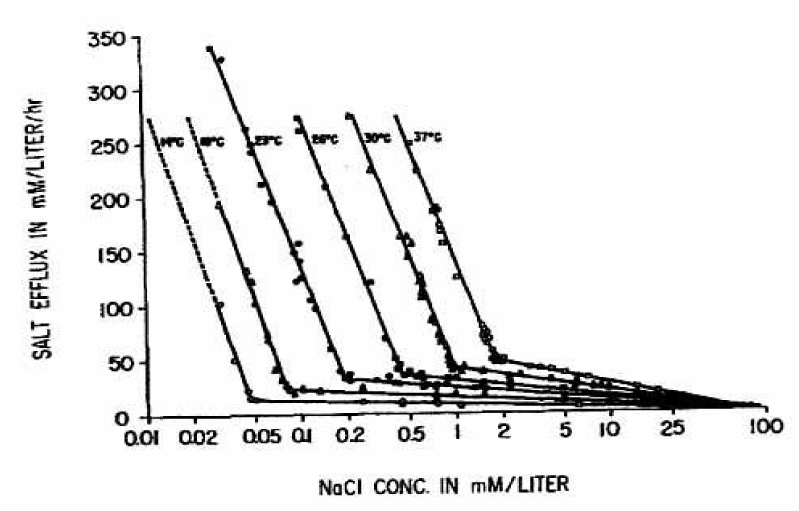
Figure 11 very impressively demonstrates the dependence of the cation fluxes from the Nernst equation even at different temperatures. Again, two straight lines with a sharp inflection point are found at each temperature from 14° to 37°C. It is very interesting to note, that the first steep slopes are not significantly changed with temperature. However, the second slow slopes increase as the temperature is raised and the inflection points are shifted to higher NaCl concentrations and to higher salt efflux values.
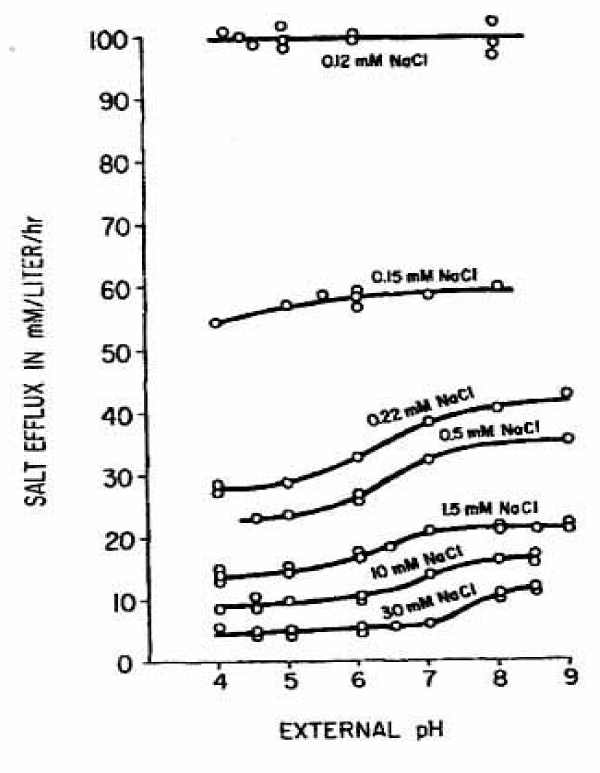
Figure 12 summarizes the effects of pH on cation efflux. These effects are rather complex. In the region of the steep slope the rate of leakage is between pH 4 to pH 9 nearly independent of the pH investigated. Only in the region of the low slope the leakage is increased at higher pH values. At higher salt concentrations the effect of pH is proportionately higher and it tends to occur at higher pH values. The leakage rate can be raised, for example, at 30 mM from 5 to 12 mmoles cations/ litre cells per hour (Factor 2.41) at midpoint of the effect at pH 7.5, whereas at 0.22 mM an increase from 28 to 42 mmoles cation/litre cells per hour (Factor 1.5) at the midpoint of the effect at pH 6.3 was measured.
In summary the first steep slope at high potentials is nearly independent in steepness of temperature between 14° and 37 °C and behaves also independent to pH changes between pH 4 and pH 9. In contrast the second low slope at lower potentials increases as the temperature is raised and the inflection points are shifted to the right and upward. It is dependent on pH changes between pH 4 and pH 9. In general the salt efflux is increased at higher pH values. At higher salt concentrations the effect of pH is proportionately higher and it tends to occur at higher pH values.
The Passive Cation Efflux from Human RBCs under Different Driving Forces and Tonicities
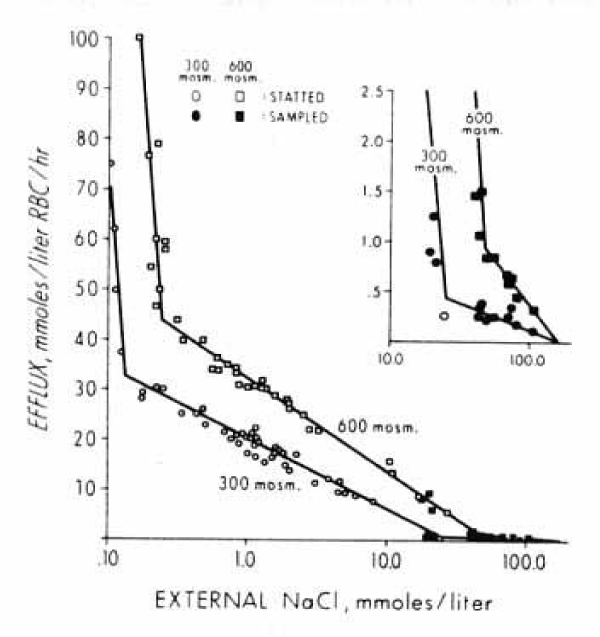
The previous experiments by Paul LaCelle and Aser Rothstein [22] were extended to higher outside concentrations of NaCl. In addition to the statting method at NaCl concentrations below 20 mM the corresponding cation efflux was measured under non-steady state conditions by periodic sampling. In addition to 300 mM sucrose the tonicity was increased to 400, 500 and 600 mM sucrose plus different salt concentrations. Measurements of chloride (Cl36) distribution, of osmotic response and a titration of RBC haemolysate were necessary to obtain the parameters used in calculation of the electrochemical driving force to finally try to apply the Goldman equation [24,25].
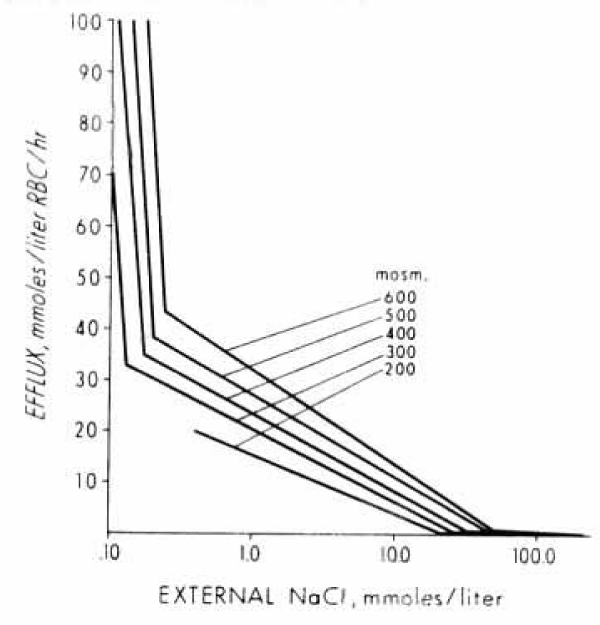
A main result was the finding of an additional inflection point in the intermediate salt range of 25 to 50 mM figure 13.
The inflection point at the low salt concentration of about 0.2 mM agreed with that observed by LaCelle and Rothstein, while the inflection point in the high salt range of 25 to 50 mM was a new result. These inflection points were determined by the membrane potentials of about +170 and +45 mV. The measured permeabilities for each region are: 0,435 x 10-10, 7.8 x 10⁻¹⁰ and 78.0 x 10⁻¹⁰ cm/sec.
The data in figures 13 and 14 demonstrate a wide range of external salt concentrations from 0.1 to 100 mM and of effluxes from 0.5 to 100 mmoles salt or cations /litre of human RBCs per hour at 23°C (Converted: 0.025 to 5 mmoles salt or cations/kg haemoglobin per minute). In figure 15 the experimental data points have been omitted for clarity. In each Figure, the data points are given in a semi-logarithmic plot. They can be fitted by three straight-line segments with two inflection points. With increasing osmolarities (mOsm Sucrose) the patterns are not changed, but the inflection points are moved towards higher effluxes (x-axis) and toward higher salt (y-axis) concentrations. The efflux values at the low NaCl concentrations are quite high in rate. The method of conductivity statting is very reproducible, so are the lines. The data points for the lines to the right at high salt concentrations are less accurate by sampling for flame photometry. The difference in slope is, however, about 30 fold, so that the inflection points at 10 to 30 mM can also be accurately determined.
Jerome Donlon determined for the calculations of the electrochemical driving forces also the chloride distribution by radioactive Cl36 inside and outside of the cells. He demonstrated that a Donnan equilibrium of anions existed in human RBCs suspended in sucrose media. In this respect it was also necessary to determine the dissociation curve of haemoglobin.
Titration of a cell haemolysate was performed at 1 and 3.7 mM haemoglobin solutions with an isoelectric point normalized to pH 6.9. The slope of the titration curves was nearly linear between pH 6.0 to pH 8.0 and independent of the ionic strength between 0.05 and 0.4. The addition of the carboanhydrase inhibitor acetazolamide had no effect. By taking 5 mM haemoglobin per litre packed RBCs as average content of red cells the buffering capacity β was 58 and 62 meq/litre red blood cells pro pH unit. These values are in agreement with the buffering capacity β of 54 meq/litre RBCs determined by Harris EJ and Maizels M [23] and an isoelectric point of pH 6.85.
| Table 5: Estimation of the chloride ratio r (Donnan equilibrium) by determination of 36Cl distribution and the potential calculated at 4 outside concentrations of 5. 10. 20 and 50 mM chloride in 300. 400. 500 and 600 mM sucrose solutions. The estimation has been made that electroneutrality exists inside the RBC. and that chloride is the major internal anion Jerry Donlon [25] table 1. | |||||
| Osmolarity-salt (mOsm-mM) | From chloride distribution |
From assumptions | Ratioa | ||
| Donnan ratio | potential (mV) | Donnan ratio | potential (mV) | ||
| 300-5 | 18.6 | 74.9 | 24.6 | 82.0 | 0.91 |
| 400-5 | 27.3 | 84.7 | 31.6 | 88.5 | 0.96 |
| 500-5 | 36.6 | 92.2 | 38.0 | 93.2 | 0.99 |
| 600-5 | 47.1 | 98.7 | 46.0 | 98.0 | 1.01 |
| 300-10 | 11.7 | 63.1 | 12.2 | 64.0 | 0.99 |
| 400-10 | 15.1 | 69.5 | 15.4 | 70.0 | 0.99 |
| 500-10 | 20.2 | 77.0 | 18.8 | 75.2 | 1.02 |
| 600-10 | 24.8 | 82.3 | 22.8 | 80.0 | 1.03 |
| 300-20 | 7.4 | 51.2 | 6.7 | 49.0 | 1.05 |
| 400-20 | 11.3 | 62.1 | 8.7 | 55.5 | 1.12 |
| 500-20 | 15.4 | 70.1 | 10.5 | 60.0 | 1.17 |
| 600-20 | 16.6 | 72.0 | 12.6 | 65.0 | 1.11 |
| 300-50 | 2.4 | 22.5 | 3.0 | 28.0 | 0.80 |
| 400-50 | 3.2 | 30.0 | 3.8 | 34.0 | 0.88 |
| 600-50 | 5.2 | 43.0 | 5.6 | 44.0 | 0.97 |
| ax̄ = 1.00 + 0.03. | |||||
From the Donnan ratio r not only the potential in mV but also the inside concentration of chloride can be calculated. For example at 5 mM chloride and 300 mM sucrose outside the inside concentration of chloride is 93 mM (5 mM x 18.6). By the above assumptions the negative charge contribution of haemoglobin can also be calculated: Ci = Cli + Hgb
Ci (Internal electrolyte concentration of about 150 mM) = Cli (Chloride concentration inside of 93 mM) + Hgb (negative charge contribution of haemoglobin for this example 57 mEquivalent). Since the Donnan ratio is valid and the internal buffer capacity β of haemoglobin has been experimentally determined, also the inside pH value can be estimated from:
Hgb = β(pH – isoelectric point of haemoglobin)
or: (Hgb/β)+i.p. Hb = pH inside
For the above example: (57/60) + i.p. 6.9 = pH 7.85 chloride inside and by the Donnan ratio a pH outside of pH of 6.6 can be calculated. This is so, when an average i.p. of haemoglobin of pH 6.9 and an average internal buffer capacity from the two values given by Jerome Donlon of 58 and 62 meq/liter RBCs pro pH unit was chosen.
Whereas at the high outside concentrations for example of 20 mM chloride the above calculations of the inside and outside pH are in good agreement with the presented values by Jerome Donlon, the values at low chloride concentrations, for example of 5 and 10 mM chloride, disagree for more than one pH unit. This discrepancy exists also between Paul LaCelle and Aser Rothstein [22] and Jerome Donlon’s data. The initial outside pH values of the first authors averaged at pH 6.8 with an extreme range of 6.5 and 7.0 and with only small changes (0.1 pH unit) during the course of a 10 to 30 min. experiment. This is in complete agreement with an outside pH, calculated from the above data, for example, with 5 mM chloride outside and 300, 400 and 500 mM sucrose of pH’s calculated outside of 6.58, 6.73 and 6.92, but not with pH’s outside of 5.5, 5.42 and 5.35 given under comparable conditions by Jerome Donlon [24].
The main result, however, is the confirmation of the two regions and the detection of a third region of passive cation efflux and that at different Osmolarities. All the curves are linear in respect to the logarithm of the external salt concentration. This means that the second phase of salt efflux according to Jacobs and Parpart [5] is not only dependent on the chloride potential, but can be divided into three cation permeability zones according to a limiting chloride potential of +170 mV and +45 mV in 300 mOsm sucrose solution. It was discussed that the inflection points probably reflect a molecular configurational change in the membrane due to the electric field. The Goldman equation predicts a straight-line relationship between electrochemical driving force and flux. By applying the Goldman equation to the data the permeability from 0 to +45 mV is not significantly changed. From +45 to +170 mV the permeability increases significantly with a tendency to a maximum and plateau above +100 mV. Above +170 mV a second steep increase in permeability is observed, but the data do not extent far enough to ascertain whether or not a new stable state is reached. This increase in permeability may represent the behaviour of normal channels or the opening of new channels. The gradual increase in permeability from +45 to +170 mV could be explained by different populations of channels or the gradual opening of channels under the force exerted by the potential.
The Anion Exchanger Band 3 and the Effect of Low Ionic Strength in Salt Efflux
The first prediction of anion exchange being involved in the effect of low ionic strength was given by Jacobs and Parpart [5]. The precise technique developed by Jacobs in 1930 to measure the osmotic properties of erythrocytes in approximately 1.2 seconds for the study of haemolysis permitted experiments of fast processes. The involvement of an anion exchange at low ionic strength was stimulated by Jacobs from the theoretical work of Netter H [8], who pointed out that anions from erythrocytes would tend to be exchanged for OH- ions from the aqueous solutions in such way as to make the interior of cells more alkaline. The subsequent work of Jacobs and Parpart [5] with highly diluted blood of the ox lead to the prediction of two phases of RBCs in sucrose solution: at first a very rapid OH-/Cl- exchange, whose effects are apparent within a few seconds and complete within a minute or two, followed by the second phase of salt efflux.
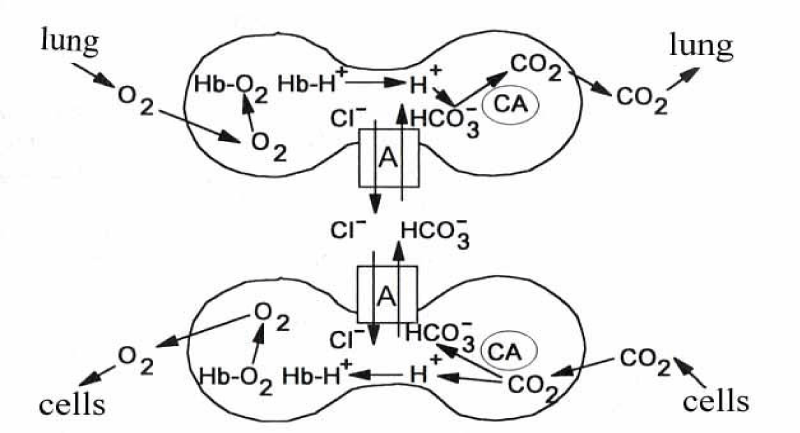
At that time, however, it was believed that the anion transport was mediated by pores lined with fixed positive charges to account for the ion selectivity of the membrane. On the basis of labelling experiments with disulfonic stilbene inhibitors of anion transport it appears that a prominent component of the membrane, a 95 000 Dalton polypeptide known as band 3, was characterized to mediate anion transport [26]. This protein represents over 25% of the total membrane protein. From ultra-structural data band 3 protein corresponds to intramembrane particle covering nearly the whole membrane by 1.2 x 10⁶ copies [27]. By virtue of its high content of band 3 the erythrocyte membrane appears to be specialized for anion transport. CO2 rapidly diffuses into the red cells where it is catalysed by Carbonic Anhydrase (CA) into H+ and HCO3- anion, which is quickly equilibrated between serum and red cells by Cl- exchanger (A). In the short time of less of a second it has to leave the lungs as CO2. Thus HCO3- of the serum has to enter the red cells again by the anion exchanger, where it is cleaved by carbonic anhydrase into a proton and CO2 to be exhaled.
It has been calculated that under in vitro conditions the HCO3-/Cl- exchange will be 90% complete within 0.3 to 0.5 sec [28]. Even faster is the OH-/Cl- exchange with 3.8 x 10⁻³ against 4 x 10⁻⁴ cm/sec for a Cl-/Cl- exchange [29].
Thus, at low ionic strength the fast physiological HCO3-/Cl- exchange mechanism for CO2 exhalation is used to ascertain in times less than a second the new Donnan equilibration between anions. This is obvious from the many experiments cited in this review. The rapidity of reaching a positive Nernst potential, which is dependent on the chloride ratio in RBCs, determines the salt efflux. In contrast, the equilibrium is also immediately interrupted by addition of an anion, such as chloride to the outside medium, which also quickly stopped the salt efflux.
A consequence of the Donnan equilibrium in non-electrolyte solutions is as Hans Netter [8] predicted an alkalization and acidification of each side of the cell membrane. From the high concentration of the anion transporter protein in the membrane, which extends the lipid membrane at the plasma and medium site and its efficient exchange rate, it produces an alkalinisation at the inside and acidification outside. Indeed Maizels M [7] measured in 1935 a decrease in outside pH from 6.4 - 6.6 in unbuffered glucose solution. Immediately after centrifugation of the cells the supernatant became acidic to pH 5.6. After 1 hour of incubation of RBCs in glucose medium the pH raised to a pH of 7.8 - 8.
Five years later in 1940 Wilbrandt W [11] measured pH by a glass electrode during incubation of human red cells in unbuffered sucrose solution at 20°C. The pH decreased very fast from about pH 7.7 to more than one pH unit to a pH below 6.5 in less than a half minute and increased slowly to about pH 8. The fast change corresponded to the first phase of Jacobs and Parpart’s [5] OH-/Cl- exchange. And the consecutive slow process represents the second phase, the salt efflux with pH increase. In addition Wilbrandt estimated the salt efflux with an osmotic method. Since both curves, the slow pH increases and the salt loss, are very comparable in slope, Wilbrandt concluded that both curves have the same cause, namely salt efflux.
The time of the first fast pH decrease and a lower pH value were dependent on the dilution rate of the RBCs and the contamination with anions by the packed cells, mainly chloride. At higher dilution of the cells the exchange rate is exceptionally fast, comparable with the exchange of chloride and bicarbonate in the lungs. A contamination with bicarbonate of the packed cells will at the acidic pH of the medium produce CO2, which quickly enters the cells and contributes to an opposite effect, namely an inside acidification.
The Role of the Chloride Gradient across the RBC Membranes on Sodium and Potassium Movements
By Cotterrell D and Whittam R [30] an investigation was made to explore whether active and passive movements of sodium and potassium in human red blood cells are influenced by changing the chloride gradient and hence the membrane potential. Because of alkalization by the Nernst equilibrium the active transport could only be investigated from -9 to + 30 mV and compared with passive movement of sodium and potassium.
Chloride distribution was measured between red cells and isotonic solutions with a range of concentrations of chloride and non-penetrating anions such as EDTA, citrate or gluconate. The chloride ratio from internal/external was approximately equal to the inverse of the hydrogen ion ratio at normal and low external chloride, and inversely proportional to external pH. The results demonstrate that chloride is passively distributed, making it valid to calculate the membrane potential from the chloride ratio.
By changing the membrane potential from -9 to +30 mV the quabain-sensitive active potassium influx and sodium efflux were decreased by not more than 20 and 40%. In contrast, the passive movements were reversibly altered, potassium influx was decreased to about 60% and the efflux increased some tenfold. Passive sodium influx was unaffected by the nature of the anion and dependent only on the external sodium concentration, whereas passive sodium efflux increased about threefold. The results suggest that reversing the chloride gradient and the potential had little effect on the sodium-potassium pump, but increased the passive outward fluxes of sodium and potassium.
External chloride was reduced to 10-30 mM by replacement with citrate or EDTA or gluconate, there was more chloride in the cells (90 – 110 mmoles/litres RBCs) than in the medium giving a distribution ratio of about 3.0. Normal cell permeability could be restored by returning cells to chloride medium, demonstrating that the foreign anions used to alter the chloride gradient did not irreparably damage RBCs. Similar permeability changes were induced by EDTA, citrate and gluconate. The net potassium loss and small sodium gain was found to be in line with the past work on the relation between potassium loss in non-electrolyte media and membrane potential, although the effects with the impermeant polyvalent anions are not so dramatic as those in very low ionic strength sucrose media.
Involvement of the Anion Transporter Band 3 in Cation Permeability of Human RBCs in Low Chloride Media
The anion transporter band 3 mediates the fast Cl-/Cl- exchange as well as the hetero exchange HCO3-/Cl- or OH-/Cl- for example as well as the net efflux of anions, which is in contrast to the silent exchange, a conductance pathway. The question, whether the RBC chloride conductance in low ionic strength might be rate limiting for the net loss of salts from RBCs in a sucrose medium has been investigated by a new technique of fast sampling [31].
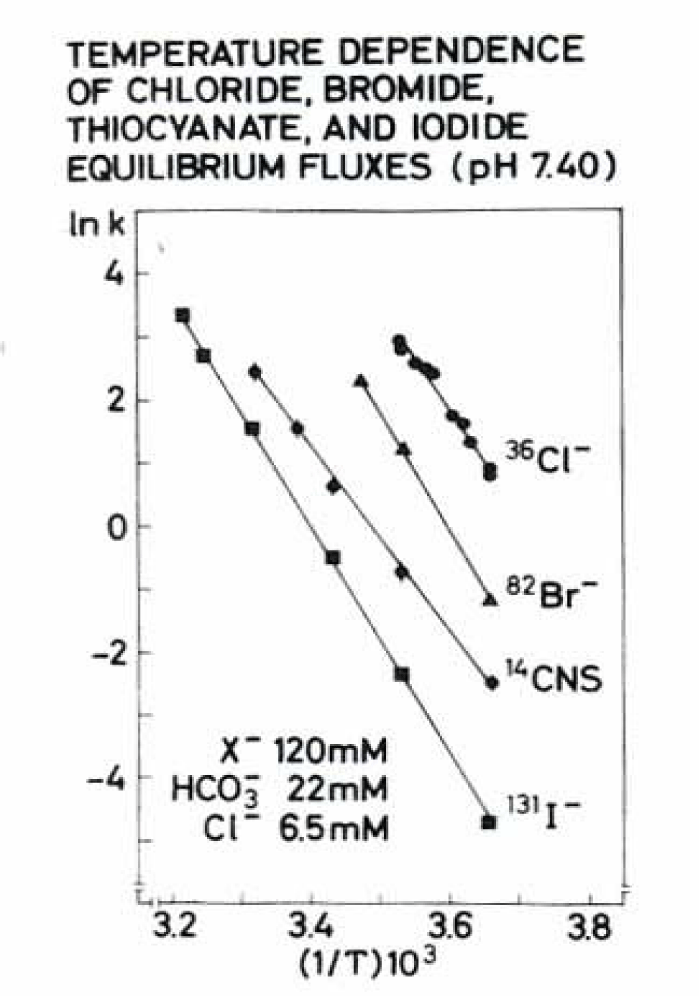
With this fast-sampling method the following important properties of the anion exchange could be investigated:
- The apparent high activation energy of the exchange for chloride, bromide, thiocyanate (CNS) and iodide is at low temperatures within the range of 29 to 37 kcal/mole.
- Discrimination between the transport exchange system by a high specifity of the anions transport rates. Chloride, bromide, and thiocyanate were transported 260, 32, and 9 times faster than iodide at 0°C.
- The chloride exchange flux at 0°C has a rather flat maximum between pH 7 and 8.5, and decreases steeply at both higher and lower pH.
- The hypothesis that chloride interacts with a limited number of transport sites in the membrane is corroborated by the observation that the self-exchange flux of chloride becomes saturated when intracellular chloride is above 120-150 meq/l cell water.
- Chloride exchange is inhibited by phloretin in contrast to the anion conductance pathway for example the KCl loss into sucrose media.
The next figure 18 shows the temperature dependence of chloride, bromide, thiocyanate and iodide in an Arrhenius plot.
The pH dependence and saturation kinetics are prominent features of the anion exchange system. Together with the high activation energy between 29 and 37 kcal/mole for example for chloride at low temperatures (0 to 15°C) is probably the expression for the fast conformation change of the transport protein band 3.
The fast-sampling method is also best suited for studying the effect of salt efflux at low ionic strength. The high dilution rate of red cells of 1 : 200 and the determination of initial flux rates in seconds are excellent conditions for the accuracy of flux determinations at low ionic strength.
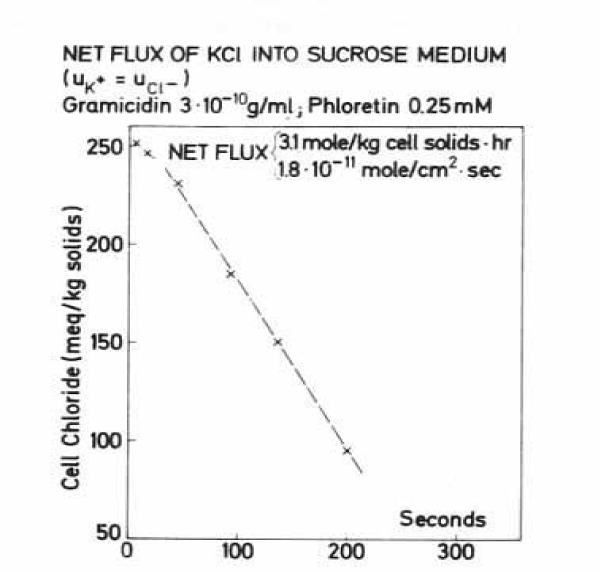
Therefore 150 mg of packed human RBCs were injected into 30 ml of 300 mM sucrose solution with 0.1 mM KCl at pH 6.8 and 25°C. The cells shrink while they lose an isotonic solution of KCl. The net flux was determined from the increase in chloride concentration in the external medium. The amount of hydrogen ions transferred is negligible in the absence of a buffer, even though the pH of the external solution may change 1 pH unit or more. KCl flux was very high with 3.1 mole per kg cell solids per hour, or 1.24 mol per litre cells per hour. This value is about 16 times higher as LaCelle and Rothstein [22] have measured at 0.1 mM chloride with 75 mmoles cations/ per litre RBCs per hour or 0.188 moles/ kg RBC solids per hour. The figure 19 shows the result by data of the chloride efflux.
By comparing the above efflux of chloride in sucrose at 25°C with the data of LaCelle and Rothstein [22] at 23°C, it can be seen by their figure 9 that two different phases of the efflux have been compared. LaCelle and Rothstein measured with their statting method the second phase of salt efflux in sucrose, whereas Wieth, et al. [31], by their rapid sampling, estimated the first phase, described by Jacobs and Parpart [5] as OH-/Cl- exchange phase. Wilbrandt and Schatzmann [20] in figure 8 and LaCelle and Rothstein [22] in figure 9 showed by conductivity measurements that the so called OH-/Cl- exchange phase, lasting for only minutes, demonstrates also salt efflux, but at a considerable higher rate as the salt efflux in the second phase. By a rough estimation of the slopes in the first and the second phases an increase by a factor 16 seems to be possible. It would be more correct, therefore, to change the first phase of OH-/Cl- exchange named by Jacobs and Parpart [5] into a “post OH-/Cl- exchange phase” of salt efflux.
Wieth, et al. [31] concluded, from the result in figure 19, that the chloride conductance pathway is not rate limiting for the salt efflux. Further information comes from the aglycon phloretin, which was present in the above experiment at 0.25 mM with no inhibition of the conductance chloride pathway. However, in chloride self exchange experiments the above concentration of phloretin inhibited the exchange pathway by 99.9% and increases valinomycin induced potassium self exchange. We observed for phloretin a keto-enol tautomerism, only the ketonic form of phloretin (pK value 7.26) at low pH was inhibitory in HCO3-/Cl- exchange and inhibited effective glucose efflux but not the influx [33]. Thus, phloretin demonstrates an asymmetric behaviour in facilitated transporters.
The Effect of the Inhibitor DIDS’s on the Anion Transporter Band 3 in Cation Permeability of Human RBCs in Low Chloride Media
A central role in anion transport, for example in inhibition and labelling the anion transporter band 3, has been the molecule DIDS (4,4’-diisothiocyanostilbene-2,2’-disulfonic acid), a potent inhibitor around the outside anion transport substrate site, known since 1974 by Cabantchik and Rothstein [26]. A precursor molecule SITS (4-acetamido-4’-isothicyanostilbene-2.2’-disulfonic acid) was shown already by Philip A Knauf in 1970 [34] to inhibit the cation permeability increase in low chloride media. After this, a detailed investigation of the mechanism of DIDS in low chloride media in Phil Knauf’s laboratory in Rochester was very consequent [35].
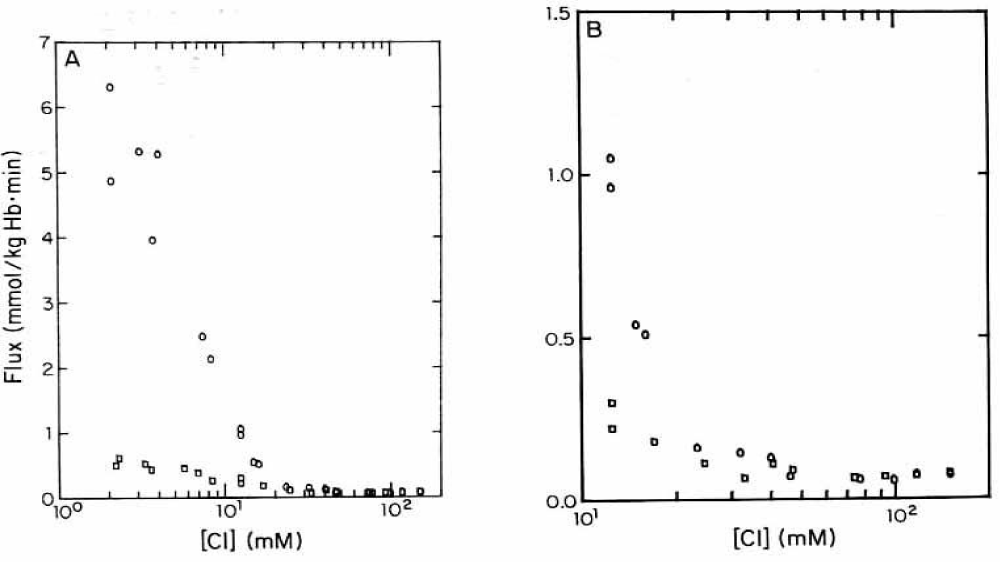
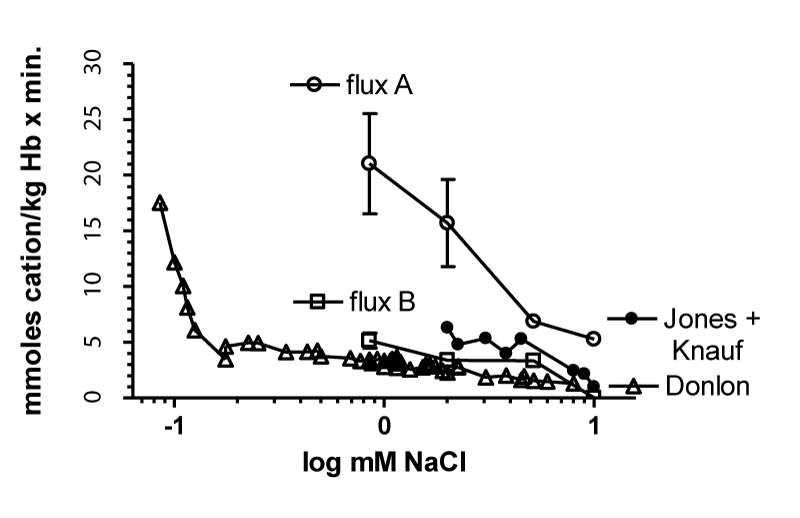
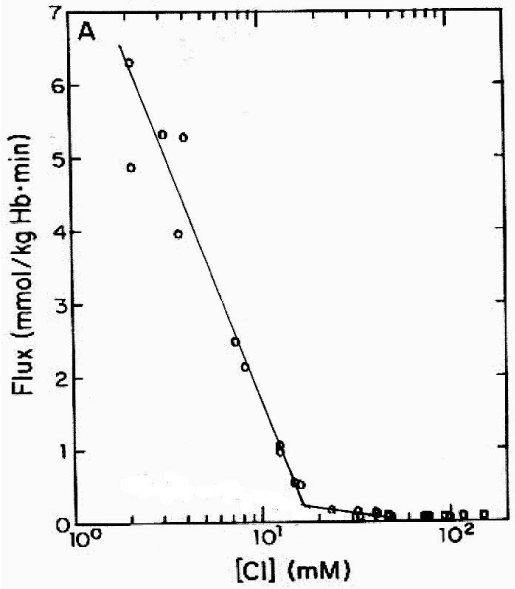
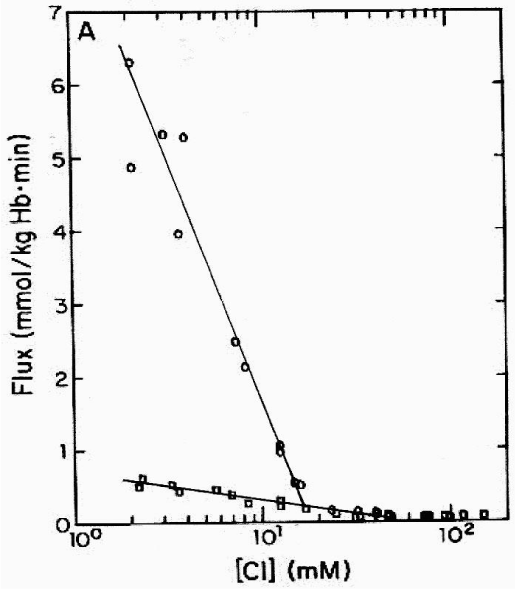
Similar to LaCelle and Rothstein [22] and Donlon and Rothstein [24,25] the experimental data in figure 20A are depicted on a semi-logarithmic scale. The control values without DIDS (Circles) can be fitted by two straight line segments from 2 to about 20 mM chloride and 20 to more than 100 mM chloride with one inflection point at about 20 mM chloride. The first steep slope is comparable with the second slope of the data from LaCelle and Rothstein [22], see figure 11 with 300 mOsm sucrose between 2 mM and higher chloride concentrations at 37°C. The slow second slope, however, could be in agreement with the third slope of Donlon and Rothstein [25], see figure 13, but with lower fluxes at 23°C. It is interesting to note that 10 µM DIDS (Squares) only affect the first straight line segment between 2 and 20 mM chloride. The inhibition at 2 mM chloride concentration by DIDS is about 91%, whereas around 10 mM chloride DIDS inhibits only 75% and above 40 mM chloride there is no significant effect of DIDS (See data points in figure 20b).
The inhibition mechanism by DIDS could involve the positive membrane potential as driving force for the salt efflux in sucrose medium affected by the anion exchange or the net anion conductivity pathway. Indeed, inhibition is high with 91% at 2 mM chloride with about +105 mV membrane potential against no significant inhibition at 40 mM chloride outside with only a slightly positive membrane potential of +25 mV. This potential might be too low for acting as an efficient driving force. Donlon JA and Rothstein A [25] discussed that in the range of 0 to 45 mV the permeability at low ionic strength is independent of the potential. It is not clear why Jones GS and Knauf PhA [35] by knowing this fact, did their main experiments at 12.5 mM chloride outside in sucrose media with a membrane potential of +50.6 mV, which is at the border line to be effective as driving force for the salt efflux in low ionic strength. From these investigations originated their main argument, that 10 µM DIDS did not affect significantly the membrane potential, measured to be slightly reduced from +50.6 to + 47.4 mV. Even after DIDS treatment, ~16% of chloride permeability remains, so the membrane potential would still be largely controlled by the Cl- ratio.
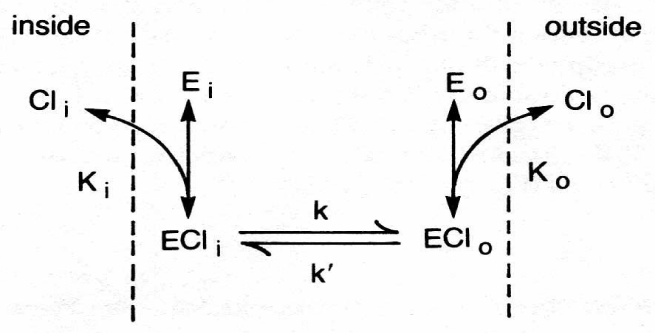
A mechanism of substrate and inhibitor binding, and ion translocation in band 3 is given by Philip A Knauf, et al. [36]. Already earlier measurements indicated that the transport of band 3 functions as a ping-pong mechanism.
This behaviour is in qualitative agreement with the ping-pong model. However, H2DIDS or DIDS could bind to the chloride site itself or might bind to a different site and prevent chloride binding to the transporter. When red blood cells are reacted with DIDS for different times an inhibition of both pathways of KCL efflux by valinomycin and of chloride exchange was measured in parallel, which strongly indicates that in both cases the transporter band 3 is involved [37].
In contrast to DIDS, a further inhibitor of band 3, niflumic acid, acting non-competitively by blocking the conformational change that mediates anion exchange with an apparent Ki-value of 0.6 µM was tested in sucrose media with 12.5 mM chloride, but did not show at the even high concentration of 50 µM niflumic acid any effect on net KCl efflux. From this it seemed that the exchange mechanism could be excluded. Further experimental data suggested, that in low chloride media with DIDS, the selectivity for anion net flux might be so far decreased, that the conductivity channel of band 3 for anions could also be used for the transport of cations, for example by Na+ and Rb+, as well as K+.
Cation Loss and Haemolysis of RBCs of the High Potassium Type (HK+-Type) and Low Potassium Type (LK+-Type) Suspended in Isotonic Non-Electrolyte Media
The study of Zeidler RB and Kim HD [38] used different mammals from which the following RBCs of the high potassium type (HK+-type) were derived: human, guinea pig, rat, rabbit, newborn calf, newborn piglet and pig, as well as mammals with RBCs of the low potassium type (LK+-type), which contain sodium as the predominant cation species, such us: dog, cat, sheep and cow. The governing factors were to investigate salt efflux of those different red blood cells at 5% hematocrit in 300 mM sucrose media, buffered with 10 mM TRIS-HEPES pH 7.4 and 37°C. Besides the salt efflux from the RBCs, measured by flame photometry and chloridometer, the haemolysis of the different RBCs was investigated.
The curve of potassium efflux from human RBCs presented are very similar to those given by Karen D Krüger [40] and Florian Bruness [41] at 0.8 mM chloride and 300 mM sucrose with 20 mM Hepes-Tris-buffer at 37°C. Very important is here the differentiation to separate HK+-type RBCs from the dominantly sodium rich LK+-type RBCs.
For the first type the order of cation response in RBC species agrees very well with the order given by Hugh Davson [15] with human > guinea-pig > rat < pig and rabbit. In addition, Zeidler and Kim [38] included the species of the calf and the newborn pig, in which the red cells of the calf produce haemolysis after about 10 minutes and then lose K+. However, the RBCs of the newborn pig show nearly no potassium loss, as is the case with the adult pig.
The order from the species of the LK+-type RBCs at the right side of the figure is: Cat < cow < dog and sheep. Dog RBCs are prone to early haemolysis and therefore cannot be observed longer than ten minutes. Sheep red cells show nearly no response of sodium loss. There is, however, no difference in potassium and sodium permeability in both species of RBCs.
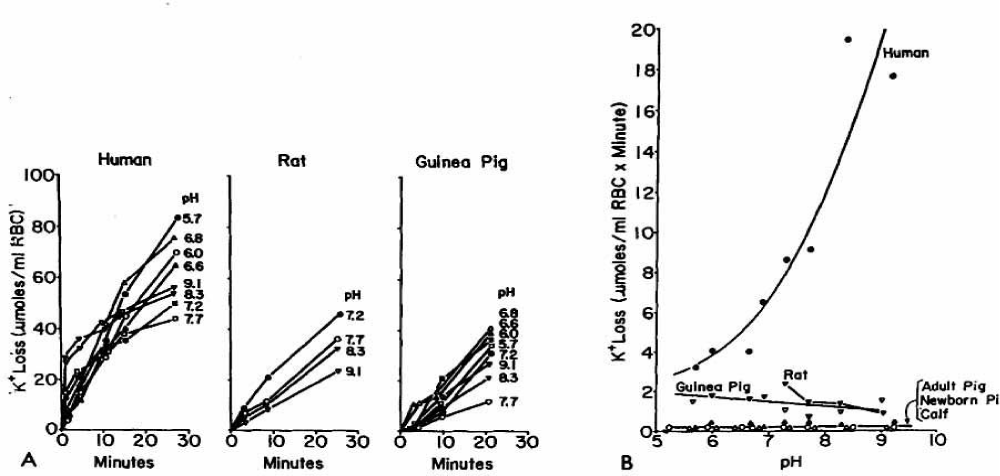
An interesting observation made by Zeidler and Kim [38] is the different behaviour of the initial K+ loss in RBCs of human, rat and guinea pig (Figure 23).
The salt initially in the sucrose medium was estimated by Zeidler and Kim with 0.2 - 0.3 mM, whereas during the time of efflux from 5% RBCs the salt concentration may increase to about 5 mM. It is especially the chloride concentration, which affects the cation efflux in sucrose medium. The authors concluded, that their efflux of cations must reflect the permeability states of the low and high NaCl concentrations at the two slopes investigated by LaCelle and Rothstein [22] and Donlon and Rothstein [25]. However, these investigators started their steady state measurements after the first fast initial K+ efflux at 23°C, which might not correspond to the two states mentioned by Zeidler and Kim in their efflux experiments. An increase of K+ efflux in human RBCs by an increase in pH is in agreement with the reported data by Maizels [9] in 1935 and Davson [10] in 1939 as well by H. Passow [39] in 1965.
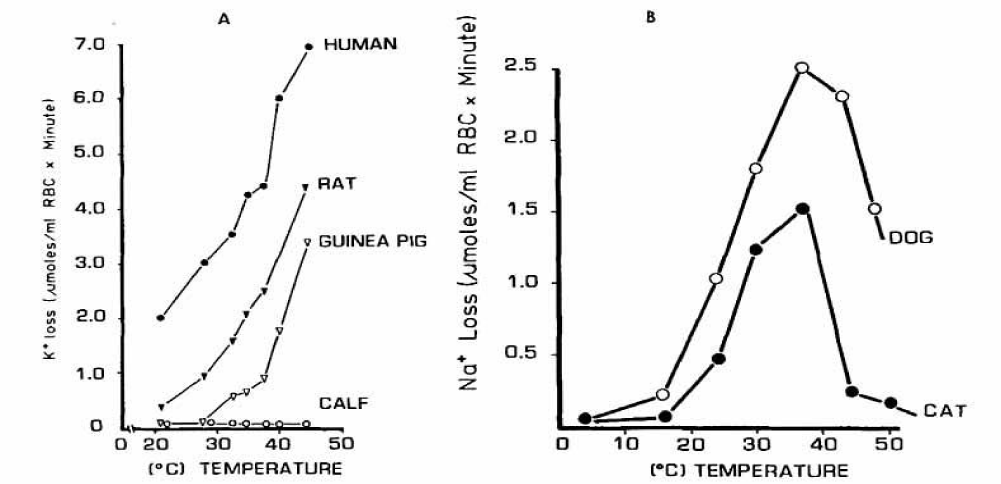
The effects of temperature on the K+ and Na+ flux from HK+-type (A) and LK+-type (B) RBCs are shown in figures 24A,B.
HK+-type RBCs increase their fluxes with temperature, except for calf RBCs. The temperature dependence was similar in human and rat RBCs, but guinea pig cells showed a biphasic response. The apparent activation energy calculated from an Arrhenius-plot was 11,200 cal/mole for human RBCs and 15,000 cal/mole for rat RBCs.
The Na+ flux from LK+-type RBCs of the dog and cat increased to a maximum at 37°C, after which the flux decreased. In this respect both types react differently.
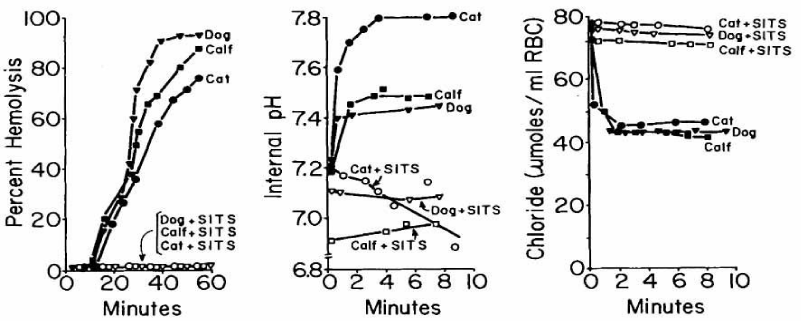
Zeidler and Kim [38] found that RBCs of the newborn calf, because of the fetal type of haemoglobin are especially sensitive to haemolysis. Some mammalian RBCs haemolyzed when suspended in buffered 300 mM sucrose, in a manner similar to RBCs of the newborn calves, which undergo a total haemolysis in a non-electrolyte medium. This is also documented from RBCs of the calf, dog and cat. Unexpectedly, there is a large variability in different cats from no to total haemolysis.
In RBCs from the calf there is a good correlation between the process of haemolysis and intracellular alkalinisation produced by the anion exchange. This fact is also well known in dog RBCs. In the absence of a buffer haemolysis rarely occurs. This fact is explained by the authors to be due to the difficulty to maintain the critical intracellular pH of 7.5.
The alkalinization process was directly related to the anion exchanger band 3, the authors found a good correlation between the extent of haemolysis and the integrity of the band 3 protein. When this protein was hydrolysed by proteolytic enzymes, haemolysis was progressively inhibited.
Haemolysis in these mammalian RBCs could be completely prevented by SITS, an inhibitor of anion exchange (Figure 25).
As expected, the inhibitor of the anion exchange SITS completely inhibits haemolysis in dog, calf and cat RBCs. It also inhibits the increase of internal pH and efflux of chloride.
Our Investigation on Cation Permeability in RBCs at Low Ionic Strength from 1999 to 2003
We investigated by two doctor theses by Karen Dorothea Krüger [40] in 1999 and Florian Bruness [41] in 2003 the effects of non-electrolytes on cation permeability in human and pig adult RBCs.
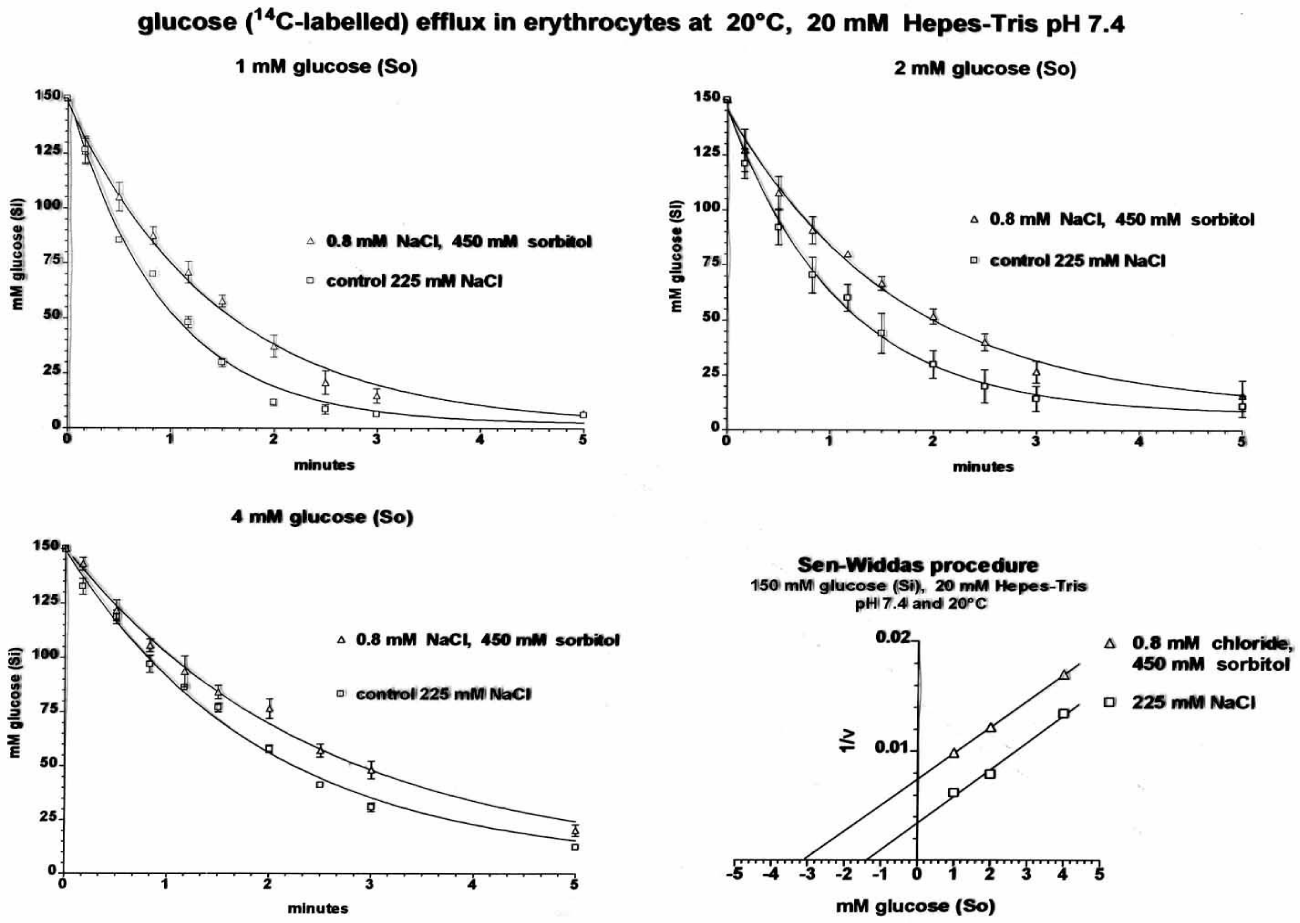
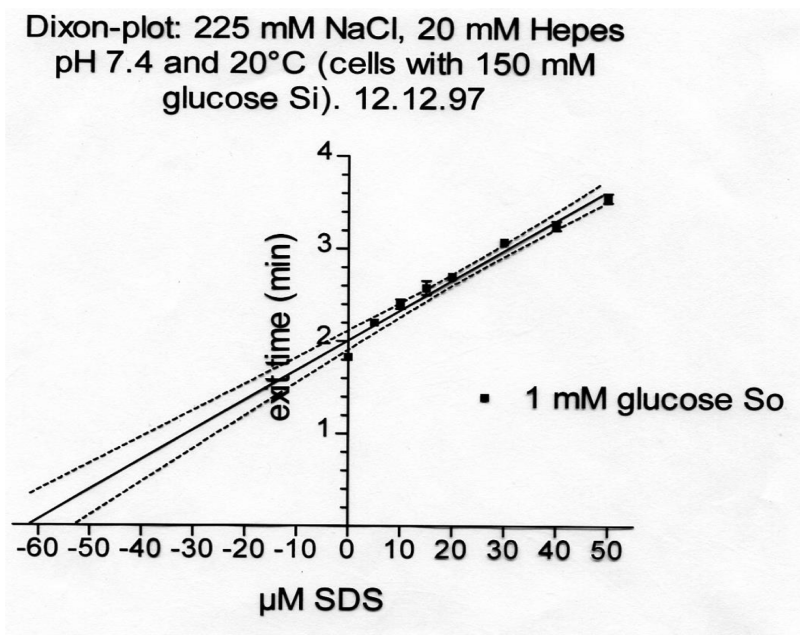
The reason for the doctor theses was an observation made by Günter Fred Fuhrmann, that non-permeating non-electolytes inhibit glucose transport in the following way:
The above experiment demonstrated an inhibition of glucose efflux by low ionic strength (The addition of 150 + 75 mM = 225 mM NaCl or 300 + 150 = 450 mOsm sorbitol is for compensation of 150 mM glucose inside the RBCs in order to start efflux at the original volume. By the Sen-Widdas procedure [42] an increase in the apparent Km-value (Intercept at the -x-axis) of glucose transport and a decrease of Vm (Intercept at the y-axes) by about 50% was noticed.
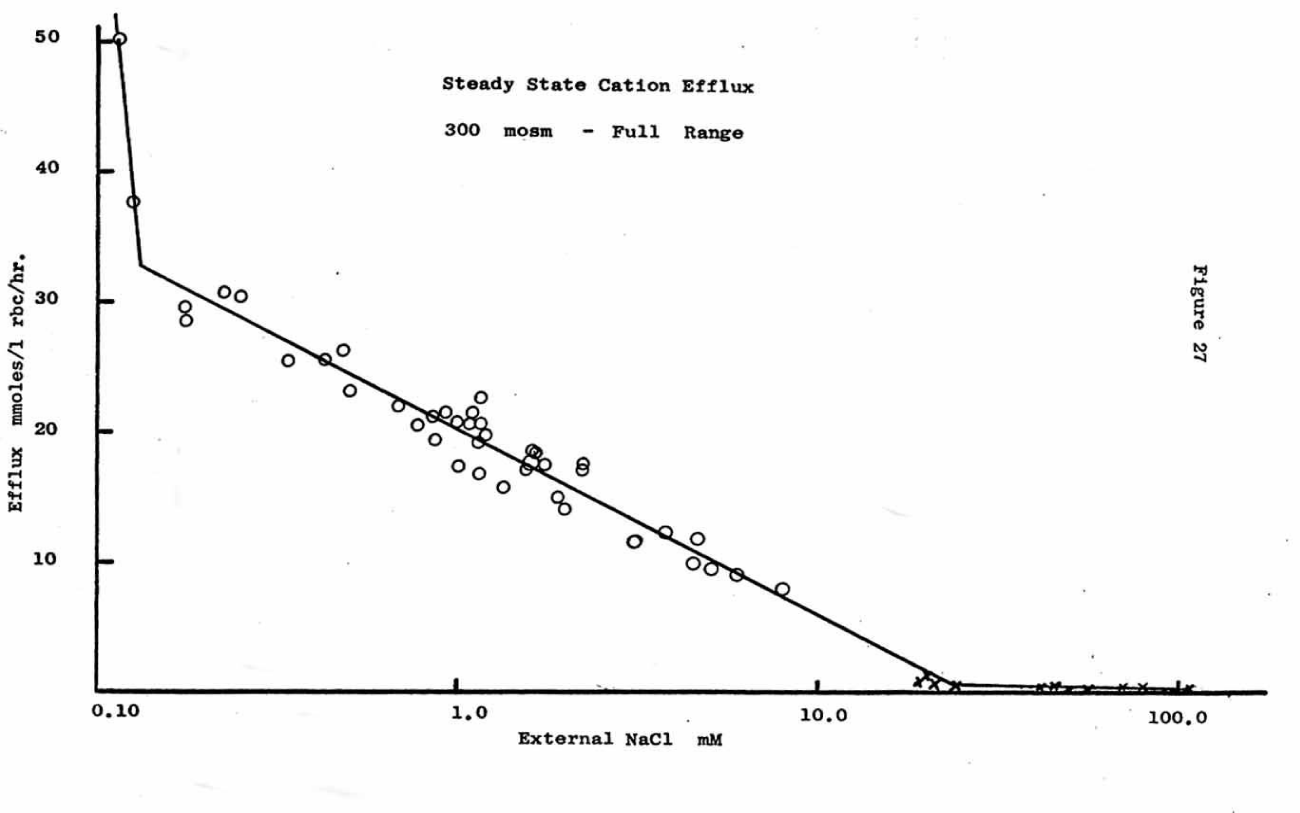
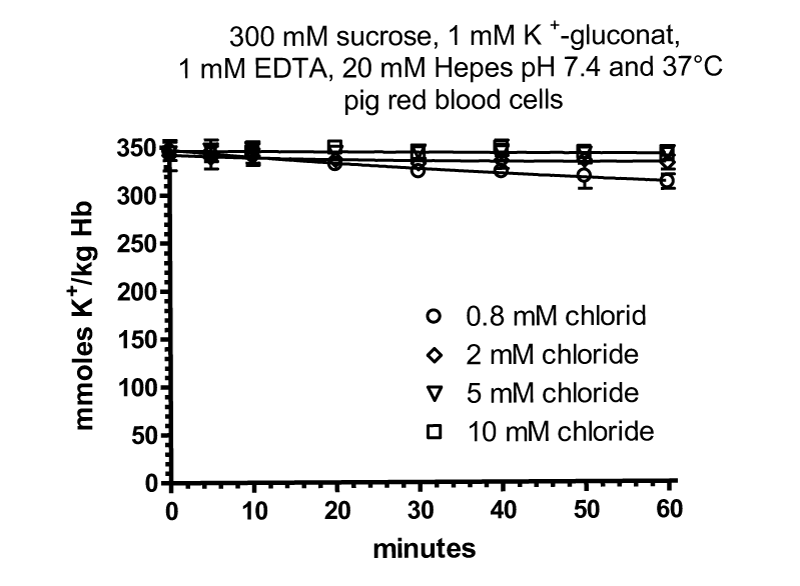
The next figure 27 shows the K+-efflux in adult pig RBCs under comparable conditions as for human RBCs.
In comparism to human RBCs efflux of potassium in pig RBCs is nearly absent, which agrees very well with the results of Hugh Davson [10] on pig RBCs and with Zeidler and Kim [38] with adult and newborn pig RBCs.
Since pig RBCs, which are devoid of glucose transporters, do not show cation loss at low ionic strength, the hypothesis was framed, that glucose transporter at low chloride concentration might form a negatively charged channel, which is permeable for Na+ and K+ [43]. However, there are RBCs from different animals which have no glucose transporter and show cation loss at low ionic strength as well as newborn pig RBCs probably with glucose transporter and no loss of cations [10] and [38].
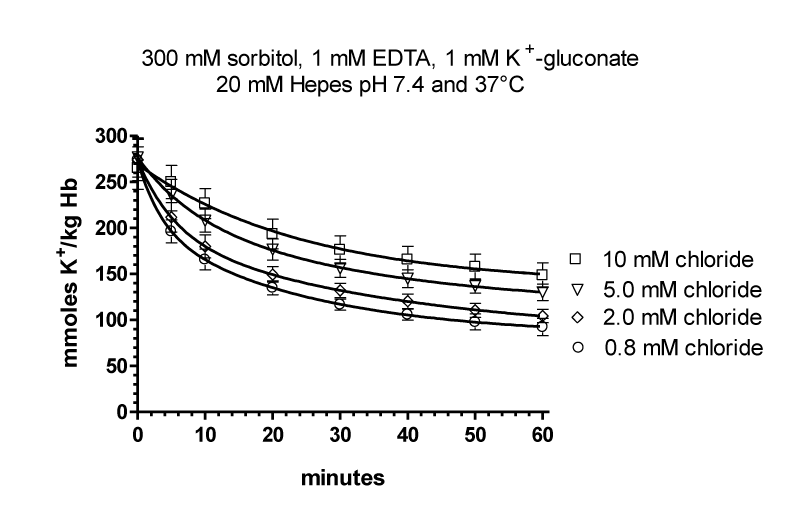
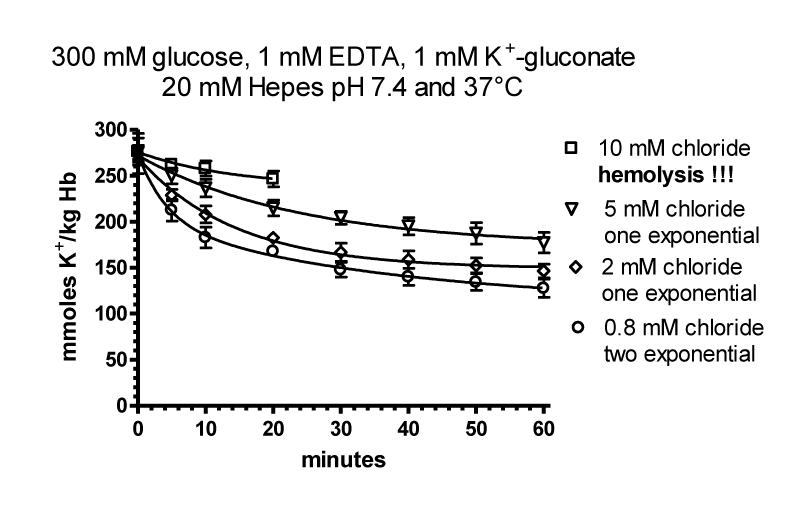
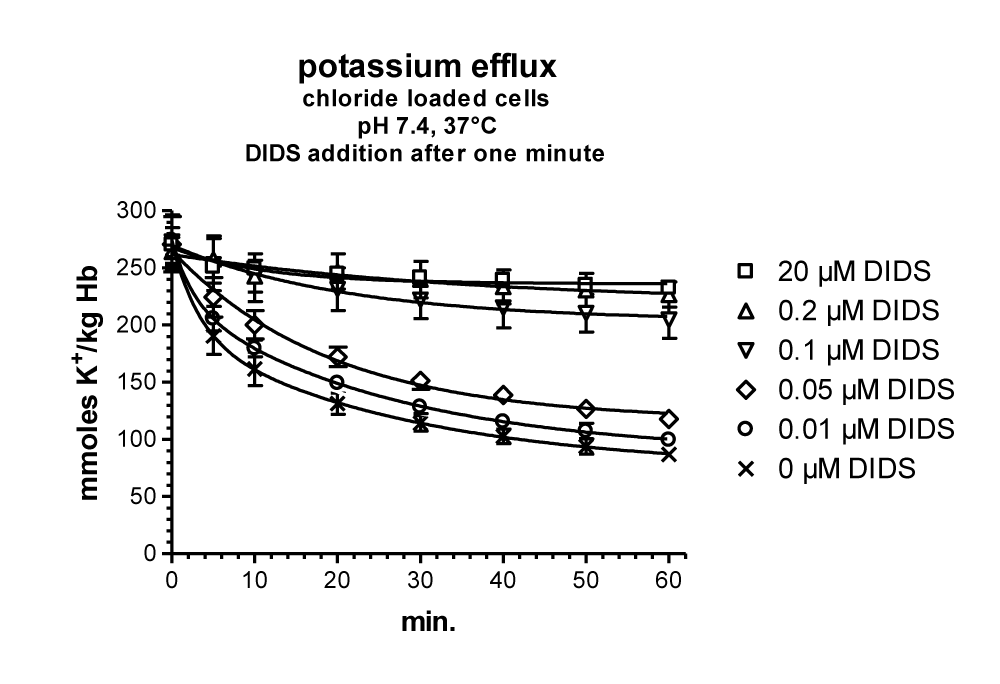
In all the experiments heparinized freshly drawn human blood was used. RBCs were washed 3 times in 150 mM NaCl, 20 mM Hepes with Tris at pH 7.4. After the third wash RBCs were adjusted to 50% hematocrit. The experiment was started by addition of 500 µl 50% cells into 50 ml flux solution shaken at 37°C. By start of the experiment the 50% RBCs with their NaCl suspension were diluted 202 fold, thus 0.5% cells and 0.75 mM sodium chloride were obtained. During salt efflux the chloride can increase by an additional 0.5 mM.
3 ml samples were taken at 0, 5, 10, 20, 30, 40, 50 and 60 minutes. Efflux was immediately stopped by dilution into 7 ml ice-cold isotonic 113 mM MgCl and 5 mM LiCl and washed 3 times. Finally the washed RBCS were haemolysed in 3 ml of 5 mM LiCl (Intern standard for flame photometry) and 10 minutes treated by ultrasound. Completely haemolysed samples were analysed for haemoglobin and by flame photometry (Carl Zeiss, Jena Flapho var) for sodium and potassium.
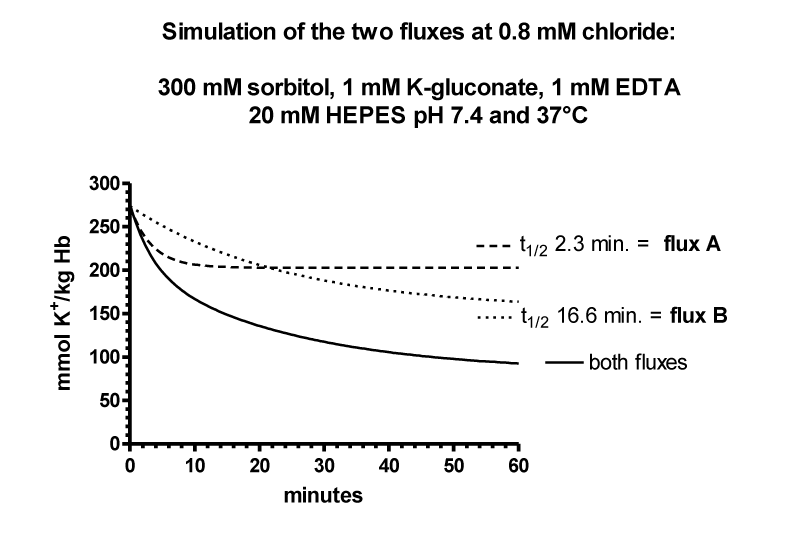
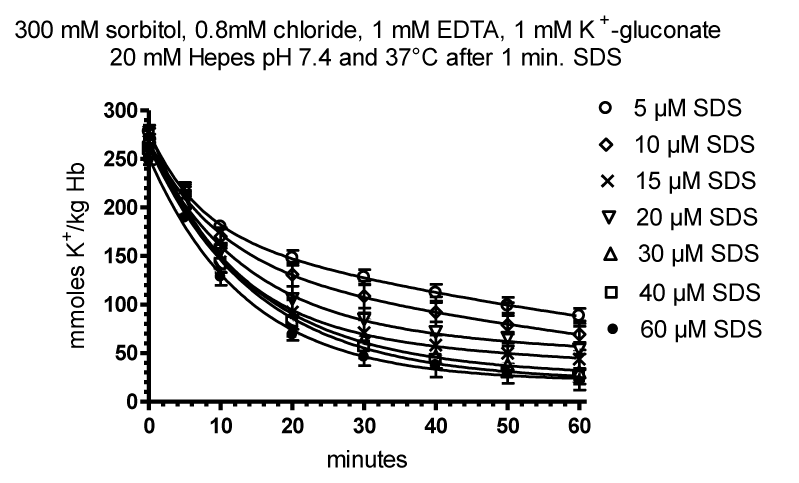
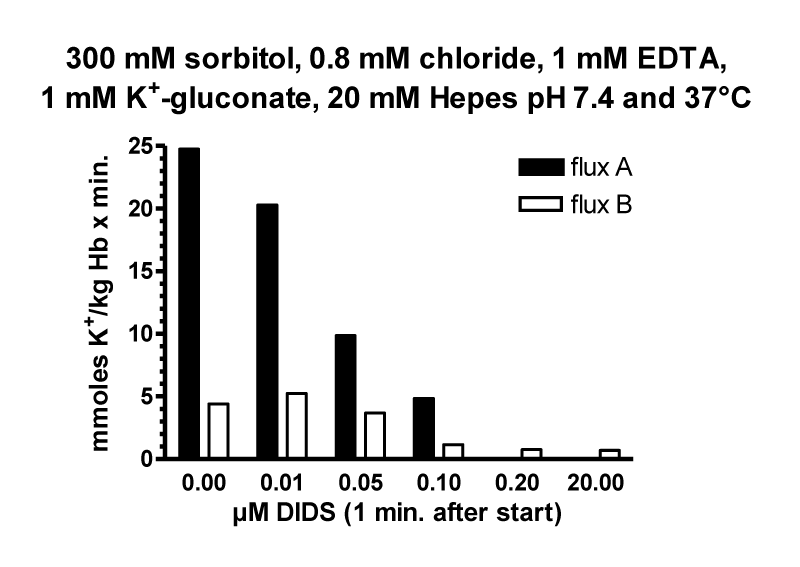
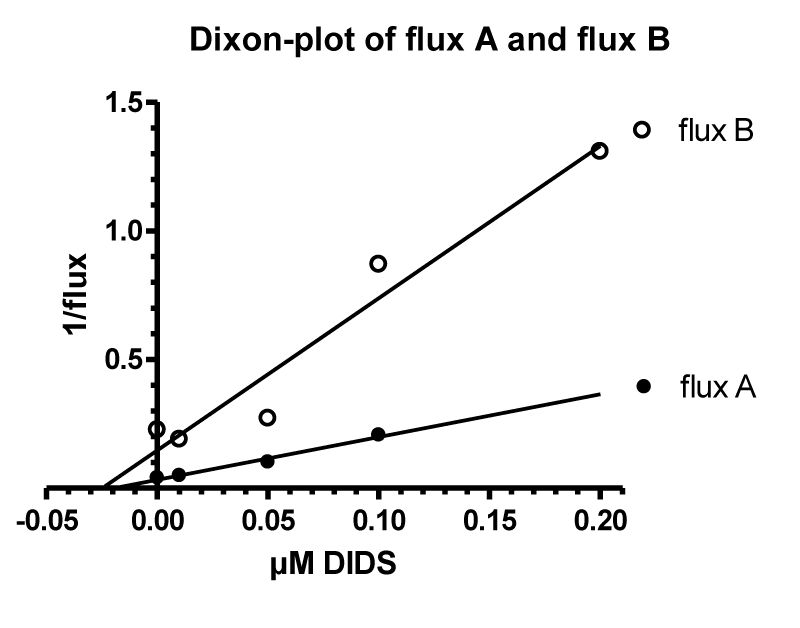
The flux data were analysed by nonlinear regression by GraphPAD in Prism using a model with two exponential decays, which was significantly better than a model with one exponential decay (p < 0.0001 for curves with 0.8, 2.0 and 5 mM chloride). Parameters table 6.
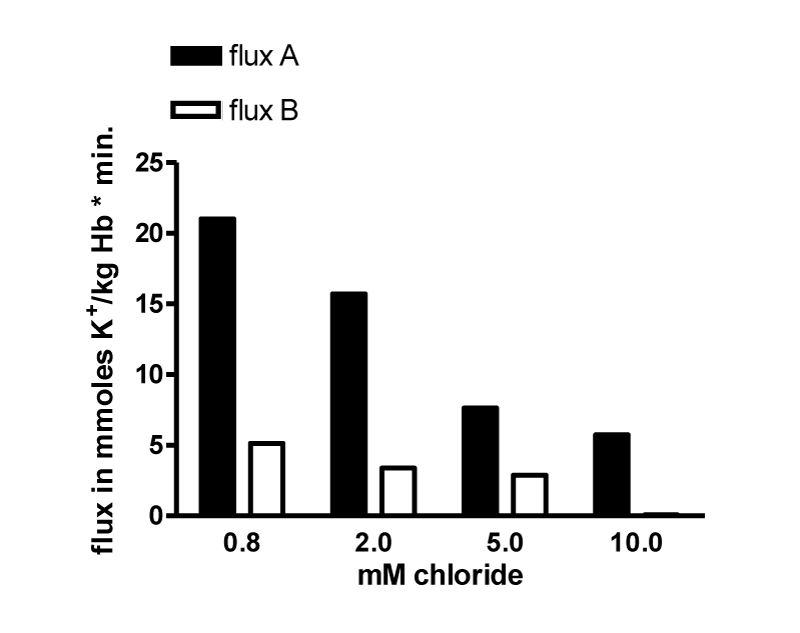
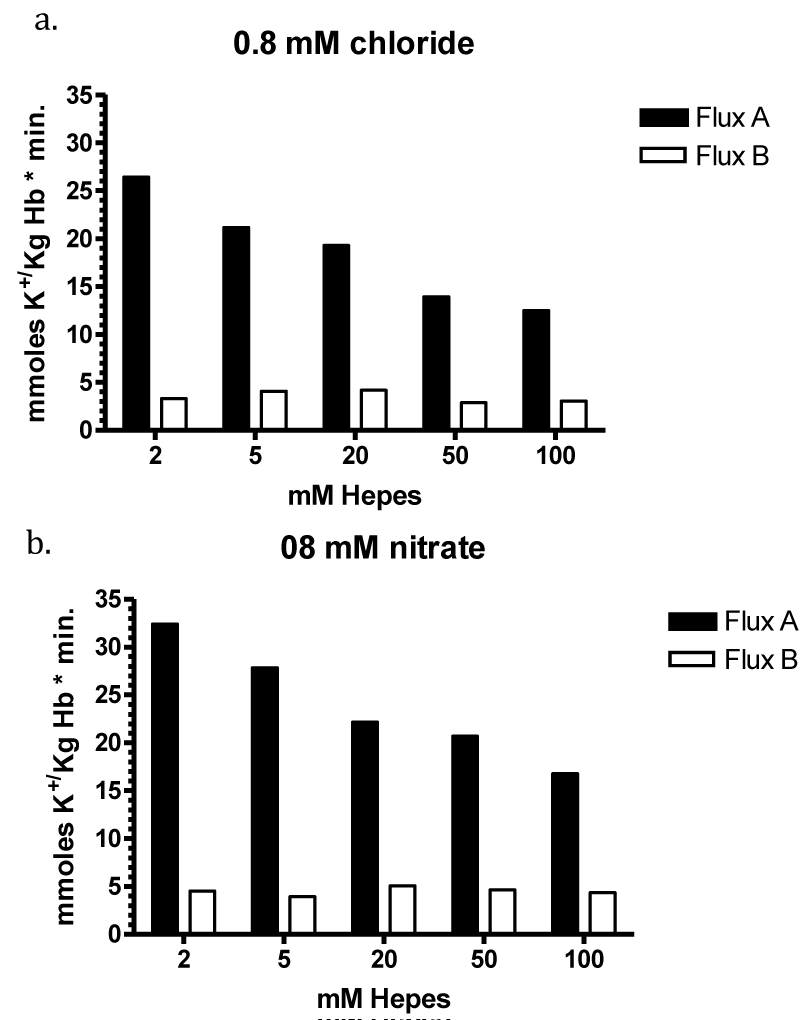
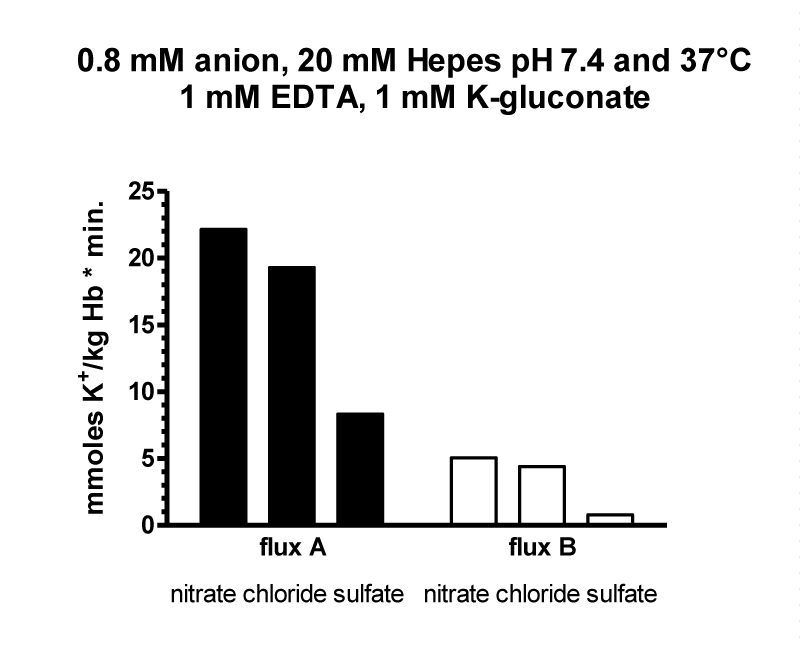
| Table 6: It shows the result for the parameters of the four curves at 0.8, 2.5 and 10 mM chloride. SPAN1 and SPAN2 are expressed in mmoles K+/ kg Haemoglobin (Hb) for the two fluxes with the rate constants K1 and K2 per minute. The two fluxes are SPAN1 x K1 and SPAN2 x K2 in mmoles K+/kg Hb x minute. The plateau in mmoles K+/ kg Hb is assumed to be the expression for a population of RBCs. which shows no permeability changes. SPAN1+ SPAN2 + plateau give the total mmoles K+/kg Hb for the zero time. For example at 0.8 mM chloride SPAN1+ SPAN2 + plateau = 274 mmoles K+/kg Hb. Since the sodium efflux has statistically the same rate constants and behaves like potassium efflux. Only the data for the latter are given. | |||||||||
| Chloride | SPAN1 | K1 | SPAN2 | K2 | SPAN1 x K1 | SPAN2 x K2 | Plateau | t1/2 1 | t1/2 2 |
| 0.8 mM (7) | 120.0 | 0.0417 | 71.13 | 0.2954 | 5.004 | 21.012 | 82.79 | 16.61 | 2.35 |
| 2.0 mM (7) | 112.4 | 0.0267 | 80.26 | 0.1858 | 3.001 | 14.912 | 81.42 | 25.96 | 3.73 |
| 5.0 mM (7) | 102.6 | 0.0281 | 67.67 | 0.1128 | 2.882 | 7.633 | 113.3 | 24.67 | 6.14 |
| 10.0 mM (6) | 33.86 | 0.0024 | 130.00 | 0.0441 | 0.0814 | 5.73 | 109.8 | 288.30 | 15.71 |
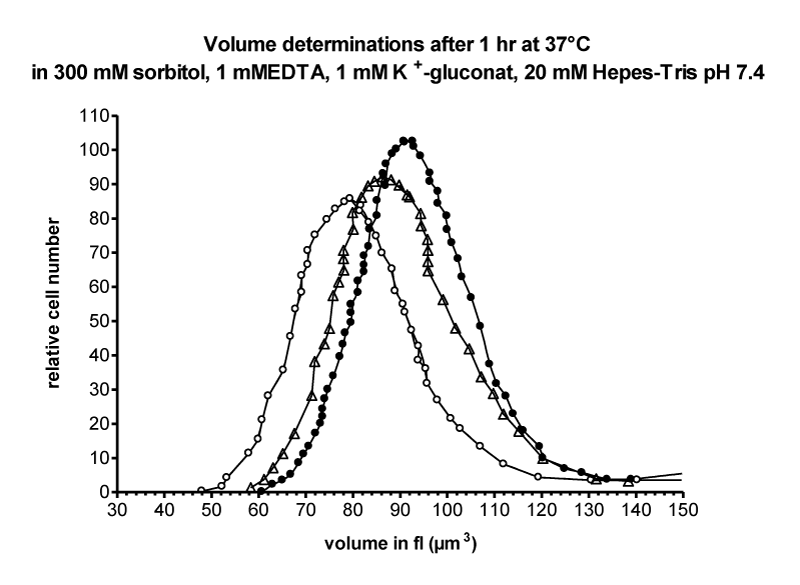
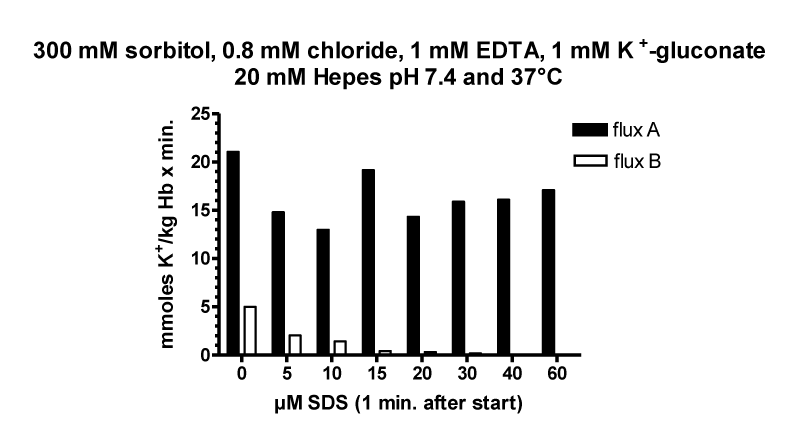
It is assumed, that the populations with the fluxes A and B behave as all or non responders. Thus, the plateaus in table 6 are an expression for the quantity of those RBCs, which have no salt efflux. At 0.8, 2, 5 and 10 mM chloride the plateaus indicate the non-responding populations to be at a proportion of 30, 30, 40 and 40%.
It was expected from the all and non-response to receive bell shaped curves with two peaks in the 1 hour treated RBCs. In comparison to the control RBCs the treated RBCs show a broadening of the peak. They are shifted, however, to a lower volume, which is a clear-cut sign for shrinking of the cells. Since Coulter Counter recording requires an isotonic NaCl solution, the low ionic strength treated cells must be dissolved in an isotonic NaCl solution, a volume increase might be expected. So the volume distributions presented may not give a quantitative, but only a qualitative result of the real volume at low ionic strength.
In figure 28a decrease of both fluxes by increasing outside chloride from 0.8 to 10 mM was shown. The next figure 32 examines the role of the buffer concentration Hepes at 0.8 mM chloride or in nitrate loaded cells with 0.8 mM nitrate outside.
The decrease of flux B with the buffer concentration could be in accordance to the pH dependence of the initial cation flux with the increase in pH as Zeidler and Kim [38], see figure 23b, have demonstrated. The increase of the buffer concentration reduces the free OH- concentration and decreases the initial flux shown for flux A. In contrast the flux B is less sensitive to pH, which is depicted by the experiments at low ionic strength against pH of LaCelle and Rothstein [22], see figure 12.
The data of flux B agree with the flux data of the second slope of Jerome Donlon [24] and the fluxes given by Jones and Knauf [35]. Flux A is the initial flux which might be comparable with the fast flux measured by conductivity by Wilbrandt and Schatzmann [20], see figure 8, by statting [22], see insert of figure 9, by the fast sampling filtration technique with the flux measured by Wieth JO, et al. [31], and by the initial flux measurements in human RBCs by Zeidler and Kim [38], see figure 23b. The quasi-linear behaviour offered by the logarithmic scale is in agreement with dependence of the fluxes by the Nernst potential as driving force.
The next experiment demonstrates a change from the non-electrolyte sorbitol to glucose. In contrast to sorbitol glucose enters the human red blood cell by the glucose transporter, and with 300 mM glucose haemolysis is expected in about 30 minutes at 37°C. With 10 mM chloride and 300 mM glucose haemolysis occurred after about 20 minutes incubation (Figure 9). However, the lower concentrations of chloride at 0.8, 2 and 5 mM prevented haemolysis.
Only the curve with 0.8 mM chloride can be fitted by a model with two phase exponential decay (p-value 0.0324). However, flux A and B are reduced by 16 and 52%. The other curves are better fitted by one phase exponential decay. An interference of cation efflux and glucose transport might be a possible explanation for these observations.
The experiments about the salt efflux at low ionic strength suggested that cation channels are involved. The difference of flux A and flux B in time and magnitude, the dependence of the fluxes from the Nernst potential and different behaviour of the two fluxes against buffer concentrations suggested that at least two kinds of cation channels might be involved in these effects.
In order to test further properties of the possible channels we introduced the negatively charged sodium dodecylsulfate molecule, SDS, into the bilayer, which has been used to increase channel conductance [44]. SDS was shown to increase the currents through Na+ and Ca++ channels of cardiac myocytes. In the experiment of Turnheim, et al. [44] 20 µM SDS increased single channel conductance of rabbit colon BKCa channels by 33%.
The K+ efflux in 300 mM sorbitol and 0.8 mM chloride with the addition of SDS after one minute of the start of the experiment demonstrated increased potassium fluxes, which showed no trends to a plateau formation. Thus, the whole population of cells demonstrates an efflux of potassium.
A closer analysis by nonlinear regression with Graph PAD in Prism with a model of two exponential decays demonstrated that flux B decreased. After addition of 20 µM SDS the flux B was nearly absent. In contrast flux A was continuously present during the efflux period of 60 minutes.
This result can only be explained by the presence of two different channels for the cations, one has been activated by SDS, the other is inhibited.
The last part is devoted to the anion transport inhibitor DIDS. It has already been shown by George S Jones and Philip A Knauf [35] that DIDS blocked the cation loss at low ionic strength. The inhibition with 10 µM DIDS at the lowest chloride concentration of 2 mM was about 91%, whereas around 10 mM chloride only 73% and above 40 mM chloride there is no inhibition noticeable. The authors concluded that the anion exchanger AEP itself might act as a cation channel.
The curves show, that the oriented anion exchanger with 0.8 mM chloride outside after 1 minute is very sensitive to the DIDS molecule and demonstrates strong inhibition of cation efflux.
A mathematical analysis by non-linear regression with a model of two exponential decays shows that flux A and flux B are both strongly inhibited.
The Dixon-plot shows intercepts at the x-axis at very low DIDS concentrations of 0.02 and 0.025 µM DIDS, which correspond to the apparent Ki (Inhibitor concentrations required for 50% inhibition). The Ki-values of flux A and flux B are not significantly different; rather they can be interpreted as an indication for the result of binding to increased outward facing anion exchanger in the unloaded Eo form Furuaya W, et al. [45]. With H2DIDS at about equal concentrations of chloride inside and outside a Ki-value of 0.119 µM has been observed against a Ki-value of 0.052 µM Ki-value for cells with a large outwardly directed chloride gradient (10 mM chloride outside, temperature 0°C). According to Saul Ship, et al. [46] the rate of covalent reaction of DIDS was substantially faster than of H2DIDS, however, both reagents showed the same degree of inhibition of sulfate fluxes. So, their Ki-values might be comparable.
The slopes of the Dixon-plots for flux A and B are significantly different. This can be explained by the existence of two different cation channels. The comparably low Ki-values of 0.02 and 0.025 µM DIDS might, however, be the expression of a DIDS binding and inhibition of the anion conductance channel.
Common Pattern Found in Effects of Salt Efflux at Low Ionic Strength
All investigators cited, with the exception of Rudolf Mond [13], reported a salt efflux with shrinking of the volume of red cells incubated in an isotonic solution of non-electrolytes, like sucrose, glucose or sorbitol. There are species differences of red cells, best suited are human RBCs. Hugh Davson [10] came to the following order of RBC species: human > guinea-pig > rat > cat > ox (Cattle) > pig and rabbit.
A more recent and intensive study of Zeidler and Kim [38] obtained about the same order of RBC species, but divided the RBCs in high potassium and low potassium type RBCs (HK+- and LK+-type RBCs) with the order for the first type: human < guinea pig < rat < rabbit < newborn calf < newborn piglet and pig. In addition to Davson [10] are here the species of the calf and the newborn pig included, by which the red cells of the calf after about 10 minutes undergo haemolysis and then loose K+. The RBCs of the newborn pig show nearly no potassium loss at all, as does the adult pig.
The RBCs of the low potassium high sodium type (LK+-type) in cat < dog < cow and sheep (Nearly no loss) loose sodium in low ionic strength and are very prone to haemolysis.
The fast initial fluxes are sensitive to pH and react by higher pH-values with an increase in K+ efflux in human RBCs. In agreement with the reported data by Maizels [9], Davson [10], Passow [39], Zeidler and Kim [38], Krüger [40] and Bruness [41].
A central mechanism of the salt efflux at low ionic strength in RBCs is the anion exchanger band 3 or more recently named as Anion Exchanger Protein (AEP). It so far is unique among biological transporters due to its potential to translocate a wide repertoire of inorganic and organic anions. Most important for respiration is the enormously fast AEP exchange rate of HCO3- against Cl- , which takes place in the human red cells at 37°C with a very fast half time of about 0.3 seconds. The AEP is also the protein to equilibrate for the permeating anions according to the Donnan equilibrium.
On the basis of the thermodynamic theory of membrane equilibria Donnan [7] developed a prediction of distribution of non-permeating and permeating anions. An equation was set up by Van Slyke, et al. [47] describing the relationship between the composition of the medium and the ion distribution across a membrane permeable to H2O and small anions like Cl-, HCO3- and OH-, and impermeable to cations and a limited number of anions, such as negatively charged proteins, mainly the polyanion haemoglobin. Calculations were done with three assumptions:
- Electroneutrality on both sides of the membrane.
- Donnan equilibrium of diffusible anions: r = Clin/Clout= OHin/OHout etc.
- Osmotic equilibrium
By changing human RBCs incubated in an isotonic NaCl solution to an isotonic sucrose medium with only 1 mM chloride the potential of the RBCs is drastically changed from –10 mV to about +122 mV at 37°C. A new Donnan equilibrium is immediately obtained, and an alkalinization of the cell interior is induced. Most probably the positive potential acts as driving force for opening one or more cation channels (K+ and Na+ ) in the red cells and the AEP is responsible for an equimolar net efflux of anions to produce a salt efflux as has been measured by an increase in conductivity of the medium, osmotic determinations, efflux of K+ and Na+ by flame photometry, efflux of Cl- by chlorometry and isotope efflux and change of pH inside and outside of the red cells by all authors cited except Rudolf Mond [13].
The most drastic experiments to show the involvement of AEP come from Zeidler R and Kim HD in 1977 [38], who enzymatically lysed the anion exchanger in calf RBCs, which prevented alkalinization and haemolysis of the RBCs. A more gentle way to inhibit the anion exchanger is to use competitive inhibitors of the stilbene type, which do not permeate the red cells and compete with the binding site of the anion exchanger. It was Phil Knauf [34], who in his Ph. D. Thesis in 1970 was the first to use SITS to inhibit the K+ and Na+ permeability increase in low chloride media.
The results of Zeidler and Kim [38] showed in low potassium high sodium type blood cells that the alkalinization process was directly related to the anion exchanger band 3, the authors found a good correlation between the extent of haemolysis and integrity of the band 3 protein. When this protein was hydrolysed by proteolytic enzymes, haemolysis was progressively inhibited. Haemolysis in these mammalian RBCs could be completely prevented by SITS, an inhibitor of anion exchange.
In a subsequent publication by Jones GS and Philip A Knauf [35] about the mechanism of the increase in cation permeability of human RBCs in low-chloride media the authors demonstrated the involvement of the anion transporter by the use of DIDS. They plotted according to LaCelle and Rothstein [22] and Donlon and Rothstein [25] the fluxes of potassium against low chloride media on a logarithmic scale figure 42.
More interesting is the fact, that a quasi-linear straight line can also be drawn through the DIDS treated data points (Open squared points).
In the above figure 43 human RBCs washed in 150 mM chloride, 2.5 mM HEPES buffer pH 7.6 were exposed to a low chloride sucrose medium with 10 µM DIDS (Squares) at 37°C. DIDS inhibited the flux at the lowest 2 mM chloride concentrations with 91%, with 73% at 12.5 mM and no inhibition at 40 mM and higher chloride concentrations. The linear slope might be the result of a not DIDS sensitive pathway, whose origin is unknown as also the slope at very high chloride concentrations, which is not influenced by DIDS. Donlon A and Rothstein A [25] discussed in this respect at high chloride concentrations (45 mM and higher concentrations) that in this range of 0 to +45 mV the permeability at low ionic strength is independent of the potential.
For their very intensive investigations in sucrose media Knauf and Jones used a high 12.5 mM chloride concentration, which is not very sensitive to the membrane potential. Furthermore, they used a low pH of 6.5, in order to keep the pH inside constant and to prevent alkalization of the cell interior by the Donnan-equilibrium. Under these special conditions 10 µM DIDS inhibited the Cl- permeability by 83.6% and changed the membrane potential slightly from +50.6 to +47.6 mV, so that the positive membrane potential is still dominant even after DIDS treatment. However, the K+ flux after DIDS treatment was much lower than expected, by assuming that DIDS affects K+ efflux by changing the membrane potential only. In addition to its possible effects on membrane potential, DIDS might have a direct inhibitory effect on the K+ permeability which accounts for most or all of the decrease in K+ efflux. The data suggested to the authors that in low chloride media the anion selectivity of the anion exchanger itself was so far decreased, so that it can act as a very low-conductivity channel for cations. Na+, Rb+ as well as K+, could utilize this pathway.
In contrast to George S Jones and Philip A Knauf [35] Krüger K [40] and Bruness F [41] added DIDS one minute after the start with the human red blood cells, so that the fast exchange of anions by the anion exchanger had already been accomplished. In a medium with 300 mM sorbitol and 0.8 mM chloride at pH 7.4 DIDS reacts with the anion exchanger in the mainly outside facing conformation induced by the chloride gradient Cli > Clo .This would predict an increase in affinity of DIDS to the anion exchanger as shown by Furuaya W, et al. [45].
A mathematical analysis by non-linear regression with a model of two exponential decays shows that we could give indications under conditions with low ionic strength for the existence of a first fast K+ flux A and a slow second K+ flux B, which are both strongly inhibited by DIDS. Dixon-plots of the K+ fluxes A and B against the DIDS concentration gave straight lines with intercepts at the x-axis of 0.02 and 0.025 µM, demonstrating an extremely high affinity of DIDS for an outside oriented anion exchanger. The Ki-values of DIDS inhibition of flux A and flux B are not significantly different, showing the same substrate affinity. But the two cation fluxes differ significantly in their reaction parameters (Table 6). This result is in agreement with the existence of at least two different cation channels in human red cells, produced by the low ionic strength. In contrast, there is evidence for only one anion channel, namely the conductivity pathway of the anion exchanger AEP. This result is opposite to the predictions of Jones and Knauf [35], postulating an unselective anion/cation channel.
Already in the literature from 1990, Halperin JA, et al. [48], it was reported, that the cation permeability increased progressively as soon as the membrane potential in human red cells exceeds +20 mV inside positive. This result suggests that the voltage-activated cation transport pathway is not the result of non-specific dielectric breakdown of the lipid layer, but rather is related to some membrane components, presumably proteins, the identities of which have till to today not been resolved.
In summary, the cation permeability in low ionic strength can be explained by channels, which respond to a positive membrane potential in RBCs. There are at least more than two types of cation channels, and the conductivity pathway of the anion exchanger is in charge for the salt loss at low ionic strength. In addition, there is salt loss at high ionic strength at chloride concentrations more than 40 mM outside, the salt efflux by which seemed not to be dependent on positive electrical potential. There might also be a lower concentration range of chloride producing salt loss, which is not blocked by DIDS, and whose way of salt efflux is also unknown. The permeability ways for these salt losses are not yet determined.
Acknowledgment
It is a great pleasure to thank Professor Joseph Hoffman for his suggestion to write the above review and for support with literature.
References
- Gürber A. Salts of the Blood Bodies. Habilitation Thesis. Würzburg. Biochemical Journal. 1904;16:3-37.
- Bang I. Physico-chemical relationships of blood cells. Biochemische Zeitschrift. 1909;16:255-276.
- Höber R. Physical Chemistry of Cells and Tissues. 6th ed.1926; p. 478-480.
- Joel A. On the effect of certain indifferent narcotics on the permeability of red blood cells, Pflüger’s archive for the entire physiology of humans and animals. 1915;161:p. 5-44.
- Jacobs MH, Parpart AK. Osmotic properties of erythrocyte VI. The influence of the escape of salts on haemolysis by hypotonic solutions. Biol Bull Woods Hole. 1993 Dec;65(3):512-528.
- Ponder E, Saslow G. The measurement of red cell volume, III. Alteration of cell volume in extremely hypotonic solutions. J Physiol. 1931;73:267-296.
- Donnan FG. Theory of membrane equilibrium and membrane potential in the presence of nondialysing electrolytes. A contribution to physical-chemical physiology. Journal of Membrane Science. 1995 Mar 31;100(1):45-55.
- Netter H. About the electrolyte equilibrium in electively ion-permeable membranes and their biological significance. Pflüger’s archive. 1928;220:107-123.
- Maizels M. The permeation of erythrocytes by cations. Biochem J. 1935 Aug;29(8):1970-82. doi: 10.1042/bj0291970. PMID: 16745866; PMCID: PMC1266710.
- Davson H. Studies on the permeability of erythrocytes: The effect of reducing the salt content of the medium surrounding the cell. Biochem J. 1939 Mar;33(3):389-401. doi: 10.1042/bj0330389. PMID: 16746925; PMCID: PMC1264388.
- Wilbrandt W. The ion permeability of erythrocytes in dielectric solutions. Pflüger’s archive. Ges Physiol. 1940;246:537-556.
- Wilbrandt W. Osmotic methods for the determination of permeability constants on red blood cells in a physiological environment. Pflüger’s archive. 1938;241:289-301.
- Mond R. Reversal of the anion permeability of red blood cells into an elective permeability for cations. Pflügers Arch. Ges. Physiol. 1927;217:618-630.
- Michaelis L. Contribution to the Theory of Permeability of Membranes for Electrolytes. J Gen Physiol. 1925 Sep 18;8(2):33-59. doi: 10.1085/jgp.8.2.33. PMID: 19872189; PMCID: PMC2140746.
- Davson H, Danielli JF. Studies on the permeability of erythrocytes: The alleged reversal of ionic permeability at alkaline reaction. Biochem J. 1936 Feb;30(2):316-20. doi: 10.1042/bj0300316. PMID: 16746021; PMCID: PMC1263400.
- SKOU JC. The influence of some cations on an adenosine triphosphatase from peripheral nerves. Biochim Biophys Acta. 1957 Feb;23(2):394-401. doi: 10.1016/0006-3002(57)90343-8. PMID: 13412736.
- Post Rl, Merritt CR, Kinsolving CR, Albright CD. Membrane adenosine triphosphatase as a participant in the active transport of sodium and potassium in the human erythrocyte. J Biol Chem. 1960 Jun;235:1796-802. PMID: 14434402.
- Glynn IM. Sodium and potassium movements in human red cells. J Physiol. 1956 Nov 28;134(2):278-310. doi: 10.1113/jphysiol.1956.sp005643. PMID: 13398911; PMCID: PMC1359203.
- Knauf PhA. Erythrocyteanion exchange and the band 3 protein. Current topics in membranes and transport. 1979;12:249-363.
- Wilbrandt W, Schatzmann HJ. Changes in the passive cation permeability of erythrocytes in low electrolyte media, Ciba Found. Study Group. Symposium No. 5. Regulation of the Inorganic Ion Content of the Cells. 1960 Jan 1;p. 34-40.
- Gun RG, Fröhlich O. In Methods in Enzymology. 1989; 173: p. 63.
- LaCelle PL, Rothsteto A. The passive permeability of the red blood cell in cations. J Gen Physiol. 1966 Sep;50(1):171-88. doi: 10.1085/jgp.50.1.171. PMID: 5971026; PMCID: PMC2225641.
- Harris EJ, Maizels M. Distribution of ions in suspensions of human erythrocytes. J Physiol. 1952 Sep;118(1):40-53. doi: 10.1113/jphysiol.1952.sp004771. PMID: 13000689; PMCID: PMC1392423.
- DonlonJA. Passive Cation Efflux from Human Erythrocytes Suspended in Low Ionic Strength Media. The University of Rochester. 1968.
- Donlon JA, Rothstein A. The cation permeability of erythrocytes in low ionic strength media of various tonicities. J Membr Biol. 1969 Dec;1(1):37-52. doi: 10.1007/BF01869773. PMID: 24174041.
- Cabantchik ZI, Rothstein A. Membrane proteins related to anion permeability of human red blood cells. I. Localization of disulfonic stilbene binding sites in proteins involved in permeation. J Membr Biol. 1974;15(3):207-26. doi: 10.1007/BF01870088. PMID: 4838037.
- Steck TL. The band 3 protein of the human red cell membrane: a review. J Supramol Struct. 1978;8(3):311-24. doi: 10.1002/jss.400080309. PMID: 364194.
- Klocke RA. Rate of bicarbonate-chloride exchange in human red cells at 37 degrees C. J Appl Physiol. 1976 May;40(5):707-14. doi: 10.1152/jappl.1976.40.5.707. PMID: 931897.
- Crandall ED, Klocke RA, Forster RE. Hydroxyl ion movements across the human erythrocyte membrane. Measurement of rapid pH changes in red cell suspensions. J Gen Physiol. 1971 Jun;57(6):664-83. doi: 10.1085/jgp.57.6.664. PMID: 5576765; PMCID: PMC2203127.
- Cotterrell D, Whittam R. The influence of the chloride gradient across red cell membranes on sodium and potassium movements. J Physiol. 1971 May;214(3):509-36. doi: 10.1113/jphysiol.1971.sp009446. PMID: 4996368; PMCID: PMC1331852.
- Wieth JO, Dalmark M, Gunn RB, Tosteson DC. The transfer of monovalent inorganic anions through the red cell membrane. In Erythrocytes, Thrombocytes, Leukocytes. E. Gerlach, K. Moser, E. Deutsch and W. Willmanns editors. Stuttgart: George Thieme Publishers; 1973. p. 71-76.
- Dalmark M, Wieth JO. Temperature dependence of chloride, bromide, iodide, thiocyanate and salicylate transport in human red cells. J Physiol. 1972 Aug;224(3):583-610. doi: 10.1113/jphysiol.1972.sp009914. PMID: 5071931; PMCID: PMC1331511.
- Fuhrmann GF, Dernedde S, Frenking G. Phloretin keto-enol tautomerism and inhibition of glucose transport in human erythrocytes (including effects of phloretin on anion transport). Biochim Biophys Acta. 1992 Sep 21;1110(1):105-11. doi: 10.1016/0005-2736(92)90300-b. PMID: 1390829.
- Knauf PA. Modification of anion and cation permeability of the human red cell membrane by amino and sulfhydryl reactive reagents. University Rochester, NY. 1970. p.132.
- Jones GS, Knauf PA. Mechanism of the increase in cation permeability of human erythrocytes in low-chloride media. Involvement of the anion transport protein capnophorin. J Gen Physiol. 1985 Nov;86(5):721-38. doi: 10.1085/jgp.86.5.721. PMID: 4067572; PMCID: PMC2228814.
- Knauf PA, Law FY, Tarshis T, Furuya W. Effects of the transport site conformation on the binding of external NAP-taurine to the human erythrocyte anion exchange system. Evidence for intrinsic asymmetry. J Gen Physiol. 1984 May;83(5):683-701. doi: 10.1085/jgp.83.5.683. PMID: 6736916; PMCID: PMC2215659.
- Knauf PA, Fuhrmann GF, Rothstein S, Rothstein A. The relationship between anion exchange and net anion flow across the human red blood cell membrane. J Gen Physiol. 1977 Mar;69(3):363-86. doi: 10.1085/jgp.69.3.363. PMID: 15047; PMCID: PMC2215016.
- Zeidler RB, Kim HD. Effects of low electrolyte media on salt loss and hemolysis of mammalian red blood cells. J Cell Physiol. 1979 Sep;100(3):551-61. doi: 10.1002/jcp.1041000317. PMID: 39943.
- Passow H. Passive ion permeability and the concept of fixed charges. Proc. XXIII. Int’l Conf. Physiol Sc. Tokyo 555. 1965.
- Krüger KD. Kationenpermeabilität von Erythrozyten bei niedriger Ionenstärke unter besonderer Berücksichtigung des Glucosetransporters.Inaugural Dissertation. Universität Marburg. 1999.
- Bruness G, Götzky F. Kationenpermeabilität von Erythrozyten bei niedriger Ionenstärke in Abhängigkeit bestimmter Anionen und Inhibitoren unter besonderer Berücksichtigung des Glucosetransporters. Inaugural Dissertation. Universität Marburg. 2003.
- SEN AK, WIDDAS WF. Determination of the temperature and pH dependence of glucose transfer across the human erythrocyte membrane measured by glucose exit. J Physiol. 1962 Mar;160(3):392-403. doi: 10.1113/jphysiol.1962.sp006854. PMID: 13910603; PMCID: PMC1359552.
- Fuhrmann GF, Götzky F, Krüger K, Martin HJ, Völker B. Cation permeability of red blood cells at low ionic strength, abstract T24, 12th Meeting of the European Association for Red Cell Research, Otzenhausen Germany. 1999.
- Turnheim K, Gruber J, Wachter C, Ruiz-Gutiérrez V. Membrane phospholipid composition affects function of potassium channels from rabbit colon epithelium. Am J Physiol. 1999 Jul;277(1):C83-90. doi: 10.1152/ajpcell.1999.277.1.C83. PMID: 10409111.
- Furuya W, Tarshis T, Law FY, Knauf PA. Transmembrane effects of intracellular chloride on the inhibitory potency of extracellular H2DIDS. Evidence for two conformations of the transport site of the human erythrocyte anion exchange protein. J Gen Physiol. 1984 May;83(5):657-81. doi: 10.1085/jgp.83.5.657. PMID: 6736915; PMCID: PMC2215654.
- Ship S, Shami Y, Breuer W, Rothstein A. Synthesis of tritiated 4,4’-diisothiocyano-2,2’-stilbene disulfonic acid ([3H]DIDS) and its covalent reaction with sites related to anion transport in human red blood cells. J Membr Biol. 1977 May 12;33(3-4):311-23. doi: 10.1007/BF01869522. PMID: 864693.
- Van Slyke DD, Wu H, McLearn FC. Studies of Gas and Electrolyte Equilibria in the Blood: V. Factors Controlling the Electrolyte and Water Distribution in the Blood. J Biol Chem. 1923 July 1;56(3):765-849. doi: 10.1016/S0021-9258(18)85558-2.
- Halperin JA, Brugnara C, Van Ha T, Tosteson DC. Voltage-activated cation permeability in high-potassium but not low-potassium red blood cells. Am J Physiol. 1990 Jun;258(6 Pt 1):C1169-72. doi: 10.1152/ajpcell.1990.258.6.C1169. PMID: 1694398.
Content Alerts
SignUp to our
Content alerts.
 This work is licensed under a Creative Commons Attribution 4.0 International License.


