> Medicine. 2020 November 23;1(7):334-342. doi: 10.37871/jbres1164.
-
Subject area(s):
- Pharmacology
- Therapeutics
The Kinetics of Glucose Transport in Human Red Blood Cells Depend on Their Metabolic State
Günter Fred Fuhrmann*
This article about freshly drawn human red blood cells offers new insights in regulation of glucose transport. Transport of glucose in Glut1 red blood cells is highly asymmetric and depend on metabolic energy, most probably ATP. The changes in “Km” for efflux and Vm obtained by ATP depletion of the cells are completely restored by incubation with adenosine, a substrate for ATP generation.
The glucose efflux in red cells is much higher than influx. The high amounts of the red cells in the blood (About 45%) provide by their efficient efflux system of more than 1000 mmol glucose/L cells/ min. support of glucose toward the peripherical cells as well as supply with oxygen.
Wilbrandt’s general rate equation including osmometer behavior of the red blood cells and the solvation of the transport resistance with the individual parameters, including the turnover of the unloaded carrier is detailed mathematically explained. It is to memorize Walther Wilbrandt and a history of his contribution to the glucose transport in human red cells.
The integrated rate equation describes perfectly the data obtained by right-angular light-scattering. Wilbrandt’s transport scheme can be used to calculate the turnover of the unloaded carrier. At 20°C a turnover of about 1000 molecules per sec. has been calculated, which might be interpreted as the oscillations of the empty carrier.
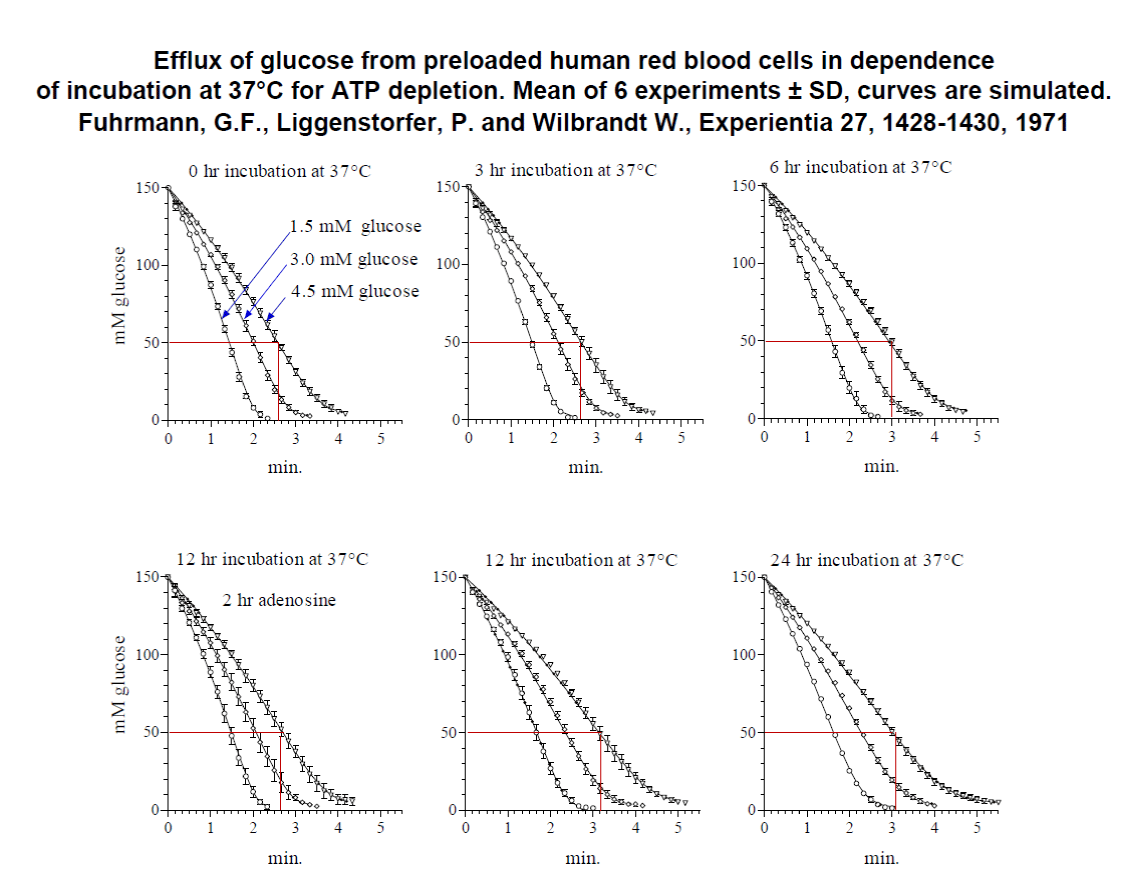
The kinetics of glucose efflux at 20°C has been investigated nearly 50 years ago at controlled conditions [1]. Only freshly drawn defibrinated human red blood cells were used and incubated at 37°C up to 24 hours without substrate to decrease intracellular ATP content [2] and to increase the cell volume. The increase in electrolyte content (n) and the cell volume (VH2O) was continuously measured. The glucose efflux at 20°C was determined at three outside concentrations of 1.5, 3.0 and 4.5mM glucose by a right angular light-scattering method. Because of the dilution of the red cells 1:1000 the outside concentration of glucose is kept nearly constant. By this method the inside concentration of glucose (Si) is measured during glucose exit. For demonstration see figure 6.
In 1971 we demonstrated by incubation of the cells at 37°C an increase in electrolyte content and volume of red cells and a decrease in the permeation rate for glucose at 20°C. By treatment of the red cells with adenosine, a substrate for ATP generation, the electrolyte content and volume were normalized and the penetration rate completely reversed [1].
In this investigation an extensive reanalysis of the experimental data offered new insights in regulation of glucose transport. The signal of the right-angle light-scattering is directly proportional to the concentration of hemoglobin in the cells [3]. The average of hemoglobin concentration in an adult human red cell is 32 - 36 pico-g with an average volume of 90 femto-Liter. The method of right-angle light-scattering allows the calculation of the erythrocyte volume which is proportional to an occurring substrate change, for example glucose concentration, during an efflux experiment with 150 mM glucose inside in a 450mOsm exit solution for compensation of the osmotic pressure inside the cells.
Calibration of the signal was done by changing the volume of control cells without inside glucose in the 300mOsm buffer solution by addition of a 5M NaCl solution in steps to reach the 450mOsm concentration of the glucose exit solution. The values of the steps were used to calculate the inside concentration of glucose obtained by the glucose exit experiment [1,3].
It was found later, that in addition to the concentration of hemoglobin the signal of light- scattering changed more than expected by the inside pH of the cells. For example, it was found in glucose exit experiments at 20°C with human red cells loaded with 150 mM glucose in 20 mM Hepes buffer with 225mM NaCl, in order to compensate for the inside glucose concentration, by increasing the outside pH from 6.5 to 7.4 and from pH 7.4 to 8.5 that the signal increased linearly with a slope of 1.48. This is twice the slope expected from a resting pH inside, which was linearly dependent on extracellular pH, with a slope of 0.77 under similar condition [4]. The calibration with 5M NaCl by the addition of chloride anions disturb the anion equilibrium and thus changes the inside pH of the cells. This leads in some experiments to an underestimation of glucose concentration inside the cells. Therefore, the native signal obtained by the efflux was taken to be directly proportional to the inside glucose concentration. For justification, the curves obtained by simulation of the efflux with the integrated rate equation are indistinguishable from the obtained experimental curves (see figure 6). The calculated curves fit exactly the middle values of the experimental data.
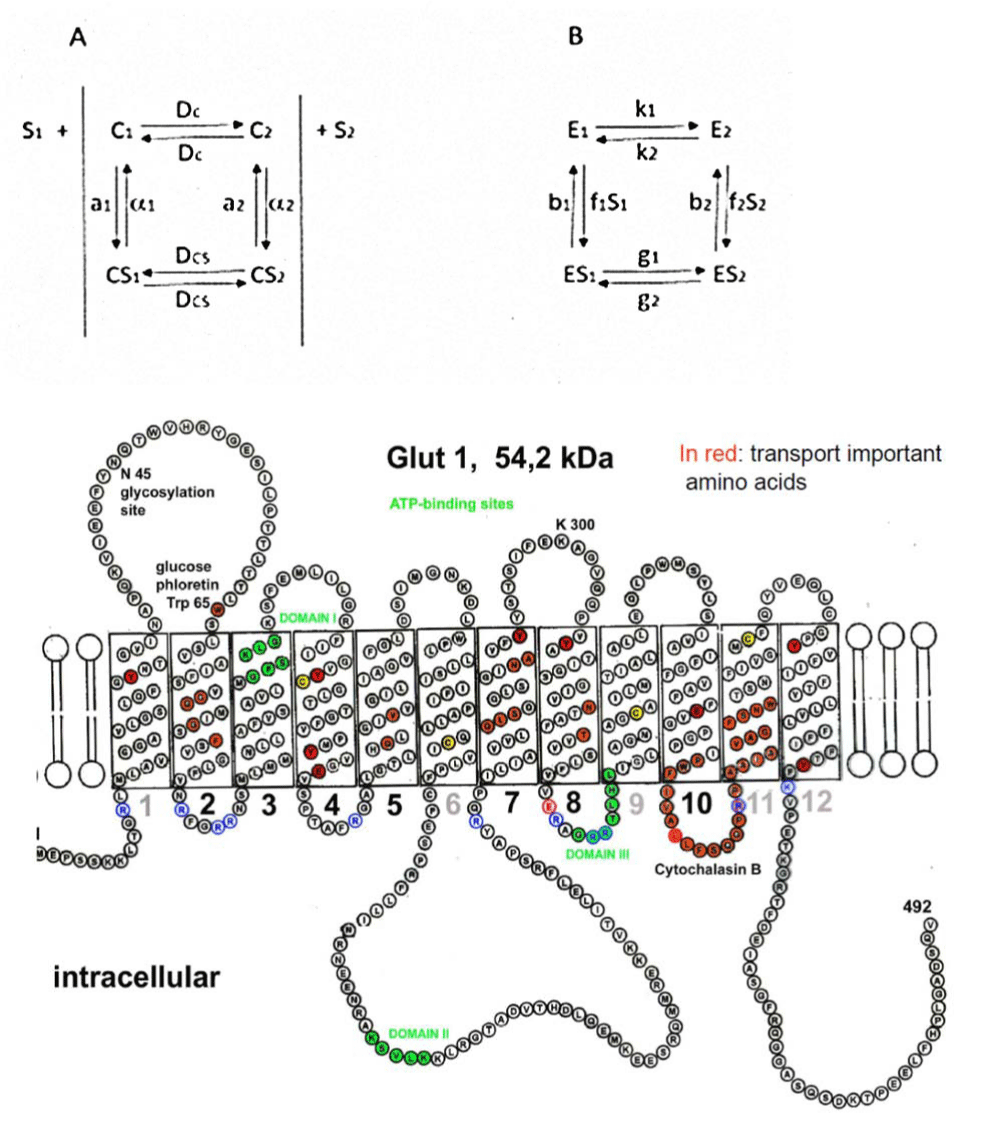
The mathematical model taken for the glucose efflux experiments is derived from a steady state treatment under general conditions including finite reaction rates between the substrate glucose and carrier (possibly different on the two sides of the membrane but necessarily identical in their ratios), developed by Walther Wilbrandt 1969 and published 1972 [5]. The model of Walther Wilbrandt is shown at A and that of B by Lieb WR and Stein WD [6]. Both are a four-state models, but with 8 different velocities in B instead of 6 in the model A of Wilbrandt. Wilbrandt used for C the abbreviation for carrier, wherefore Lieb and Stein preferred E for the same carrier. Both used for the substrate S (Glucose for example). By Wilbrandt is S1 the substrate outside of the membrane and S2 the substrate at the inside and bound to the carrier C inside and outside. Lieb and Stein used also S1 and S2 for the substrate, but opposite to Wilbrandt inside and outside in connection with the rate f1 and f2 bound to the substrate S1 and S2. Further differences are in both models [5,6] the nomination of the rates of unloaded and loaded carrier. Wilbrandt labelled with DC and DCS the unloaded and loaded carrier, equal in rates for both directions, Lieb and Stein used different rates k1 and k2 for the unloaded carrier in both directions and g1 and g2 those for the loaded carrier. Wilbrandt took for the apparent equilibrium constant K = a1/α1 = a2/α2 [5] and Lieb and Stein used for K = k1/f1 + k2/f2 + b1k1/f1g1 [6], thus the mathematics are different.
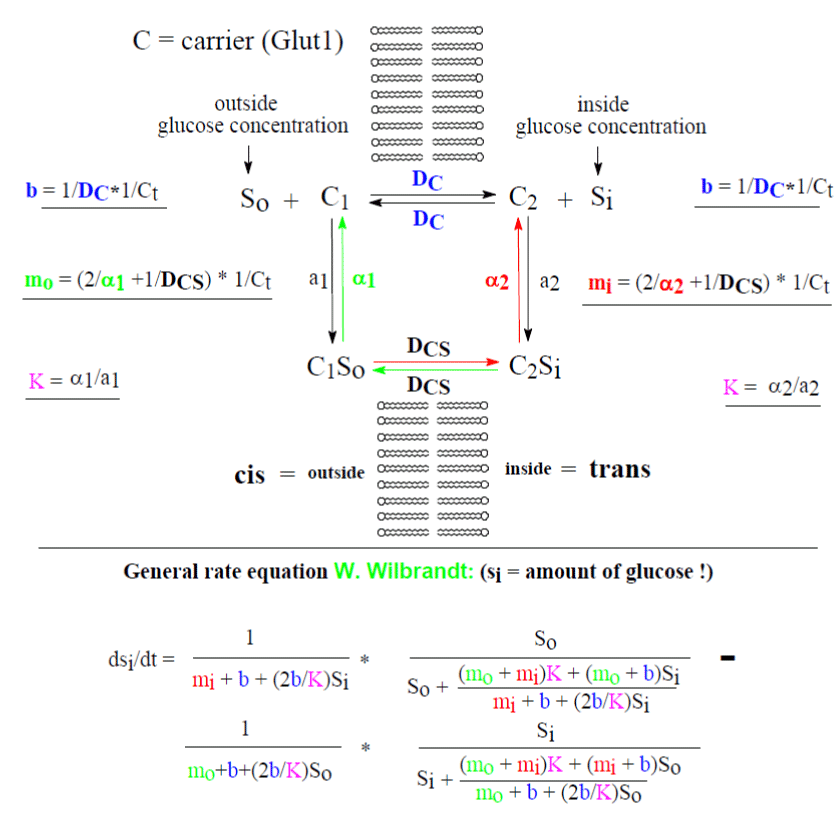
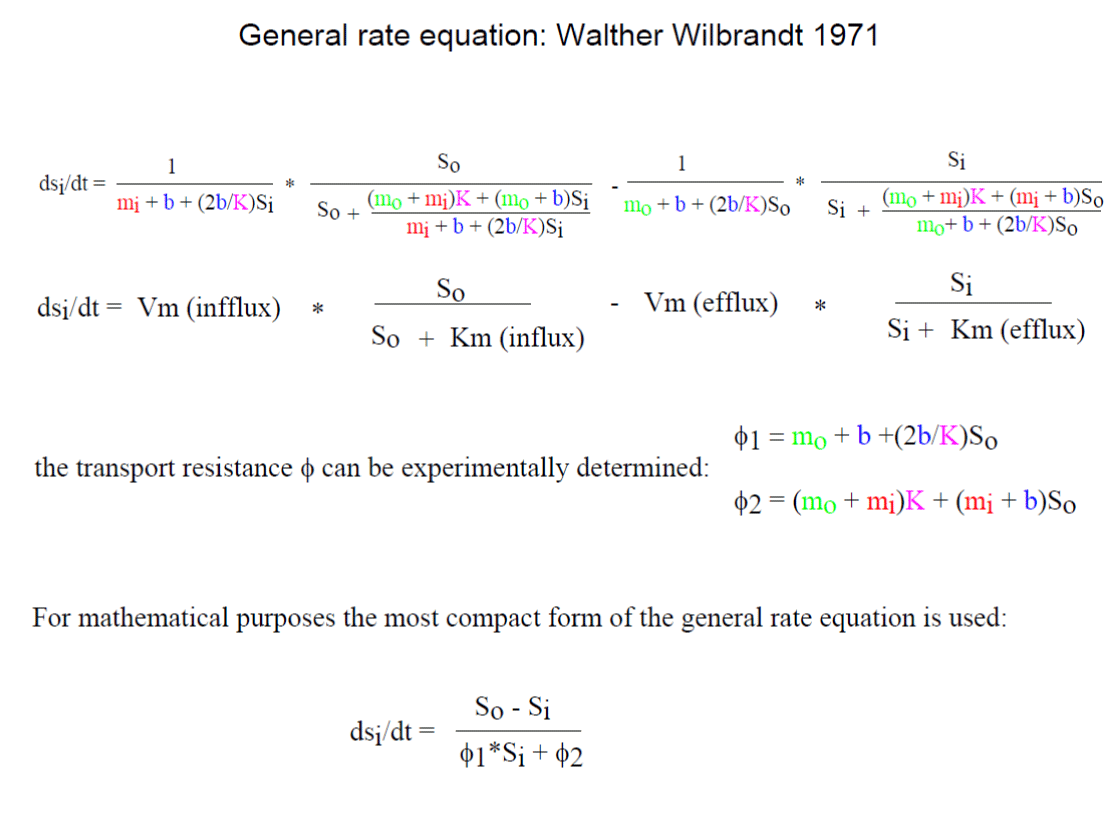
The general rate equation of Wilbrandt (Figures 1-3) offers the possibility to determine the velocity constant DC of the unloaded carrier (Within b) and the combined velocity constants α2 and DCS of the loaded carrier (Within mi) and α1 and DCS (Within mo). Significant differences of mi against mo have already demonstrated and explain considerable asymmetry of transport [3,5,7].
In this investigation by reanalysis of experimental data from 1971 [1] a significant change of mi with the metabolic state of the red blood cells is shown. The reciprocal values of mi, mo and b are expressed as fluxes in mmol glucose/L cells/min or for b changes according to mmol glucose/ L cells/ min. The change in mi influences only the “Km” of the efflux and Vm of the influx (Tables 1, 2 and figures 2, 3). Both parameters are completely restored in fresh cells by adenosine, a substrate of ATP generation in the cells (Table 1 and figure 7).
Table 1: Parameter of glucose transport in human red blood cells at 20°C. |
|||||
| Glucose transport in fresh and incubated human blood cells |
Km influx mM |
Vm influx mm/L/min. |
Km efflux mM |
Vm efflux mm/L/min. |
K mM |
| fresh cells, 9. 6.1969 | 2.09 | 31.10 | 10.42 ± 2.46 | 142,40 | 2.02 |
| fresh cells, 16.7 1969 | 3.16 | 31.40 | 12.48 ± 2.86 | 138.40 | 3.42 |
| 3 hr. 37°C, 9. 6.1969 | 2.33 | 33.10 | 11.33 ± 1.05 | 132.00 | 2.33 |
| 6 hr. 37°C, 9. 6.1969 | 2.86 | 29.30 | 13,63 ± 1.20 | 145.10 | 2.86 |
| 12 hr. 37°C, 9. 6.1969 | 2.17 | 21.40 | 15,11 ± 1.35 | 149.50 | 2.18 |
| 12 hr. 37°C, 16.7.1969 | 2.66 | 24.50 | 15.56 ± 2.31 | 143.10 | 2.66 |
| 24 hr. 37°C, 9. 6.1969 | 2.66 | 15.90 | 24.33 ± 2.11 | 162.00 | 2.73 |
| 30 mM adenosine |
|
|
|
|
|
| 12 hr. 37°C, 2 hr. adenosine | 2.36 | 31.10 | 10.60 ± 1.17 | 138.10 | 2.34 |
| 12 hr. 37°C, 4 hr. adenosine | 3.01 | 35.60 | 10.53 ± 1.09 | 131.20 | 3.13 |
| 20 hr. 37°C, 1.5 hr. adenosine | 3.04 | 25.30 | 13.56 ± 0.98 | 127.00 | 3.27 |
Table 2: Velocity constants of glucose transport in red blood cells at 20°C. |
||||
| Glucose transport in fresh and incubated human blood cells |
K mM |
1/mi mm/L/min. |
1/mo mm/L/min. |
1/b changes mm/L/min. |
| fresh cells, 9. 6.1969 | 2.02 | 34.20 | 245.30 | 339.30 |
| fresh cells, 16.7 1969 | 3.42 | 37.00 | 423.10 | 208.00 |
| 3 hr. 37°C, 9. 6.1969 | 2.33 | 33.10 | 229.30 | 310.90 |
| 6 hr. 37°C, 9. 6.1969 | 2.86 | 29.30 | 410.00 | 224.50 |
| 12 hr. 37°C, 9. 6.1969 | 2.18 | 23.10 | 303.10 | 294.90 |
| 12 hr. 37°C, 16.7.1969 | 2.66 | 26.80 | 287.10 | 285.40 |
| 24 hr. 37°C, 9. 6.1969 | 2.73 | 16.70 | 445.10 | 254.70 |
| 30 mM adenosine |
|
|
|
|
| 12 hr. 37°C, 2 hr. adenosine | 2.34 | 34.90 | 269.30 | 283.20 |
| 12 hr. 37°C, 4 hr. adenosine | 3.13 | 42.20 | 307.80 | 228.80 |
| 20 hr. 37°C, 1.5 hr. adenosine | 3.27 | 29,20 | 399.40 | 186.20 |
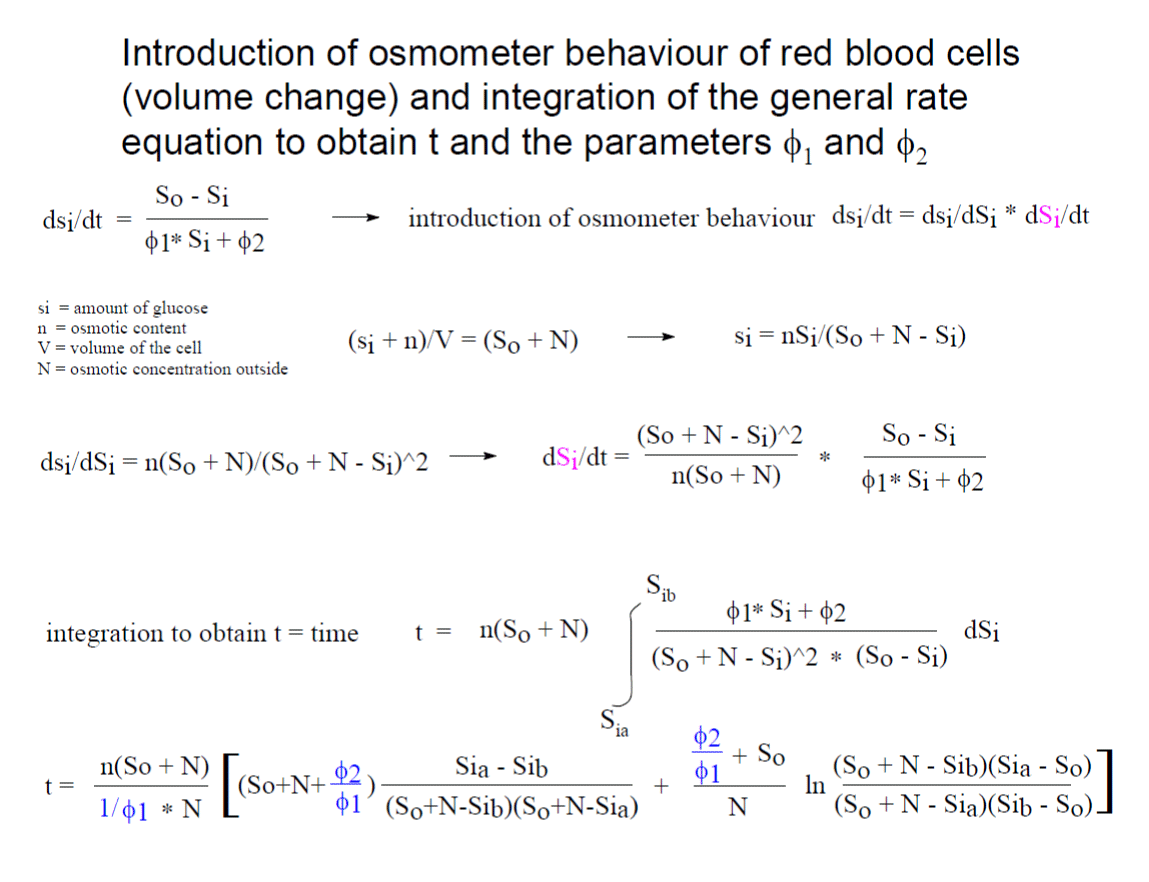
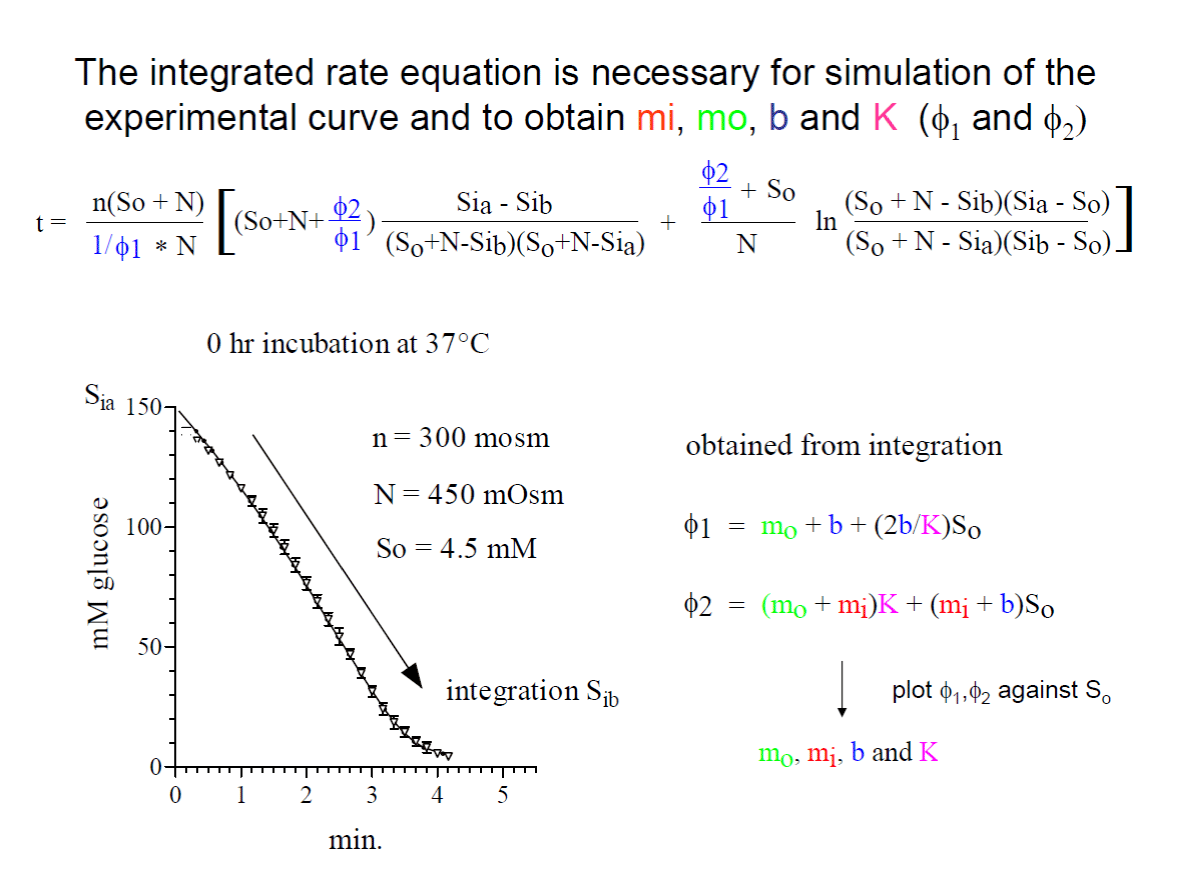
I can only demonstrate in this publication the way of solvation. W. Wilbrandt used from the above equation the penetration fraction [(Sia – Sib)/ (So + N - Sib)*(So + N - Sia)] and labelled it b and the logarithmic term ln, in the above integrated equation, he labelled B. A plot of t/b against B/b yields a linear equation with two intercepts. The intercepts, one at the negative site of the abscissa, is called β and the second at the ordinate α. At the point - β, t/b is zero, this results in - β = [(So + N)* ϕ1 + ϕ2 / (ϕ1Sa + ϕ2)]*N. At the point α, B/b is zero, and α = n*(So + N)/N)*((So + N)* ϕ1 + ϕ2). By finally dividing α/-β the result shows the determination of ϕ1 and ϕ2.
ϕ1 = [(α/n(So+N))*((-β-N)/-β)]
ϕ2 = [(α/n(So+N))*((N(So + N) + βSo)/-β)]
The calculation can easily be done by using electronic spreadsheets for example “Excel” and for the linear regression the computer program “in prisma”.
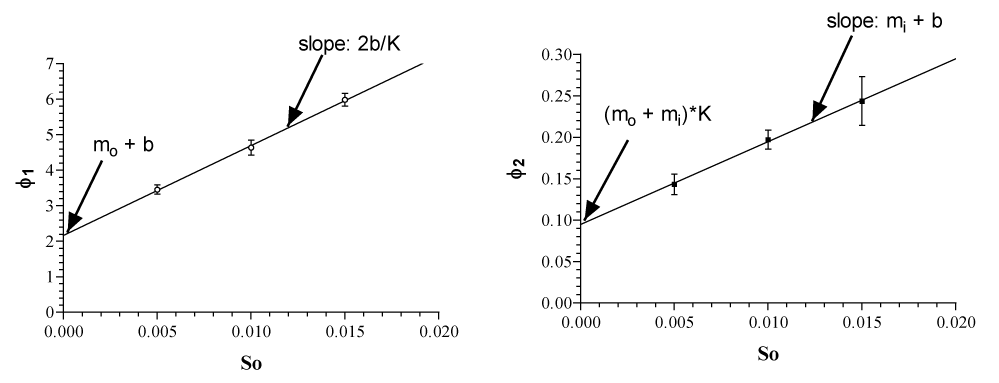
Another difficulty is to calculate the transport parameters mo, mi, b and K from ϕ1 and ϕ2. This has been solved very elegantly by Walther Wilbrandt by two linear plots of ϕ1 and ϕ2. So, the outside concentration of glucose (See figure 5a).
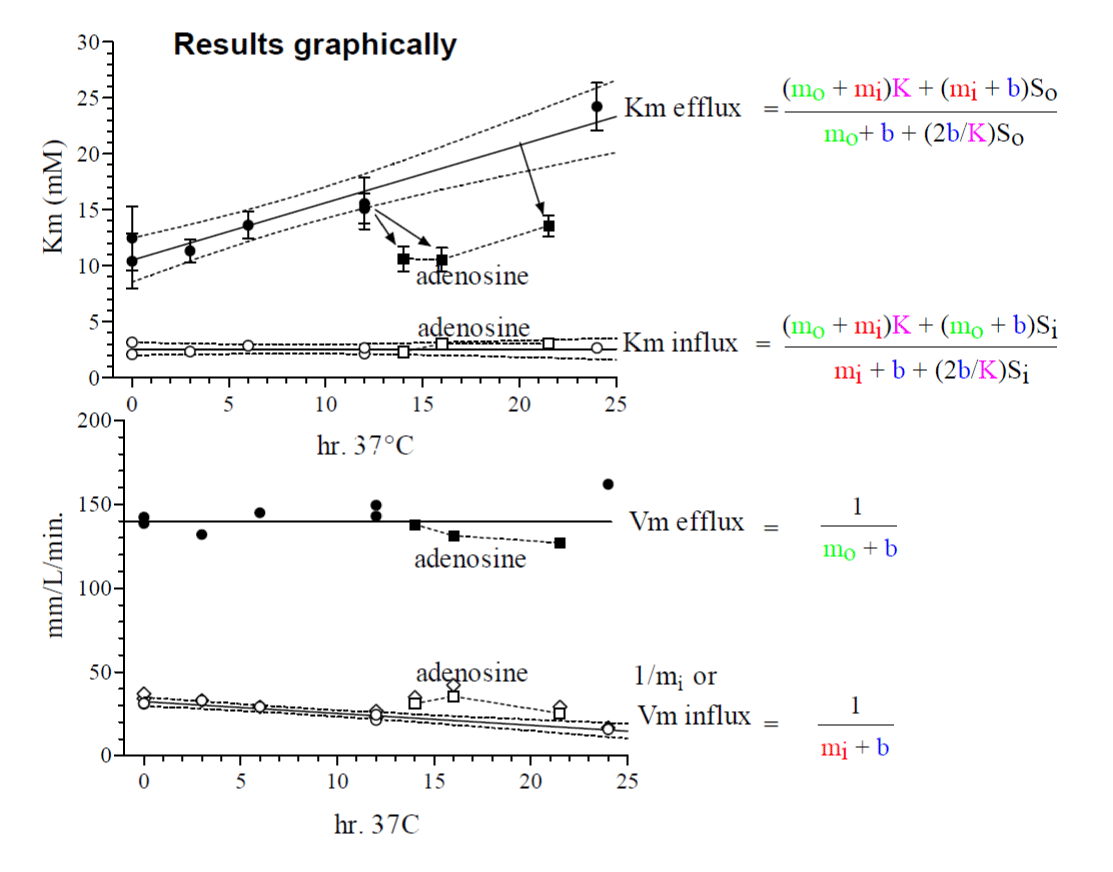
Table 1 shows the parameter of glucose transport at 20°C calculated from the integrated rate equation. The Km for influx is around 2 to 3 mM with no significant changes from fresh cells to incubated cells, nor with those of adenosine treatment. By the Sen-Widdas procedure a comparable Km value of 2.3 mM is obtained [3,7]. It is practically the same value as in K.
In contrast the Km of efflux behaves differently. Fresh cells have a Km of about 10mM, which increases significantly by continuous incubation at 37°C to about 24 mM. It is reduced again by adenosine treatment to that of fresh cells with about 10 mM.
The Vm values of influx and efflux behave significantly different. In fresh cells Vm influx is 31 mm/L cells pro min. and decreases by a 24 hr. 37°C incubation to about 16mm/L cells pro min. Incubation with adenosine restores Vm of influx to around 31 mm/L cells pro min. In contrast to the influx the efflux is in fresh and adenosine treated cells is about 4.4 times higher with about 142 to 138 mmoles/L cells pro min. and there is no significant decrease during incubation at 37°C. This result is shown graphically in figure 7 (Upper and lower graph).
Table 2 value of 1/b = 1/Dc * 1/Ct offered the possibility to calculate the turnover number of the unloaded carrier Dc in sec^-1. The number of Glut1 copies Ct per human red cell has been determined with 250 000 [10]. Since there is no systematic change in the 10 values of t/b in table 2, the average value of 261.5 ± 49.1 mm /L cells /min. (mean ± SD) has been taken for calculation of DC.
The average volume per red cell is 90* 10^-15 femtoLiter, the number of cells per L cells results in 1,1111* 10^13 cells. By dividing 0.2615 mol glucose/L cells/ min through 1.1111* 10^13 cells, the result is 2.3535* 10^-14 m /cell /min. per sec. = 3.9225* 10^-16. Multiplicated with 6.02* 10^23 (molecules/mol) gives the result of 236134500 molecules /cell / sec. By divided through the number of carrier (250 000) the turnover rate of DC is 944.53 molecules per sec.
By comparing the above turnover rate with the turnover rate of Vm of the efflux in fresh cells (Table 1, middle value of fresh cells = 140,4 mm /L cells /min). A turnover value of 507.12 molecules glucose per sec. has been obtained. This value is very close to that of W. D. Stein at 20°C for glucose efflux given in table 4.2 [11] with the rate of 600 molecules.
The value for the Vm of the influx of glucose with 31.25 mm /L cells / min. is significant smaller as the efflux with a turnover rate of 112.9 molecules glucose per sec.
In memory to Walther Wilbrandt and a history of his contributions to the glucose transport in human red blood cells
In January 1968, I came from Rochester NY, the Department of Radiation Biology and Atomic Energy Project of the University Rochester, to Switzerland to the Department of Pharmacology at the University Berne. My teacher of Membrane Biophysics, Aser Rothstein, has send me to his friend Walther Wilbrandt, by whom he has spent a sabbatical and he mentioned his special knowledge about kinetics of membrane transport.
Walther Wilbrandt was the first scientist who demonstrated experimentally a counter transport experiment with sugars in human red blood cells. His assumption was: The penetration of a substrate, for example glucose, reacts with a carrier in a first enzymatic reaction at the surface of the membrane. In that time nothing was known about the biology of those hypothetical carrier. Wilbrandt expected the carrier to be a protein. The kinetics were similar to enzymes, which he has probably learned by Leonor Michaelis and Maud Menten in New York. His mathematics were surely influenced by his brother in law, Thomas Rosenberg. He was also influenced by his doctor father, Rudolf Höber, who teaches that the reaction of cells can be explained by Physical Chemistry. From the data of his experiments he excluded transport by diffusion and he found similar as in enzymes transport inhibition by enzymatic inhibitors.
The red blood cells can easily be obtained by venous puncture, Wilbrandt did this often by himself with a special needle from above the venae and the help of an Assistant to hold the tube, which was filled with his blood. In later times he got the blood from the Swiss blood bank.
My friend, Peter Liggensdorfer and I had the pleasure to be lectured in transport kinetics by Walther Wilbrandt. He explained us at first the genial Sen-Widdas technique, to calculate from the exit time of glucose in red cells the transport parameter Km of influx. The Km-value of the influx is obtained from a linear plot of the outside concentrations of glucose at the abscise against the exit time at the y-axis. The intercept on the negative x-axis is the outside concentration which would double the exit time compared with that into a glucose-free solution which is the Km-value of influx.
My special interest was evoked by a rectangular light-scattering apparatus developed by S. L. Orskov in 1937. In a 15 ml cuvette only a few red blood cells in movement by a magnetic flea scatter the incoming light to a rectangular positioned sensitive photomultiplier tube. The red blood cell contains about 300000 molecules of hemoglobin. Wilbrandt calculated with me, that the refraction index of hemoglobin caused the electric signal detected by a recorder. It has been found that the light beam passed through the cell suspension varies in light intensity in direct proportion to the change in cell volume. Net changes of osmotically active contents inside the red blood cell are accompanied by an osmotic water flow and reflected by a proportional change in cell volume. Movement of water is extremely fast with half-times of a few milliseconds, it does not become a limiting factor in transport studies of substrates, which usually permeate a few orders of magnitude slower than water.
Since I had already experience in construction of a water jacket, to keep temperature constant in a cell electrophoresis apparatus, and there was a good workshop in the Department of Pharmacology with an excellent master, Mr. Buser, how was a specialist in Plexiglas, we tried to construct a water jacket for the light-scattering apparatus. We build a new 15 ml cuvette with two quartz glass windows at right angle and enclosed the white Plexiglas with a black Plexiglas water jacket to avoid light from the outside. Now we were able to run transport studies at definite temperatures. This apparatus allowed experiments with only a few µl red blood cells diluted by more than 1000-fold. One can easily calculate that the exit of glucose from these few cells does not change significantly the glucose outside concentration during an efflux experiment. By introducing nearly plain cells from a small tube, it was even possible to run experiments with nearly zero glucose outside. Most transport equation can only be solved when the outside concentration of substrate is nearly constant. This is not so, when using high concentration of cells, were the inside and outside concentration for example glucose changes.
The exit curves, for example in figure 6, showed a typical shoulder, different from those curves with radioactive labelled glucose ore those obtained by Wilbrandt’s osmotic method. Peter Liggensdorfer and I we had a vivid discussion in Wilbrandt’s home. But finally Wilbrandt helped us to find the right equation. In the light-scattering apparatus we determined the concentration change of glucose in the cells. This is very different in experiments where the amount of glucose is measured.
Wilbrandt advised us to use a differential equation: dsi/dt = dsi/dSi * dSi/dt, to change from the amount of substrate, si, per time to the concentration Si per time. The result is shown in figure 4 were osmometer behavior of the red cells is introduced. The integration now of the full general rate equation with osmometer behavior results in a curve which is not distinguee from the experimental data with a shoulder obtained by the light-scattering method (see figure 6).
Walther Wilbrandt died in his home in Berne at July 25, 1979. He has never known the structure of the glucose carrier Glut1 and all the news about the new molecular biology of his carrier [8,9]. But without his advices, the results as shown above, were not possible. I have saved his calculations and the many experimental results we made in Switzerland. I wrote this down, because otherwise it will be lost forever.
Transport of glucose in Glut1 red blood cells is highly asymmetric and seems to be dependent on metabolic energy, most probably ATP.
Freshly drawn cells showed a “Km” for efflux at 20°C of 11.8 ± 2.7 mM and for influx of 2.6 mM. Continuous incubation at 37°C (depletion of ATP) increases “Km” of efflux. For example, a 24 hr incubation results in a “Km” for efflux of 24.2 ± 2.1 mM with no significant change in the “Km” for influx. Vm for influx decreases from 31.3 to 15.9 mmoles glucose/L cells/min.
These changes in “Km” for efflux and Vm for influx are completely restored by incubation of the red blood cells with 30 mM adenosine, a substrate for ATP generation in red blood cells.
The red blood cells are in equilibrium with plasma glucose of about 4 to 6 mM. Cell metabolism is much slower than transport. From experimental standpoint an initial uptake experiment is not possible to design. It would need uptake measurement in msec.
The efflux in red cells is much higher than influx. The high amounts of red cells in the blood (about 45%) provide by their efficient efflux system of more than 1000 mmol glucose/L cells/min support of glucose toward the peripherical cells as well as supply with oxygen.
Wilbrandt’s transport scheme [5] offers the possibility to determine the parameter b, which can be used to calculate the turnover of the unloaded carrier DC. At 20°C a turnover of about 1000 molecules per sec has been calculated, which might be interpreted as the oscillations of the empty carrier. The parameter b is found also in the parameters of Vm in influx and efflux and also in both Km values. The turnover of the glucose efflux at 20°C has a value of 507 molecules glucose per sec. This value is very close to that of W. D. Stein at 20°C for glucose efflux with 600 molecules glucose per sec.
It is a great pleasure to thank Professor. Dr. Netter KJ for his most valuable comments and suggestions.
- Fuhrmann GF, Liggenstorfer P and Wilbrandt W, Änderungen des Glukosetransports frischer menschlicher Erythrozyten bei längerer Inkubation, Experientia. 1971;2:1428-1430. https://bit.ly/3kMpGgZ
- Weed RI. ATP Dependence of Red Blood Cell Membrane Physical Properties: In Metabolism and Membrane Permeability of Erythrocytes and Thrombocytes, 1st International Symposium, Vienna. 1968;446-452.
- Fuhrmann GF. Transport studies in red blood cells by measuring light scattering. Methods Enzymol. 1989;173:263-80. doi: 10.1016/s0076-6879(89)73017-2. PMID: 2779428.
- Swietach P, Tiffert T, Mauritz JM, Seear R, Esposito A, Kaminski CF, Lew VL, Vaughan-Jones RD. Hydrogen ion dynamics in human red blood cells. J Physiol. 2010 Dec 15;588(Pt 24):4995-5014. doi: 10.1113/jphysiol.2010.197392. Epub 2010 Oct 20. PMID: 20962000; PMCID: PMC3036193.
- Wilbrandt W. Carrier Diffusion: Biomembranes, passive permeability of cell membranes. (Ed. F. Kreuzer and J.F.G. Slegers) 1972;3:79-99. https://bit.ly/2KqdFl3
- Lieb WR, Stein WD. Testing and characterizing the simple carrier. Biochim Biophys Acta. 1974 Dec 10;373(2):178-96. doi: 10.1016/0005-2736(74)90144-8. PMID: 4429733.
- Fuhrmann GF. Asymmetrical Properties of Glucose Transport in Human Erythrocytes: In Erythrocytes Thrombocytes Leukocytes (Ed. Gerlach E, Moser K, Deutsch E, Wilmanns W) IInd Inernational Symposium. Vienna. 1973;102-105.
- Mueckler M, Caruso C, Baldwin SA, Panico M, Blench I, Morris HR, Allard WJ, Lienhard GE, Lodish HF. Sequence and structure of a human glucose transporter. Science. 1985 Sep 6;229(4717):941-5. doi: 10.1126/science.3839598. PMID: 3839598.
- Galochkina T, Ng Fuk Chong M, Challali L, Abbar S, Etchebest C. New insights into GluT1 mechanics during glucose transfer. Sci Rep. 2019 Jan 30;9(1):998. doi: 10.1038/s41598-018-37367-z. PMID: 30700737; PMCID: PMC6353926.
- Deziel MR, Rothstein A. Proteolytic cleavages of cytochalasin B binding components of band 4.5 proteins of the human red blood cell membrane. Biochim Biophys Acta. 1984 Sep 19;776(1):10-20. doi: 10.1016/0005-2736(84)90245-1. PMID: 6541055.
- Stein WD. Channels, Carriers, and Pumps. Academic Press. 1990;140. https://bit.ly/2KeTNB2
Content Alerts
SignUp to our
Content alerts.
 This work is licensed under a Creative Commons Attribution 4.0 International License.
