> Medicine. 2020 June 17;1(2):024-028. doi: 10.37871/jels1116.
Cinnamomum verum and its Effects on the Visual Motor Speed in Humans
Ranyah Khan1* and Anna Patterson2
2University of Pennsylvania, Charter School of Wilmington, USA
- Cinnamon herbal supplements
- Spice
- Visual motor reflexes
- Smell of cinnamon
- Antioxidants
- Neural activity
- Lower blood sugar
- Sodium benzoate
- Brain activity
- Olfactory cortex
- Scented fragrances
- Reflex test
- Base reflexes
Cinnamon is used in a variety of cuisines, herbal supplements, teas, and other unique variations. Use of it as a spice dates back thousands of years and is primarily found in the lower regions of Asia in places like Sri Lanka and India. This experiment was designed to examine the effects of cinnamon on visual motor reflexes. It was hypothesized that the longer a participant smelt cinnamon the faster their reflex time would be. Participants were used as an internal control to check their base reflexes when initially unexposed to cinnamon, before repeating the experiment with the smell of cinnamon diffusing through the air. This was recorded using an online computer program provided by Washington University that functions as a click the button test. Participants had to press the button every time they saw a computerized traffic light turn green. We then calculated the changes in visual motor response time in intervals of two minutes for ten minutes. The means and standard deviation of each trial for each participant was calculated through both a calculator and the computer program. Most participants showed similar trends in their results with only a few outliers. Afterwards, the means were compared which revealed a gradual decrease in reflex time and statistically significant data with a P value of 0.0026, which supports our hypothesis that the smell of cinnamon decreases reflex response time. This can support the idea that cinnamon may be utilized in everyday activities to enhance mental abilities and may act as a significant stimulant to prevent drowsy driving. The experiment did not account for reflex acclimation however, which may provide a possible source of error in our data set.
Cinnamon has been employed for medicinal purposes ever since medieval eras. As an expensive ingredient in Egyptian times -a rarity considered a gift for Kings- Cinnamon has since proliferated the world after the European exploration [1]. Scientific research recently confirmed its beneficial health effects- its high dosage of antioxidants, anti-inflammatory properties, ability to counter neurodegenerative diseases [2]. And to lower blood sugar being some of the most notable [3]. Additionally, there is also research pertaining to cinnamon’s capacity to increase neural activity by creating and retaining new synapses through consumption- sodium benzoate being the possible source [4]. However, since consumption isn’t necessarily the most practical option for increasing brain activity, our research explored the possible effects of simply smelling cinnamon. Since even the thought of cinnamon has the ability to stimulate activity in the olfactory cortex through association, it would be practical to research if smell helps alert participants and stimulate brain activity [5]. Due to the prevalence of cinnamon scented fragrances in today’s society- ranging from candles to food- observing the benefits of the spice on visual motor abilities is necessary since it could then be possible to apply it when driving, studying, or practicing sports. We decided to then test whether cinnamon did in any way affect visual motor abilities by using the time cinnamon was nasally ingested as an independent variable with participants’ scores on a visual motor test as the dependent variable. Using the participants’ initial scores on the test as a control for after exposing them to the scent, we compared the amount of time it took participants to respond to a reflex test. This would allow us to counter any differences in base reflexes the participants might have amongst each other. We assumed that the longer the participants smelt the cinnamon, the shorter their reflexes would be and the shorter the time on the test.
Thirty human participants were used to carry out this experiment. The participants varied in age from middle school and high school students to middle-aged adults. Each participant was randomly selected from school, the local library, and a local church. This experiment took approximately a week to complete. A Urpower Essential Oil Diffuser, Great Value Distilled Water, Reaction Time Test program from the University of Washington, HP laptop, iPhone XR timer, and Gurunanda Aromatherapy Cinnamon Essential Oil was used to carry out the experiment.
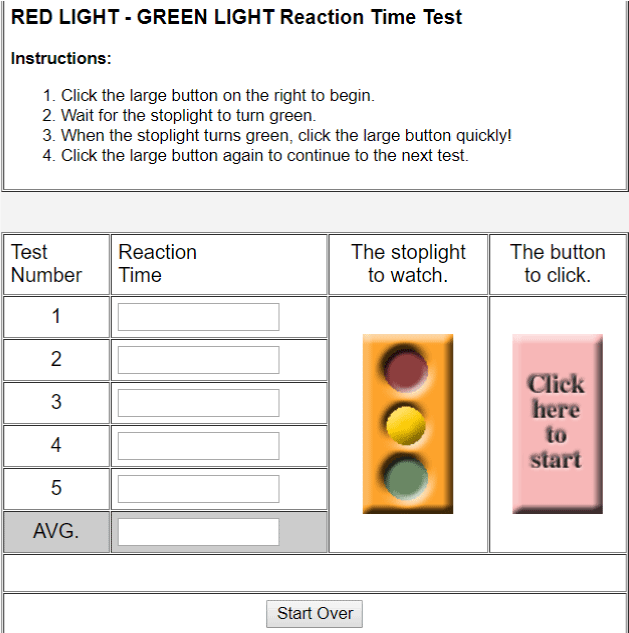
Before the experiment began, the cinnamon solution was prepared in the essential oil diffuser. A quarter cup of distilled water and three drops of 100% C. verum essential oil was placed into the internal chamber of the diffuser before it was sealed and placed in the experiment area. Then, in a closed small room, each participant used a computerized program from the University of Washington [6] that measured their reflexes. This program worked as a “click-the-button” type test and recorded the time it took for the participant to click the button as soon as the light turned green. Each trial had 5 runs within it, and the computer took the time of each run and averaged it out. Each participant partook in six trials, so in essence a person took the test thirty times. The first trial served as an internal control. The participants were instructed to take the test while the diffuser was off. After they finished their test, the diffuser was powered on and set on the mist setting-which released a steam version of the solution into the air approximately every thirty seconds. Meanwhile, the participants were told to sit in the room as the smell diffused into the room. Every two minutes, the participants were instructed to take the test again and the results, each individual run time and the average of those runs, were recorded. This was repeated at the four, six, eight, and ten-minute mark and the results of each trial was documented. These five trials served as the experimental group. The experimental areas varied depending on where the participant was canvassed. They generally participated in small, closed rooms approximately the same size each (study rooms at the library, storage closet at school, etc.). This same setup was repeated with all thirty subjects.
The computer program recorded how long it took for a participant to click the button each run and then averaged it out for each trial. Once all the data was collected, the standard deviation for each trial was taken using a TI-84 Plus CE. Each individual run was entered into the list section of the “STAT” area and the sample standard deviation was subsequently calculated in the “Calc” area using “1-st Variable Statistics.” Afterwards, the means were compared through graphical and statistical analysis using google sheets. The means were sorted into columns for each trial and once selected, google sheets translated the data into a graph, displaying the mean for each trial and the control. For the statistical analysis test we used an online one-way ANOVA test calculator from Good Calculators. This was used because the experiment measured more than three levels of an independent variable. This method is a comparison of group means and determines if there’s any significant difference which determined whether or not the experiment was due to chance or the treatment. Unlike its counterpart the t-test, this has the ability to determine the differences between at least three groups and since there were six groups in this experiment, this was utilized. The means for all of the participants’ trials were entered into six total groups on the calculator. From there, the calculator calculated the group means and statistical significance value.
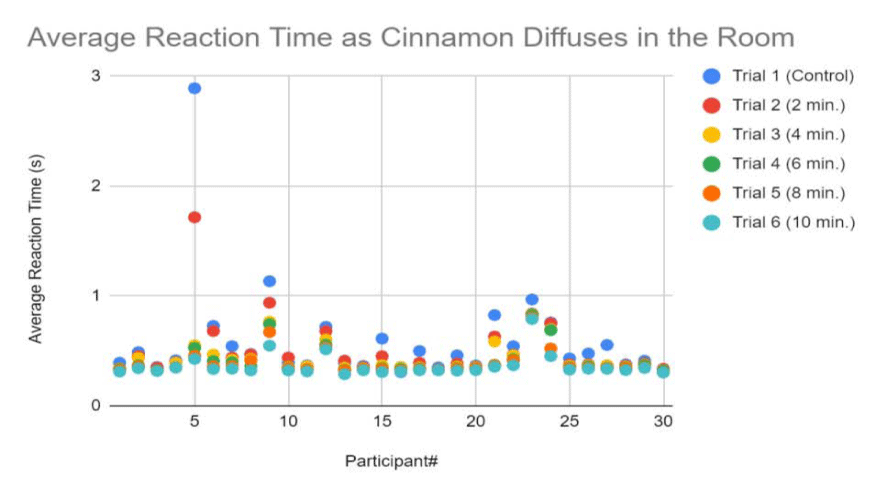
The means and standard deviations for each trial of all thirty participants can be found in the appendix. Figure 1 graphically summarizes the data collected for all of trials including the control group.
The graph shows the average reaction time for each participant as the cinnamon diffuses throughout the room. The varying dot colors indicate which trial the data point represents. The control group had the slowest reaction time in almost all trials except for participants ten, thirteen, sixteen, and thirty. Participant five displayed the slowest control time; however, showed significant improvement between each trial.
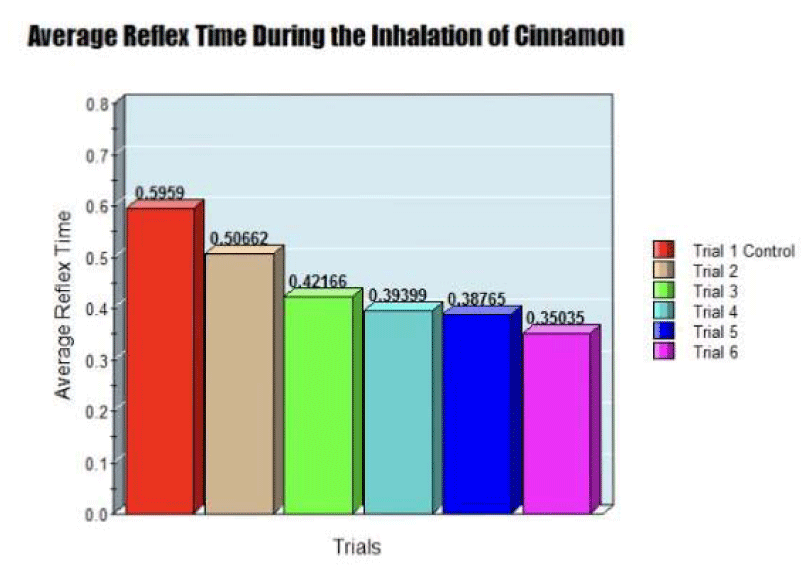
Group as a function of time. The highest average was the control group and the average time subsequently decreases from there. The control group had an average of 0.5959 seconds and the last group-the reaction time ten minutes after the cinnamon entered the room-had an average of 0.35035 seconds; approximately a 14 second difference between the two.
Table 1 shows the means of each group, the standard deviations of each group, and the standard error. The mean decreases as the groups proceed from the control (group 1) to the last trial (group 6). The standard deviation also decreases as the groups proceed from the control (group 1) to the last trial (group 6). The standard error also shows a general decrease as the trials go on.
Table 2 & 3 the statistical analysis of the data. It shows the degrees of freedom, sum of squares, mean square, and the P-value. The p-value that determines how much of the experiment was due to chance is 0.00263.
| Table 2: Data summary. | ||||
| Data Summary | ||||
| Groups | N | Mean | Standard Deviation | Standard Error |
| Group 1 | 30 | 0.5973 | 0.4766 | 0.087 |
| Group 2 | 30 | 0.5068 | 0.2786 | 0.0507 |
| Group 3 | 30 | 0.4333 | 0.1355 | 0.0247 |
| Group 4 | 30 | 0.406 | 0.1309 | 0.0239 |
| Group 5 | 30 | 0.3877 | 0.1111 | 0.0203 |
| Group 6 | 30 | 0.3637 | 0.1002 | 0.0183 |
| Table 3: ANOVA test summary. | |||||
| ANOVA Summary | |||||
| Source | Degrees of Freedome (DF) |
Sum of Sqaures (SS) | Mean Square (MS) | F-stat | P-Value |
| Between Groups | 5 | 1.1539 | 0.2308 | 3.8182 | 0.0026 |
| Within Groups | 174 | 10.5167 | 0.0604 | ||
| Total | 179 | 11.6706 | |||
The time in which it takes a person to react to the change of a red light to a green light was documented in order to test this experiment. The participants were instructed to push the button when they noticed the light become green and their reaction time was recorded through the online program used to test this experiment. It was hypothesized that the average time it takes for a person to react to the change would decrease as the scent of cinnamon permeated throughout the room. The figure 1 of the results section displays a general decrease in reaction time for each participant as the cinnamon diffuses throughout the room with only a couple of outliers. Out of the four identifiable outliers, most had a slightly higher trial one average (two minutes after the cinnamon has entered the room) than their control average (reaction time with no cinnamon in the room); however, their subsequent trials (four, six, eight, and ten minutes after the cinnamon smell began to diffuse) displayed increasingly faster reaction times. Figure 2 of the results section displays the average reflex time (y-axis) for the control group and all five trials at the 2-minute intervals (x-axis). This visual also shows the decrease but on a summarized scale so one can see how the average lowered overall thus also supporting the hypothesis-the longer that participants are exposed to the scent of cinnamon, the faster their reflexes will become. A fast reflex time is associated with a decreasing reaction time. When determining the statistical significance of our results, we discovered that the decrease in time is statistically significant. We used the ANOVA test to calculate our statistical significance since we have more than three levels of an independent variable. The test (as seen in figure 1. 4 of the results section) determined a p-value of 0.00263 which is well below the maximum value required for a data set to be considered statistically significant: p < 0.05. This means that we can conclude that the results of our experiment support our hypothesis and were due to the manipulation of our variables and not to chance. As a result of this experiment, we can also assume that the scent of cinnamon has an impact on visual-motor function and can be related to an increase in brain activity. Although we cannot say exactly how the smell of cinnamon does this, we can assume that compounds of cinnamon like cinnamaldehyde have a positive impact on brain and allows it work faster the longer a person is exposed to it. Potential sources of error from the procedure could have been the length of test. The longer the test went on, the more eager participants were to finish the test. This could have led them to involuntarily speed up their reaction time, or it may be due to the eventual acclimation to the test which would’ve allowed them to better anticipate when to react. Of course, this could be due to the effect of the treatment, but in case this is an affecting variable, the procedure could be adjusted to make the experiment shorter. If something had to be done differently, it would probably be to shorter the length of the experiment as previously mentioned. This might reduce any potential error and would save a lot more time. Getting around 6 participants to do the experiment each day was time consuming and took around two hours total per day. For a future study, we most likely would test the different types of cinnamon and compare their effects on the reaction time. There are numerous kinds of cinnamon, but we used one of the more common variants. It would be interesting to see whether other kinds have a similar, decreased, or enhanced effect on the reflex action of a human; however, it would add more variable groups to the experiment. This would most likely increase the length of the experiment from a week to several weeks to accommodate all of the variables. Additionally, it could have been possible to increase the intervals between each trial in order to reduce chances of participants reducing reaction time based on reflex acclimation. Overall, while we did expect cinnamon to possibly have a minuscule effect on reaction time, we did not expect the differences to be as great as they were. Studies done by Dr. P. Zoladz on the effects of different scents [7] - such as cinnamon and peppermint- on motor visual activity observed cinnamon as the clear winner for which most effectively bolstered reflexes. Thus, while we did expect our own values to also follow Zoldaz’s to some extent, our data was still far more concrete than we would’ve expected them to be. However, based on our experiment, further study is required on the extent to which reflex acclimation factors into our study and how different types of cinnamon would differ. We would need to isolate the specific variables leads to this quicker reaction time in cinnamon- the specific molecules or ingredients contained inside of cinnamon so we can more efficiently concentrate and utilize them in other products.
The purpose of our study was to test whether cinnamon had any beneficial effects on motor visual activity. Our study revealed a decreasing mean for reflex time the longer our participants were exposed to the scent of cinnamon, with a p value of 0.00263 indicating low chance of our data being a product of error. Thus, this supports our hypothesis that the longer our participants were exposed to the scent of cinnamon, the higher the faster their visual motor abilities would act. This could help with daily tasks such as studying, drowsy driving, and help teen drivers increase their alertness while driving. Teen drivers have one of the lowest reaction times partially due to their driving inexperience.
Thank you to all our participants for taking the time to participate in this experiment. Thank you to our mentor, Mrs. Rodriguez, for advising us throughout this long journey and offering support and guidance whenever we were struggling. Thank you to our scientific research teacher, Mrs. Lounsbury, for teaching us the proper experimental methods and how to proceed with our project. Thank you to Michelle Wang for lending us the diffuser used in the experiment. Thank you to the librarians at new castle county library for letting us use your study rooms to conduct this project.
- Allen J. RED LIGHT - GREEN LIGHT reaction time test. Retrieved. 2002. https://tinyurl.com/ybmh587q
- Gary L, Wenk. Why Cinnamon is good for your aging brain. https://tinyurl.com/y84pgwzp
- Kawatra P, Rajagopalan R. Cinnamon: Mystic powers of a minute ingredient. 2015. https://tinyurl.com/ycc4k8bt
- Modi KK, Rangasamy SB, Dasarathi S, Roy A, Pahan K. Discover our program. 2016. https://tinyurl.com/yckhcxnc
- Samantha Olson. A sprinkle of Cinnamon may boost brain power. 2016. https://tinyurl.com/yafkwyzx
- Feller S. Cinnamon may boost brain power, ability to learn. 2016. https://tinyurl.com/ycmf6ajc
- Health benefits of Cinnamon by John Davidson (Benefits of Cinnamon to the Brain- Chapter 1- Boast Brain Activity). https://tinyurl.com/yakcfj8c
Content Alerts
SignUp to our
Content alerts.
 This work is licensed under a Creative Commons Attribution 4.0 International License.


 Save to Mendeley