2025 July 16;6(7):891-895. doi: 10.37871/jbres2144.
The Assessment of Raw Cow Milk Chemical Parameters in North-Western Albania
Julia Preka*
- PCI
- Food security
- Raw milk
- Quality standard
Abstract
Milk is an important source of all basic nutrients required for mammals including human beings. This study was conducted to evaluate the chemical quality of milk samples in various villages in Shkodër, Albania. The fat, solids-non-fat, and added water parameters were analyzed in the samples of fresh milk with milkanalyzer apparatus. A total of 317 samples of fresh milk were analyzed. The results were statistically processed and showed: fat 3.45% ± 0.447, Solids-Non-Fat (SNF): 7.9% ± 0.187 and added water: 5.23% ± 2.06. Significant changes were observed for added water mean %, it was significantly higher in August. The One-way Anova analysis (p ≤ 0.05) showed that the mean value for fat, solids-non-fat and added water in the different months differed significantly from one another. Pearson correlation analysis was calculated and showed a high negative correlation between added water % and solids-non-fat % (r = -0,938; p = 0,000).
Introduction
One of the oldest foods consumed by humans is milk and it is the physiological secretion of the mammary gland of mammals [1]. Milk is a liquid nutritive product containing 10-13% dry matter. It contains 700 kkal/l energy value. The nutritional value of milk is high because of its high protein value. The composition and yield of milk are so important that it also affects the processing ability of milk [2]. Thus, ensuring high quality and desirable physico-chemical properties of raw milk for processing is challenging because they depend on many factors like breed, pasture.
Raw milk is contaminated easily and becomes unsuitable for processing and consumption by humans [3]. Physico- chemical properties of cow's milk are dependent on Solids-Non-Fat (SNF), Total Solids (TS), acidity and Total Bacterial Count (TAC) and protein and fat content. Milk composition should be: 3.6% fat, 28 g/l proteins, 7.71% solids-non-fat (SNF) and Lactometer Reading (LR) 1.030. The pH 6.6 ensures the milk freshness at boiling point 100oC - 117oC [4]. Milk protein, fat, and lactose are an important source of energy. A gram of milk fat provides 9.3 calories and a gram of protein and lactose provides 4.1 calories. Adulteration of food is the intentional addition of foreign or inferior substance to genuine foodstuffs for various reasons [5]. Adulteration of milk poses critical problems to the dairy industry. It leads to financial loss, compromises on the quality of end-products and is harmful to consumers' health. Added water of milk is a common practice by farmers in certain parts of the world [6]. Albania has a rich tradition of milk production based on its suitable natural resources for cattle and small ruminants. Overall milk production is 970 thousand tons and 85.05% of them are produced by cows [7]. Shkodra district has a Mediterrenean climate and a positive natural potential that enables the realization of agricultural, livestock and numerous other activities. There are several dairy factories that process milk and dairy products in Shkodra. The main objectives of this study was to determine the chemical composition of raw milk of cows for all samples collected in summer 2021 in Shkodër, Albania. The study evaluated the variability of fat, solids-non-fat and added water in milk for different months from nearby villages of Shkodra region.
Material and Methods
The area of study
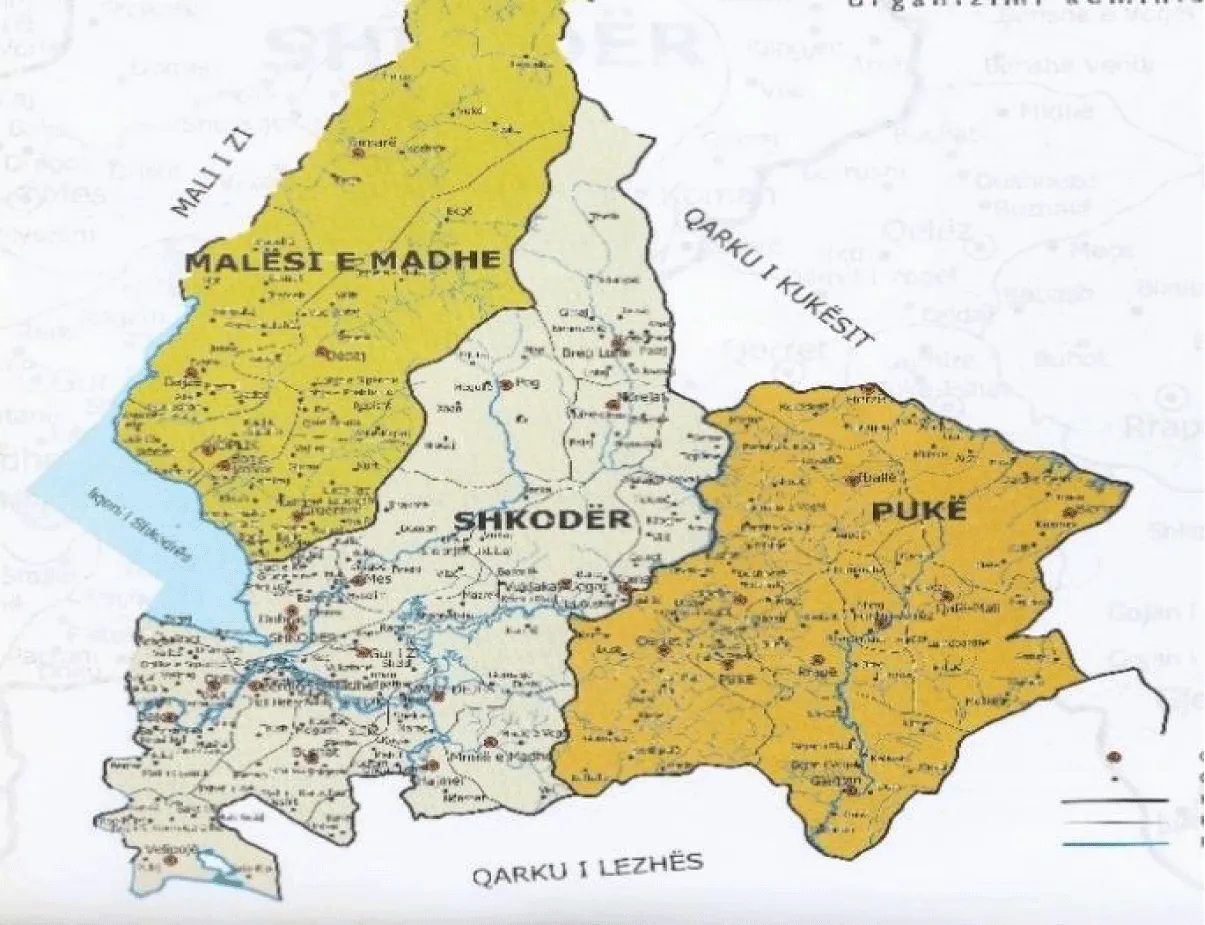
The district of Shkodër includes Malësi e Madhe, Shkodër and Pukë areas (Figure 1). Shkodër area includes Nënshkodër Lowland, Mbishkodër Upland and the mountain area.The samples of cow's milk were mainly collected in the villages of Shkodër district, in summer 2021.
The collection of samples
The research was carried out in a period of three months: June, July and august 2021. All the samples were collected according to the recommandations of literature [8]. The samples were thoroughly mixed to ensure that the milk fat was distributed prior to sampling. Submersible equipment was used to collect the final sample. All the samples provide a mean composition of milk at the points of sampling. The polyethylene bottles utilized during the collection of milk were pre-cleaned prior to use with 30% HNO3 and rinsed with distilled water and left to dry in excess. Milk samples were labeled with number, day and place of collection. The ice boxes stored the samples at 4ºC which were transported to milk processing factory Albamilk, located in Shkoder, for laboratory analysis. 317 cow milk samples were collected. Lactoscan milkanalyzer was the apparatus for measurement of fat, Solids-Non-Fat (SNF) and added water in milk samples. The apparatus was calibrated following the instructions of the apparatus manual. 25 ml of fresh milk was filled in special plastic holder and analyzed (Figure 2).
Statistical Analysis
Statistical testing and data treatment were assessed by using the software package. Minitab version 22.0, a p<0.05 was regarded as statistically significant. Descriptive statistics: mean and minimum, maximum, and standard deviation were calculated. One-Way Anova analyses was performed and Pearson correlations test was also used.
Results and Discussion
The descriptive statistics included mean, standard deviation, maximum, minimum, median, are presented in table 1.
| Table 1: Descriptive statistics for the results of analysis. | |||||
| Variable | Mean | StDev | Min | Max | Median |
| Fat % | 3.45 | 0.447 | 2.35 | 3.4 | 6.5 |
| Solids-non-fat % | 7.993 | 0.187 | 7.37 | 7.98 | 8.6 |
| Added water % | 5.23 | 2.062 | 0 | 5.3 | 12.5 |
The mean value of fat (%) in the milk samples was 3.45% ± 0.447 with minimum value 2.35% and maximum value 3.4 %. As far as is known, climatic conditions and seasonal changes have influences on the milk composition. The fat is the most variable parameter among the major milk components and its synthesis is affected by many factors-especially dietary and environmental [9]. The mean of solids-non-fat (%) was 7.9 ± 0.187 with minimum value 7.37 % and maximum value 7.98%. The added water (%) mean was 5.23 ± 2.06 with minimum value 0% and maximum value 5.3%. The results for presence of added water in milk show that the adulteration of milk is a dangerous factor affecting poor milk quality. The mean values of fat, solids-nonfat and added water in this study were compared with the results from studies published in other countries of the Balkan region: Kosovo, Macedonia, Albania. This study was referred to Albanian fat standard value for the results (Table 2).
| Table 2: Results of milk analyses from studies in different countries, Albanian Standard, this study. | |||||
| Chemical characteristics in milk | Hamiti Xh [10] | Loshi [12] | Kostovska L [11] | Albanian Standard [14] | This study Summer (2021) |
| Fat (%) | 3.81 | 3.61 ± 6.43 | 3.80 | >3.6% | 3.45 ± 0.447 |
| Solid-non-fat (%) | 8.73 | 8.78 ± 3.83 | 8.30 | - | 7.993 ± 0.187 |
The fat content analyzed in the study was 3.45%, lower than the fat % reported by [10,11], and by [12]. Natural variation in milk of cows depends on genetic factors and other factors that affect milk composition like the race, the stage of lactation, the illness of cow, the feed [13]. The milk from vendors is represented with a variability of cow’s races. The result of solids-non-fat in this study was 7.99%. This value was lower than the value reported by [10,11] and by [12]. The fat content in this study was lower compared with the fat standard value published in the Albanian Regulation [14].
Variation of chemical parameters in milk according to month
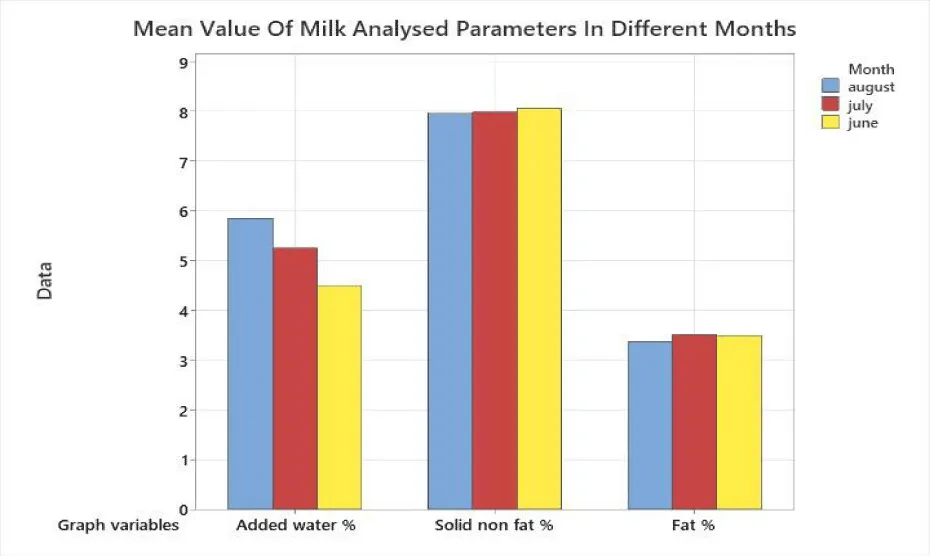
In figure 3 depicts graphically the mean of milk chemical characteristics by month. There were significant changes in June, July and August for added water %. It was found that the mean fat was significantly higher in July compared to August. It further found that the mean added water was significantly higher in August than in June, with the maximum mean solids-non-fat content in June and minimum in July.
One way anova analysis
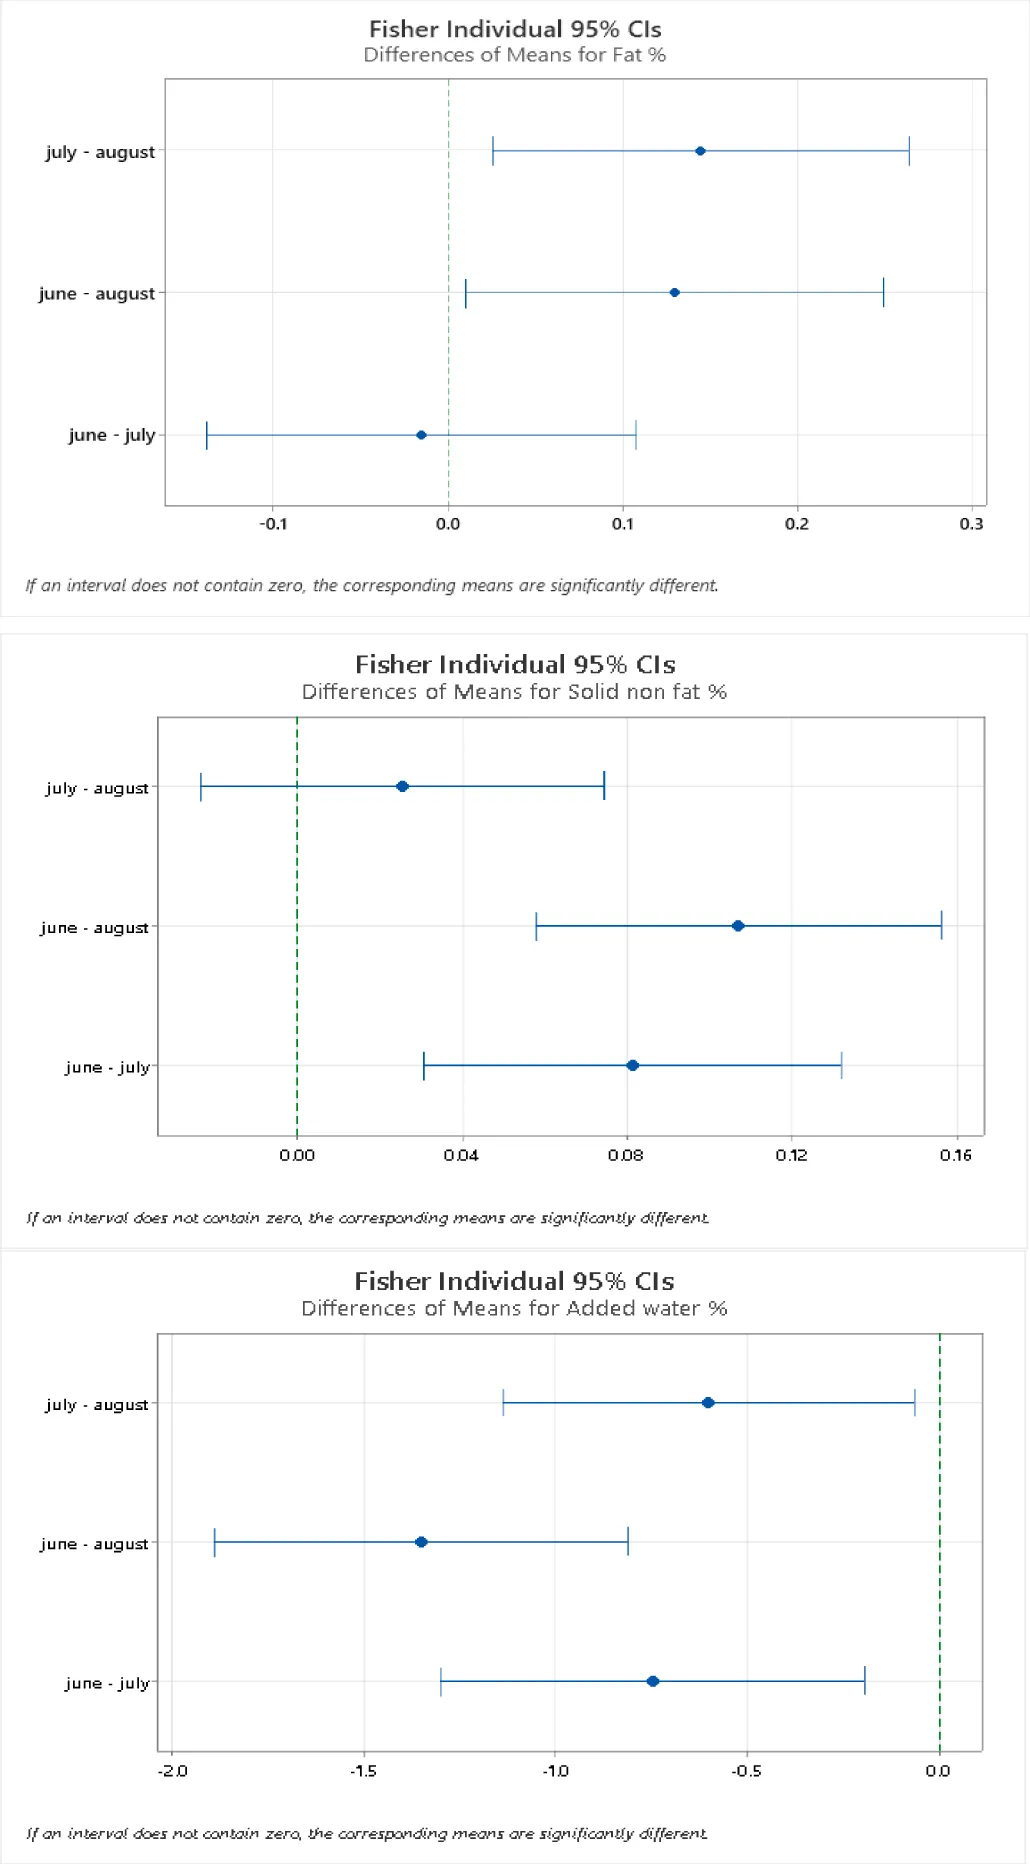
One-Way Anova analyses was used to investigate the influences of month of milk analysis on the composition of the milk. The means from the ANOVA analyses for fat, solid-non-fat and added water are shown in table 3 for level of significance α = 0.05. The means of fat, solid-non-fat and added water in the different months differ significantly from one another [15]. In figure 4 is a detailed information on the exact period when the differences in the milk content occur, using Fisher Method and 95% Confidence Interval. The differences in fat % for the corresponding analyzed samples fluctuate during the months of July-August and June-August have the greatest differences while the differences in solid-non-fat % fluctuate during the months June-July and June-August. Added water means differs significantly among all the months.
| Table 3: Results of ANOVA analyses for chemical parameters of milk with month. | ||
| Chemical parameters of milk | F | P |
| Fat (%) | 3.53 | 0.03 |
| Solid-non-fat (%) | 9.81 | 0.000 |
| Added water (%) | 12.27 | 0.000 |
Pearson correlation analysis
The relationship of the original variables to the principal components was examined using Pearson’s correlation [16,17]. The Pearson correlation coefficients r and P value for the analyses are given in table 4. The analysis has been conducted as shown in table 4. A strong negative correlation existed for added water % and solids non-fat % (r = -0.938; p = 0.000). In addition, a moderate negative correlation for solids non-fat % and fat % was present (r = -0.151; p = 0.007)
| Table 4: Pearson correlation coefficients r and P value for parameters analysed in milk. | ||
| Correlations | Fat % | Solids-non-fat % |
| Solid nonfat % | -0,151 | |
| 0.007 | ||
| Added water % | 0,119 | -0,938 |
| 0,035 | 0,000 | |
DConclusions
Fresh cow’s milk obtained in Shkoder represents a good chemical quality. In this study, the fat content in milk is lower than recommended levels from Albanian standard. The mean of added water was significantly higher in August. The one-Way Anova analysis for (p ≤ 0.05) showed that the means of fat, solid-non-fat and added water in the different months differ significantly one from another. Pearson correlation additionally was calculated and a high negative correlation was found between added water % and solids-non-fat % (r = -0.938; p = 0.000). These results may contribute to facilitate further studies on milk quality which is a very important tool for good quality products.
Recommendations
The quality of milk obtained from different dairy farms and vendors resulted adulterated, this was observed with the presence of added water content in milk. The adulteration of milk practiced often by farmers emphasizes the importance of further investigations on milk quality as a very significant challenge to good milk quality products. These results may serve as helpful information for concerned individuals, government parties, milk producers and factory owners to address the issue of adulteration, to continue research on milk sector, to improve the quality of milk products.
References
- Nickerson SC. Milk production: Factors affecting milk composition. 1999.
- Elvan O, Sebnem S. The effect of seasonal variation on the composition of cow milk in van province. Pakistan Journal of Nutrition. 2008;7:161-164. doi: 10.3923/pjn.2008.161.164.
- Milk and milk products. 1st ed. FAO/WHO of the United Nations, Rome, Italy; 2007.
- Agricultural sample survey, livestock, poultry and beehives population (private peasant holdings). Federal Democratic Republic of Ethiopia Central Statistical Authority (CSA). 2010.
- Anagaw YK, Ayenew W, Limenh LW, Geremew DT, Worku MC, Tessema TA, Simegn W, Mitku ML. Food adulteration: Causes, risks, and detection techniques-review. SAGE Open Med. 2024 May 8;12:20503121241250184. doi: 10.1177/20503121241250184. PMID: 38725924; PMCID: PMC11080768.
- Mabrook MF, Petty MC. A novel technique for the detection of added water to full fat milk using single frequency admittance measurements. Sensors and Actuators. 2003;96:215. doi: 10.1016/S0925-4005(03)00527-6.
- Biçoku Y. Milk sector trends: The case of Albania. International Journal of Agriculture and Environmental Research. 2023; 9: 965. doi: 10.51193/IJAER.2023.9514.
- Sampling testing: Milk and cream manual. Colorado Department of Public Health and Environment CDPHE. 2000; 5-6.
- Osama I. Effect of seasonal variation on chemical composition of cow's milk. Veterinary Medical Journal. 2015;28:150‐154.
- Hamiti Xh, Boci I, Lazo P, Bardhi G, Xinxo A. Physico chemical quality of raw milk from diary factories in 5 Albanian Districts Journal of Natural and Technical Sciences. 2014;2:47-53.
- Kostovska L. Raw milk hygiene and quality as an important parameter for obtaining quality dairy products. International Conference for Agronomy Students. 2017.
- Loshi I. Research of the physico-chemical composition of fresh cow,s milk in the Region of Peja and Gjakova Journal of Hygienic Engineering and Design. 2005;637.
- Walstra P, Wouters JTM, Geurts TJ. Milk: Main characteristics. In: Dairy Science and Technology. 2nd ed. Boca Raton: CRC Press; 2006: p.12.
- Albanian standard. STASH. 1500-87.
- Getachew F. Milk and dairy products, post-harvest losses and food safety in sub saharan africa and the near east. assessments report in the dairy sub sector in Ethiopia. Action Programme for the Revention of Food Losses. FAO, Rome. 2003.
- Grimley H, Grandison A, Lewis M. Changes in milk composition and processing properties during the spring flush period. Dairy Science Technology. 2009;89:405-416. doi: 10.1051/dst/2009016.
- Elvan O, Selcuk S. The effect of seasonal variation on the composition of cow milk in van province. Pakistan Journal of Nutrition. 2008;7:161-164. doi: 10.3923/pjn.2008.161.164.
Content Alerts
SignUp to our
Content alerts.
 This work is licensed under a Creative Commons Attribution 4.0 International License.


