Environmental Sciences Group 2025 February 28;6(2):191-196. doi: 10.37871/jbres2071.
Evaluating Physico-Chemical Parameters in Zanzibar North Region Water Wells
Abdul AJM1*, Lim LH2 and Jamila MM1
2Faculty of Science (FOS), University Brunei Darussalam, Jalan Tungku, Bandar Seri Begawan, BE 1410 Brunei Darussalam, Tanzania
- Salinity
- Dissolved oxygen
- pH
- Kitope mwembemajogoo
- Kiwengwa kumbaurembo
Abstract
This study was aimed at assessing the levels of turbidity, salinity, Dissolved Oxygen (D.O), pH, Electrical Conductivity (EC), temperature and Total Dissolved Solids (TDS) using in situ YSI ProDSS Multi-Parameters Water Quality Meter (Multi-Sonde). In May 2018, twenty five groundwater samples were collected from open hand dug wells, and closed hand dug wells in different sites of North A and North B districts in North Region of Zanzibar. The ranges of TDS, EC, and salinity were; 43 - 611 mg/L; 121.20 - 2176 µS/cm; 0.05 - 1.03 ppt respectively. 80.0 %, 12% and 96% of the water samples respectively had TDS, EC and Salinity values which fall under excellent category. Whereby, 8.0% of water samples had unacceptable EC levels these sources are Kitope Mwembemajogoo (EC = 2176 µS/cm), Mkokotoni (EC = 1215 µS/cm) and Kiwengwa Kumbaurembo (EC = 1806 µS/cm). The ranges of DO, Turbidity, Temperature and pH in analyzed water samples were; 1.74 - 8.43 mg/L; 0.56 - 34.4 NTU; 25.40 - 32.0 ° C and 5.27 - 8.60 respectively. Only 16% of the water samples had DO values within the acceptable range. For the parameter of turbidity, only, 40% of water samples had turbidity values within the acceptable range. Lastly, with respect to pH 56% of the water samples had pH values which are within the acceptable range. Kitope water source was more alkaline (pH = 8.60). It is extremely worthy to mention that the pH at Mahonda region was comparatively low, a typical example is Mahonda Mkataleni water source (pH = 5.27). The possible reason for the observed low values in pH in this region could be attributed by seepage of some chemicals from Mahonda Sugar Industry into ground water reservoirs. There was a strong positive correlation shown by some parameters including EC and TDS (r2 = 0.874), EC and salinity (r2 = 0.99). In conclusion, some of the water samples had values that deviated from the standard international permissible values of WHO. Therefore, regarding to the analyzed parameters there is a strong need to monitor on daily basis, the quality of the groundwater sources as ascertain their suitability for human consumption and even other living organisms.
Introduction
As a vibrant component of the Earth's hydrological cycle, groundwater plays a crucial role in sustaining system of life including the ecosystems and agriculture. It is an essential source of drinking water for billions of people globally. The quality of groundwater is of extreme importance to public health and for the environmental sustainability. It plays a pivotal role at influencing the quality of life, while almost 80% of diseases in human beings are water borne, worldwide 25 million deaths occur annually due to water borne diseases [1-3]. Nevertheless, groundwater occupies a distinct place in the economy, principally as the main fresh water resource for agricultural irrigation, and industrial utilization. However, groundwater quality can be affected by hydro geochemical process and anthropogenic impacts such as rapid urbanization, and industrial and agricultural development [4]. Furthermore, apart from factors such as geological variation (such as soil type), water and soil chemistry, there are also other anthropogenic enhanced factors which can lead to groundwater contaminations. For instances all activities conducted around the drinking water sources, onsite leaky septic tanks, and pit latrines all of which can influence the variability of groundwater quality [5].
Water being a vital resource allows the sustainability of life, it also plays a fundamental role towards the development of any nation. Due to rapid increase in an advancement of science and technology coupled with changes in climate patterns along with enormous increase of other anthropogenic activities, the sustainability of ground water quality is under a very huge pressure. Therefore, the need to monitor and safeguard our groundwater resources becomes more serious than ever.
Surface waters are extremely exposed to various types of waste and runoffs, and thus they are much susceptible and vulnerable to various contaminants [6]. Ground water systems on the other hand, are much better protected against direct runoffs and waste disposals, however, once contaminated, the issue becomes more serious and prevails for longer periods [7].
As water quality is a very well-known environmental determinant of health, the knowledge, and awareness of the quality of drinking water remains essential. The management and sustainability of good and drinking water quality is an important factor for human lives [8]. Thus, the present study highlights the levels of some water quality parameters namely; turbidity, salinity, Dissolved Oxygen (D.O), pH, Electrical Conductivity (EC), temperature and Total Dissolved Solids (TDS).
Materials and Methods
Sampling
In May 2018, twenty five groundwater samples were collected from different sites of North Region of Zanzibar namely North district A and North district B. These samples included open hand dug wells and closed hand dug wells. Samples were collected in pre-cleaned polyethylene bottles. The sampling and handling of the samples were done in accordance with the standard EPA method 2007.
Analytical procedure
Turbidity, Salinity, Dissolved Oxygen (D.O), pH, Electrical Conductivity (EC), temperature, and Total Dissolved Solids (TDS) were measured in situ using YSI ProDSS Multi-Parameter Water Quality Meter (Multi-Sonde).
Result and Discussion
SPSS version 16 was used for the data analysis. The summary of the descriptive statistics of the analyzed parameters in water samples is presented in table 1.
| Table 1: Descriptive statistics. | ||||||
| N | Range | Minimum | Maximum | Mean | Std. Deviation | |
| pH | 25 | 3.33 | 5.27 | 8.60 | 7.0280 | 0.99 |
| Salinity (ppt) | 25 | 0.98 | 0.05 | 1.03 | 0.3264 | 0.23 |
| Electrical Conductivity (µS/cm) | 25 | 2054.80 | 121.20 | 2176.00 | 696.3280 | 480.77 |
| Turbidity (NTU) | 25 | 33.84 | 0.56 | 34.40 | 5.2904 | 7.66 |
| D.O (mg/L) | 25 | 6.69 | 1.74 | 8.43 | 4.8472 | 1.96 |
| Temperature (° C) | 25 | 6.70 | 25.40 | 32.10 | 28.13 | 1.47 |
| TDS (mg/L) | 25 | 568.00 | 43.00 | 611.00 | 214.92 | 154.69 |
TDS, EC, and salinity in analyzed water samples
The ranges of TDS, EC, and salinity were; 43 - 611 mg/L; 121.20 - 2176 µS/cm; 0.05 - 1.03 ppt respectively. Basically, some of the water samples had values that deviated from the standard international permissible values of WHO, while other samples had values which were within the WHO recommended guideline value (Table 1). 80% of the water samples had TDS values which fall under category Excellent. 12% of the water samples had EC values which fall under category Excellent, while 8% of water samples had EC values that fall under category unacceptable, the sites with this category are Kitope Mwembemajogoo; EC = 2176 µS/cm, this area is very far from sea but had astonishing highest EC value, the reason for this value is yet to be found. Mkokotoni EC = 1215 µS/cm; Kiwengwa Kumbaurembo EC = 1806 µS/cm, these areas are very close to the sea, thus salt intrusion could be the sound reason for their higher EC values. For the case of salinity, 96 % of the water samples had salinity values which fall under category Excellent.
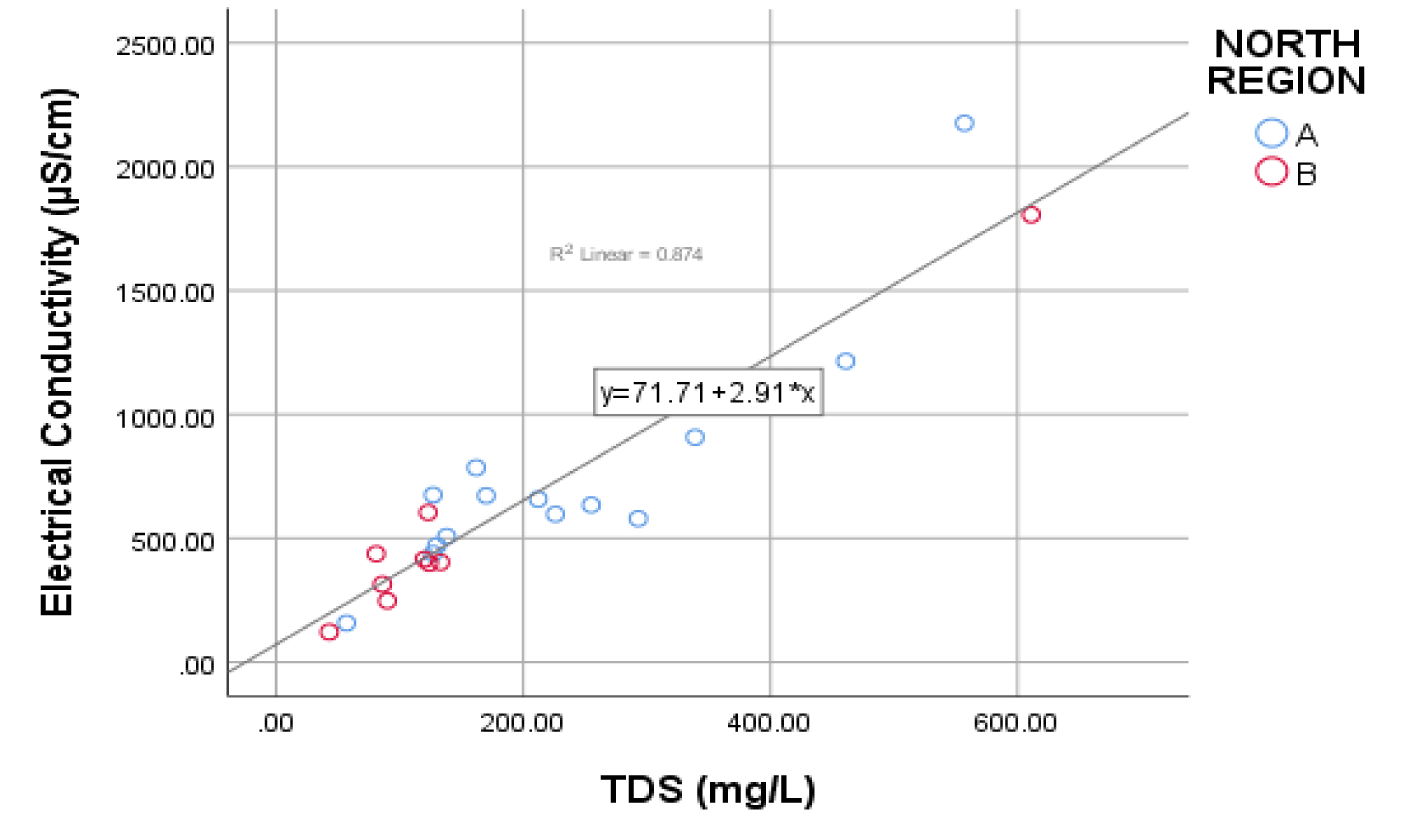
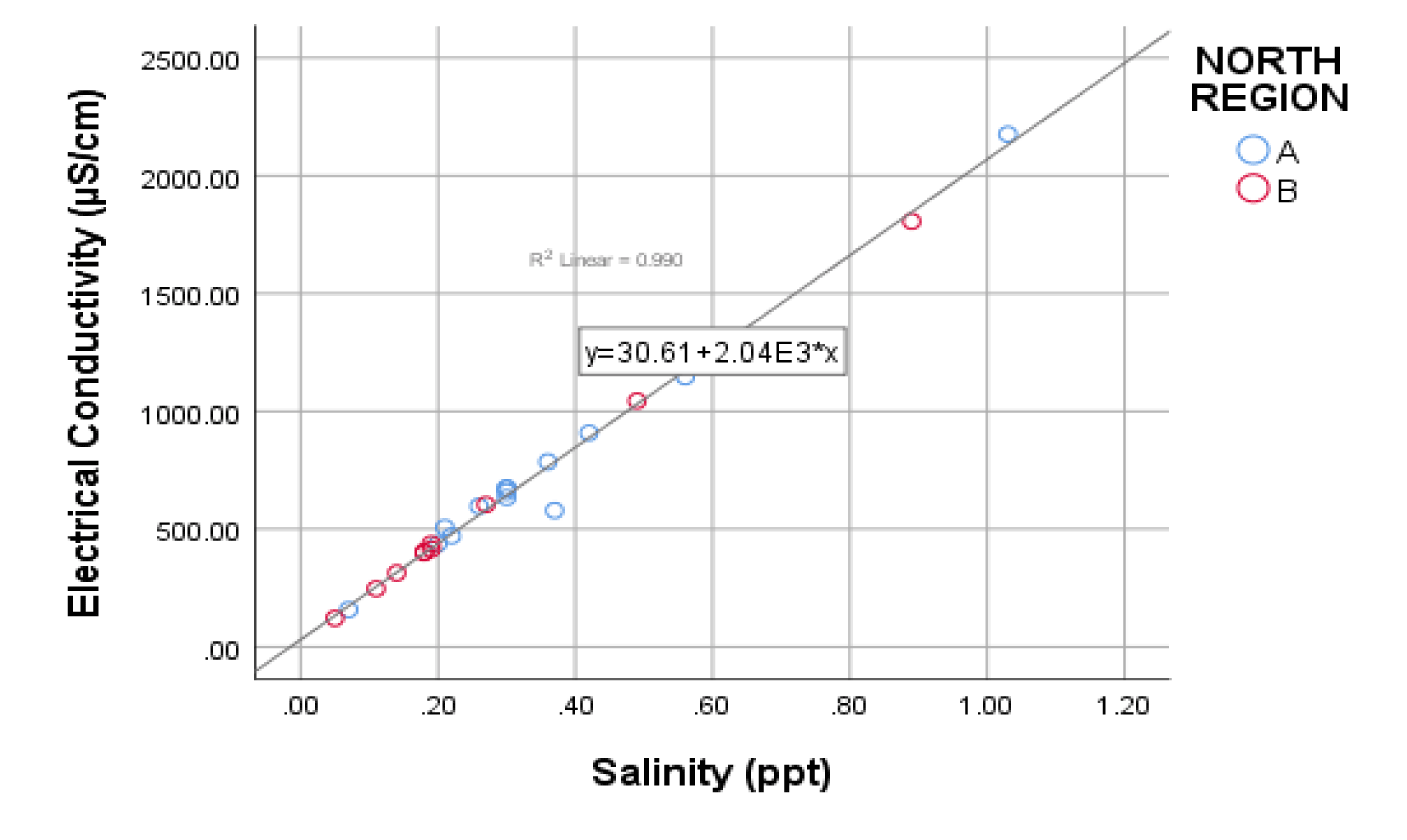
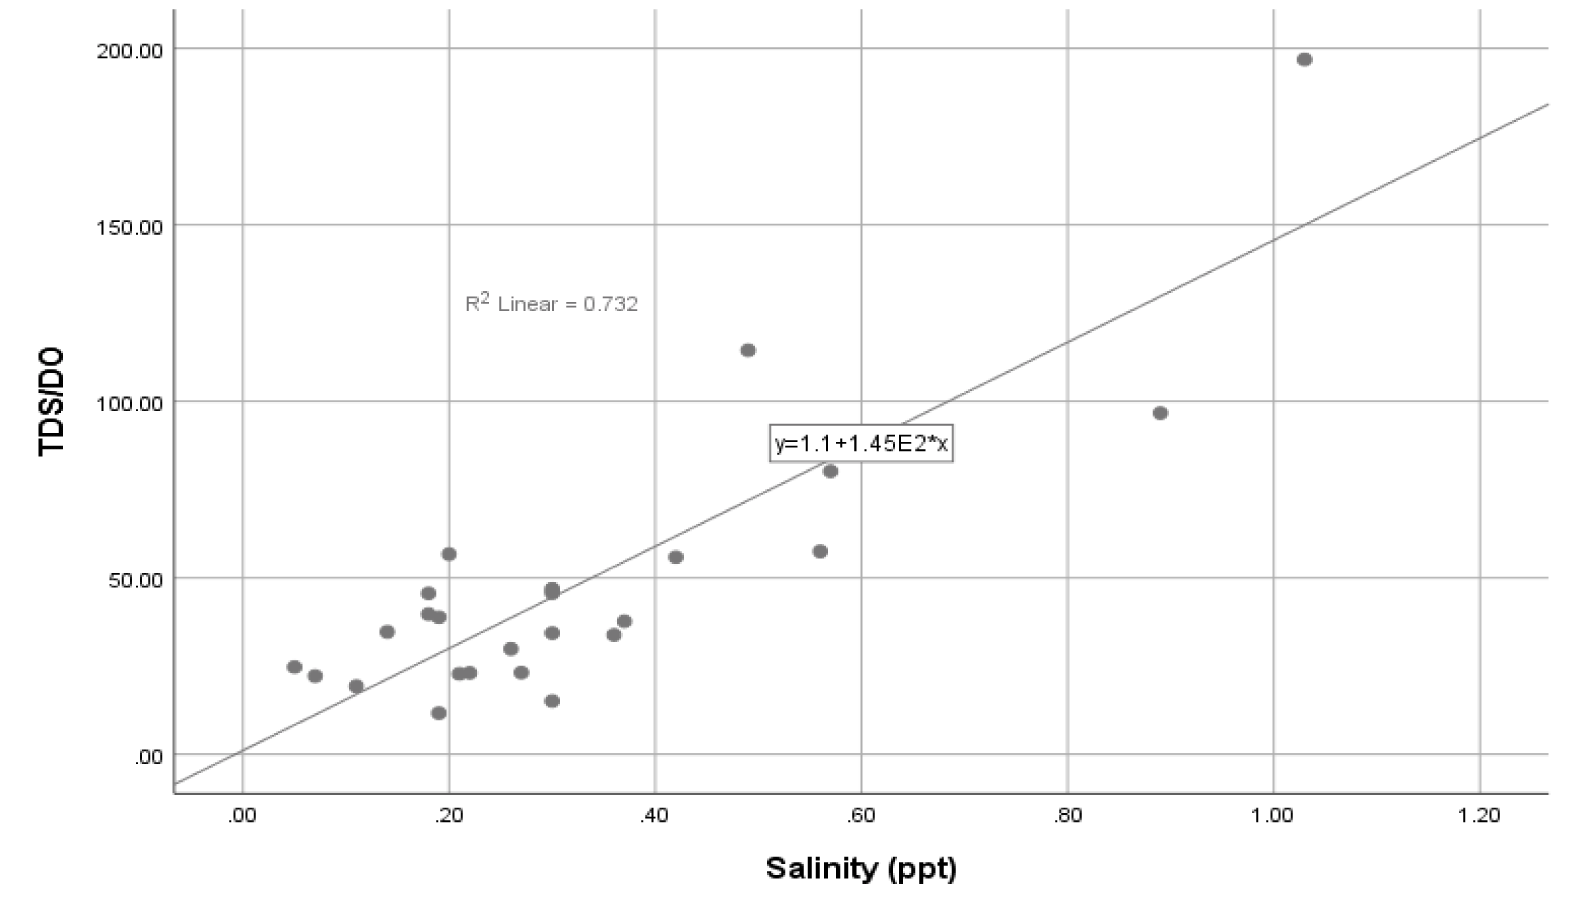
The EC values were found to show a strong positive correlation with TDS values (Figure 1; r2 = 0.874), similarly, EC and salinity showed a strong correlation (Figure 2; r2 = 0.99). These correlations depicts that, while one parameter increases another parameter increases as well. As a very remarkable observation, the TDS/DO showed a strong correlation with salinity (Figure 3; r2 = 0.732).
DO, turbidity, temperature and ph in analyzed water samples
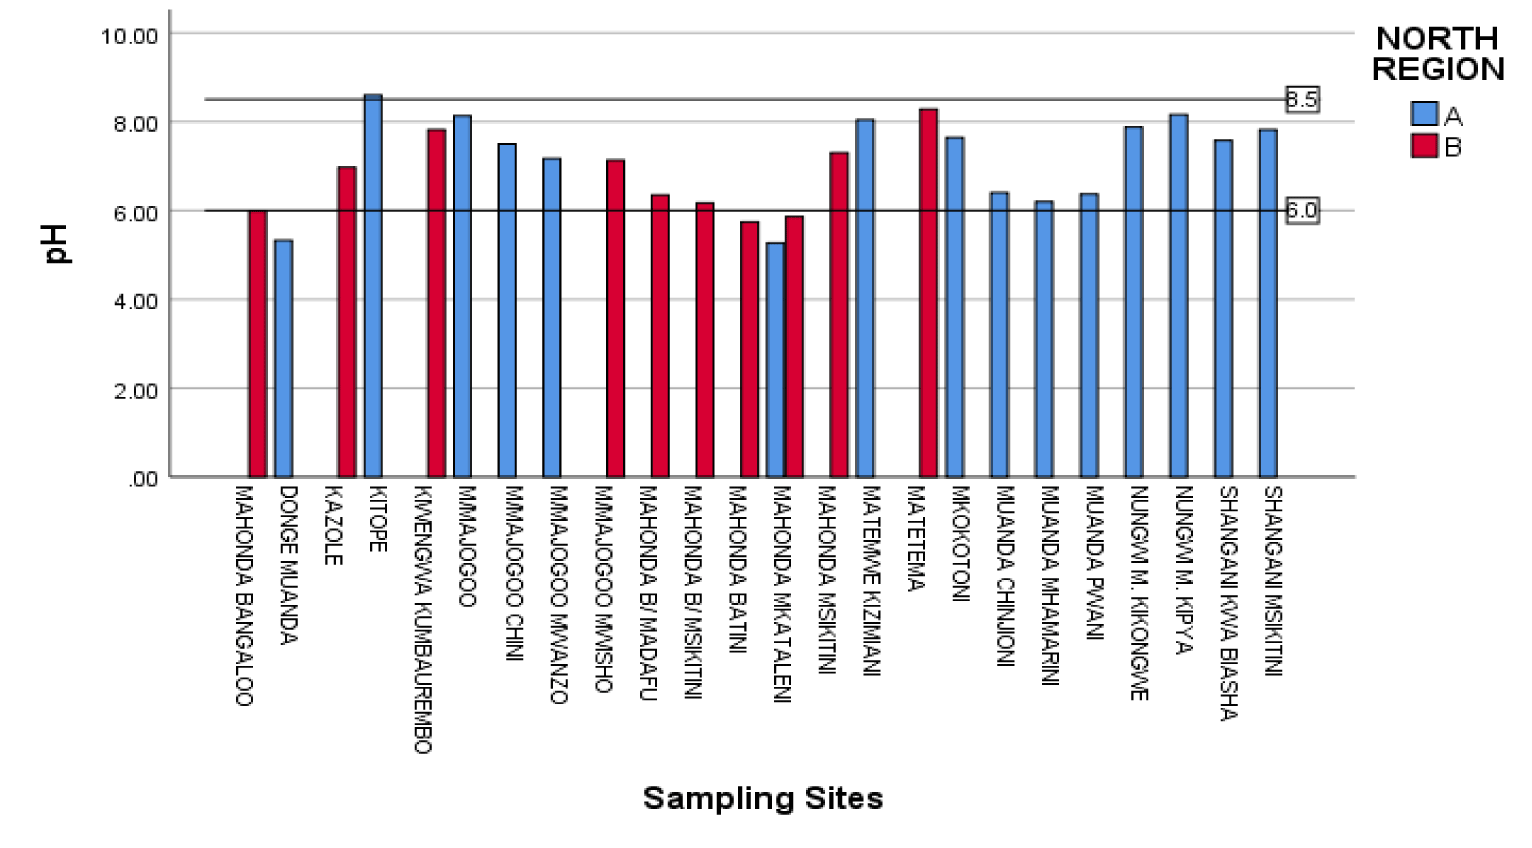
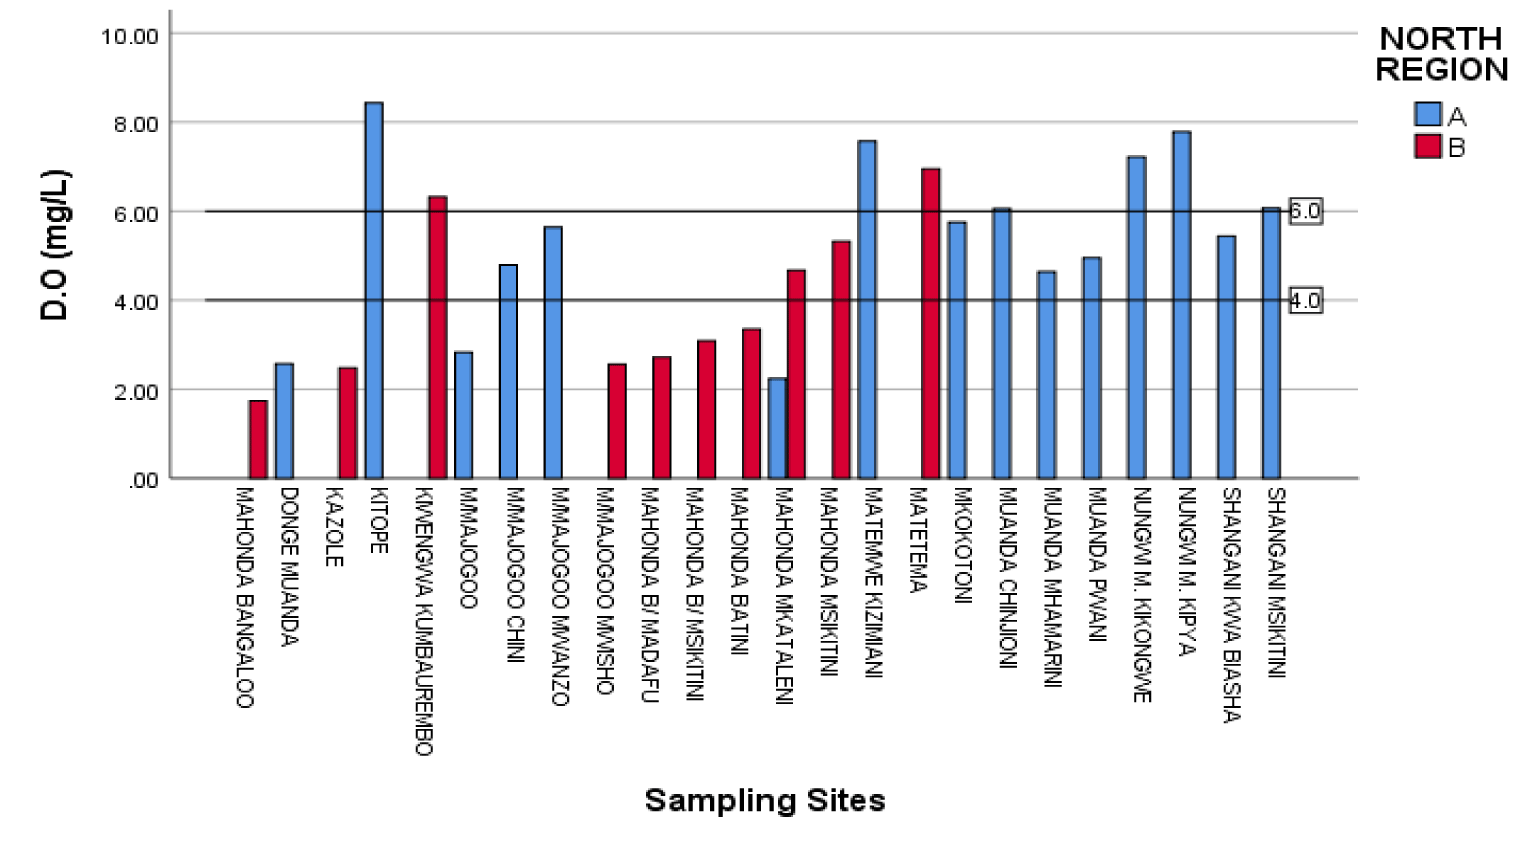
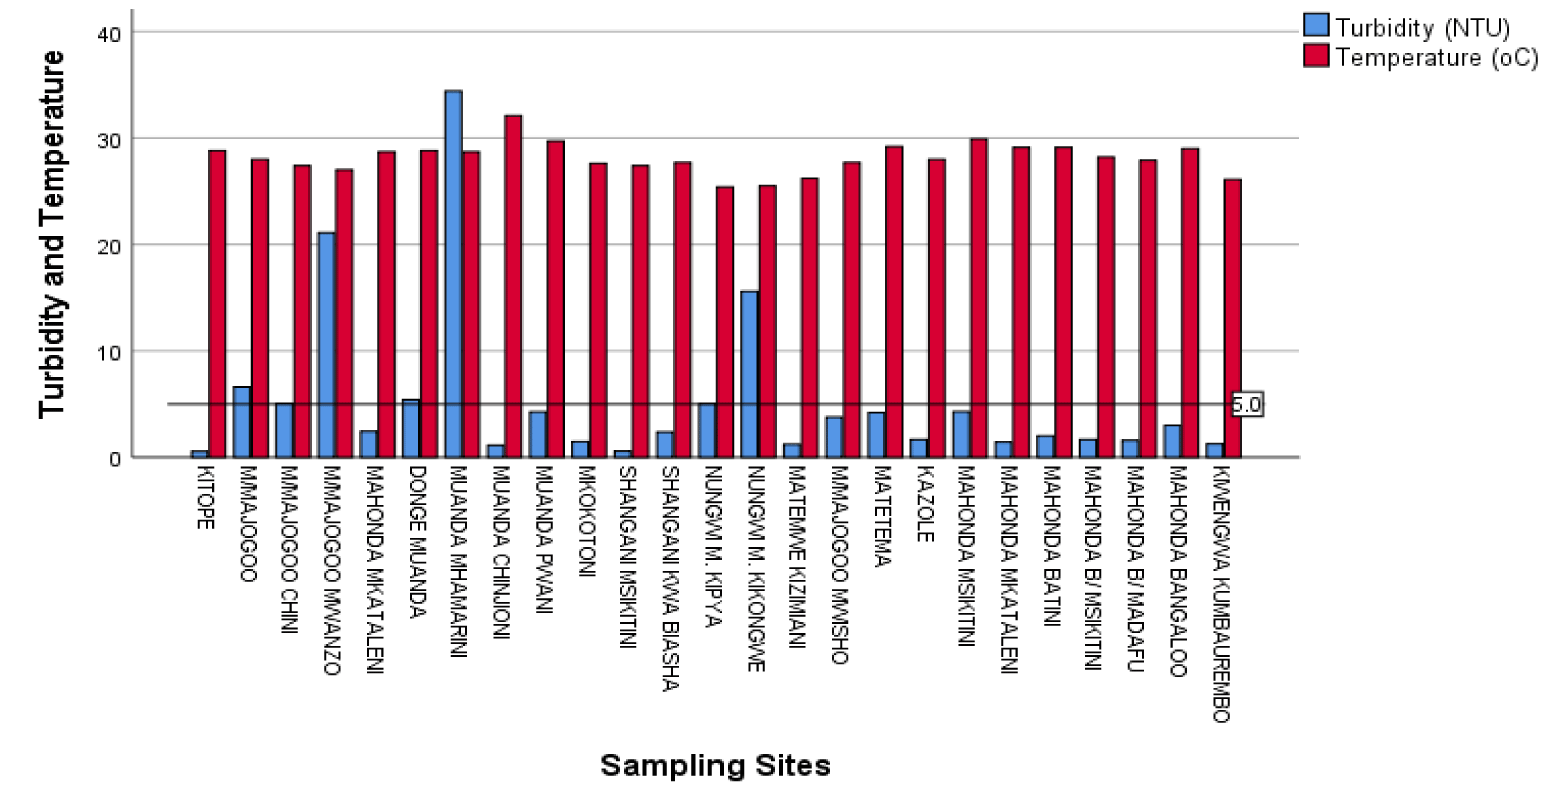
Following the data analysis, the ranges of DO, Turbidity, Temperature and pH in analyzed water samples were; 1.74 - 8.43 mg/L; 0.56 - 34.4 NTU; 25.40 - 32.0 °C and 5.27 - 8.60 respectively. Based on the data analysis, the water samples were assigned with different categories (Table 2, figures 4-6).
| Table 2: Ground water categories based on analyzed parameters. | ||||||
| Sampling Sites | pH | Salinity | E.C | Turbidity | D.O | TDS |
| Kitope | 3 | 1 | Very Good | Excellent | 3 | Excellent |
| M/Majogoo | 1 | 2 | Unacceptable | Poor | 2 | Good |
| M/Majogoo Chini | 1 | 1 | Good | Poor | 2 | Excellent |
| M/Majogoo Mwanzo | 1 | 1 | Excellent | Poor | 2 | Excellent |
| M/Majogoo Mwisho | 1 | 1 | Unacceptable | Good | 2 | Excellent |
| Matetema | 1 | 1 | Excellent | Fair | 1 | Excellent |
| Kazole | 1 | 1 | Excellent | Excellent | 2 | Excellent |
| Mahonda Msikitini | 1 | 1 | Very Good | Fair | 2 | Excellent |
| Mahonda Mkataleni | 2 | 1 | Excellent | Excellent | 2 | Excellent |
| Mahonda Batini | 2 | 1 | Excellent | Very Good | 2 | Excellent |
| Mahonda B/ Msikitini | 2 | 1 | Excellent | Excellent | 2 | Excellent |
| Mahonda B/ Madafu | 2 | 1 | Excellent | Excellent | 2 | Excellent |
| Mahonda Bangaloo | 2 | 1 | Excellent | Good | 2 | Excellent |
| Mahonda Mkataleni | 2 | 1 | Excellent | Very Good | 2 | Excellent |
| Donge Muanda | 2 | 1 | Excellent | Poor | 2 | Excellent |
| Muanda Mhemarini | 2 | 1 | Very Good | Poor | 2 | Excellent |
| Muanda Chinjioni | 2 | 1 | Excellent | Excellent | 2 | Excellent |
| Muanda Pwani | 2 | 1 | Very Good | Fair | 2 | Excellent |
| Mkokotoni | 1 | 1 | Unacceptable | Excellent | 2 | Good |
| Shangani Msikitini | 1 | 1 | Fair | Excellent | 2 | Good |
| Shangani Kwa Biasha | 1 | 1 | Very Good | Very Good | 2 | Excellent |
| Nungwi M. Kipya | 1 | 1 | Excellent | Poor | 1 | Excellent |
| Nungwi M. Kikongwe | 1 | 1 | Poor | Poor | 1 | Good |
| Matemwe Kizimiani | 1 | 1 | Excellent | Excellent | 1 | Excellent |
| Kiwengwa Kumbaurembo | 1 | 1 | Unacceptable | Excellent | 2 | Fair |
| For the purposes of statistics, the numbers 1-3 were used to categorize water samples per salinity, D.O and pH (Table 2). Where 1= within std range; 2 = below std range; and 3 = above std range. While for TDS (mg/L) and EC (µS/cm) the following ranges were intentionally assigned: Less than 300 = Excellent; 300 - 600 = Good; 600 - 900 = Fair; 900 - 1200 = Poor; and; above 1200 = Unacceptable. | ||||||
16% of the water samples had DO values which are within the acceptable range. 4% of the water samples had DO values which are above the acceptable range. 80% of the water samples had DO values which are below the acceptable range. For the parameter of turbidity, 40% of water samples had turbidity values within the acceptable range. 56 % of the water samples had pH values which are within the acceptable range. Where by Kitope water sample showed highest pH value (8.60), while Mahonda Mkataleni was found to have the smallest pH value (5.27). It is worthy to mention that sampling sites at Mahonda region had low pH values. The possible reason for the observed low values in pH in this region could be attributed by seepage of some chemicals from Mahonda Sugar Industry into ground water reservoirs [9].
Conclusion
From data analysis, some parameters show substantial agreement with the acceptable standards of international organization. As an exceptional remark, water samples from Mahonda region had low pH values which are at alarming levels, and in turn can influence toxic metals mobility in the water systems. More importantly, the noted high EC levels at Kitope region is also a factor which needs attention because this region is far from the sea. The ratio of TDS/DO had shown high degree of correlation with salinity, this relationship also seems to be an indicator for the existence of other associations. As an overall highlight, the responsible authorities and stakeholders in general are obliged to undertake comprehensive monitoring programs for the underground water resources. These exercises intend to assess several and broad parameters complimented with human risk assessments whenever the need emerges.
References
- Fida M, Li P, Wang Y, Alam SK, Nsabimana A. Water contamination and human health risks in Pakistan: a review. Exposure and Health. 2023;15(3):619-639. doi: 10.1007/s12403-022-00512-1.
- Karanis P, Kourenti C, Smith H. Waterborne transmission of protozoan parasites: a worldwide review of outbreaks and lessons learnt. Journal of water and health. 2007;5(1):1-38. doi: 10.2166/wh.2023.094.
- Ramakrishnaiah CR, Sadashivaiah C, Ranganna G. Assessment of water quality index for the groundwater in Tumkur Taluk, Karnataka State, India. E-Journal of chemistry. 2009;6(2):523-530. doi: 10.1155/2009/757424.
- Zhang H, Cheng S, Li H, Fu K, Xu Y. Groundwater pollution source identification and apportionment using PMF and PCA-APCA-MLR receptor models in a typical mixed land-use area in Southwestern China. Sci Total Environ. 2020 Nov 1;741:140383. doi: 10.1016/j.scitotenv.2020.140383. Epub 2020 Jun 20. PMID: 32610237.
- Mohamed AAJ, Rashid M Ali, Miza Kombo. Groundwater quality dynamics during and dry incidents in urban west region of Zanzibar Island. International Journal of Research and Analysis. 2019;2(2):61-69.
- Singh KP, Malik A, SinhaS. Water quality assessment and apportionment of pollution sources of Gomti river (India) using multivariate statistical techniques - A case study. Analytica Chemica Acta. 2005;538(1-2):355-74. doi: 10.1016/j.aca.2005.02.006.
- Pye VI, Patrick R. Ground water contamination in the United States. Science. 1983 Aug 19;221(4612):713-8. doi: 10.1126/science.6879171. PMID: 6879171.
- Mohamed AJ, Sara AK, Miza AK. Monitoring the levels of essential and trace metals in groundwater along fuoni area in Zanzibar journal of water resources and ocean science. 2016;5(3):37-46. doi: 10.11648/j.wros.20160503.12.
- Mohamed AAJ, Ibrahim A, Sadri AS, Lee HL, Islam SM. Levels of Hexavalent Chromium, Copper, and Total Hardness in springs and Underground Water in Zanzibar Island. Asian J App Scie. 2013;212-219.
Content Alerts
SignUp to our
Content alerts.
 This work is licensed under a Creative Commons Attribution 4.0 International License.


