Environmental Sciences Group 2025 January 03;6(1):001-011. doi: 10.37871/jbres2050.
Biological denitrification is used to treat industrial wastewater containing high concentrations of nitrate and sulfate from nitrocellulose production, which contains high concentrations of nitrates and sulfates.
Stanek R1 and Zabranska J2*
2University of Chemistry and Technology, Technicka 1905, CZ 166 28, Prague, Czech Republic
- Denitrification
- High nitrate load
- Industrial wastewater
- Inhibition of NO
- Oxygen probe reaction to NO
Abstract
Biological denitrification is used to treat industrial wastewater containing high concentrations of nitrate and sulfate from nitrocellulose production, which contains high concentrations of nitrates and sulfates. The reactor emits brown nitrogen dioxide gas suggesting significant Nitric Oxide (NO) formation and reaction with air. NO may significantly inhibit the denitrification process, reduce treatment efficiency and cause potentially serious issues in nitrocellulose production. An NO-sensitive oxygen luminescence probe demonstrated an accumulation of exceptionally high NO levels. The presence of excess NO under conditions that replicate the industrial denitrification process have further revealed that NO formation is triggered by an oversupply of ethanol, as the reducing substrate, under high nitrate loading. This overdosing is ultimately caused by the failure of an automatic ethanol dosage control, which relies on the signal from a nitrate- and nitrite-sensitive Nitratax probe. When the reduction rate of nitrate and nitrites appears to slows, nitrites continue to accumulates. Thus, the Nitratax probe signals for additional ethanol delivery even when it is unnecessary. Nitrite accumulation and nitrite reduction increase NO concentrations. Excess NO, or nitrite, apparently disrupts the next step in microbial denitrification, the reduction of NO by NO-reductases, and the denitrification pathway that ultimately yields N2. An NO or nitrite-specific probe may better serve as an early warning system by providing the timely feedback required to prevent inhibitory conditions. Additionally, a correlation was observed between inhibition events and lower pH levels in the denitrification reactor, particularly within the range of 6.1-6.3. However, no connection was found between NO evolution and temperature within the range of 16-35°C. Elevated industrial reactor NO may significantly inhibit the denitrification process, reduce treatment efficiency and cause potentially serious issues in nitrocellulose production.
Highlights
- Biological denitrification is applied to high nitrate and sulfate load industrial wastewater
- Sudden occurrences of NO cause strong inhibition of denitrification
- Luminescence oxygen probe responds to NO an extreme high signal
- The oxygen probe is used to measure NO generation and prevent process inhibition
Introduction
Inhibition of denitrification of industrial wastewater
Biological denitrification is a widely used technology for the removal of oxidized forms of nitrogen in wastewater treatment plants, but its potential can also be extended to heavily polluted industrial wastewater [1]. However, industrial wastewaters often present challenging conditions for denitrifying microorganisms, such as high concentrations of nitrate, various accompanying components like sulfate, metals, salts, and often suboptimal pH levels [2,3]. Both heterotrophic and autotrophic denitrification have been studied for various industrial application, such as for wastewater from the mining industry [4] stainless steel industry [5], fishery industry [6], and others. Successful conditions for denitrification, even for extremely high concentrations of uranium nitrate from the nuclear industry or from fertilizer industry, have been identified. [7,8] The potential of both heterotrophic and autotrophic denitrification for treating industrial wastewater loaded with high concentrations of nitrates and sulfates combined with high salinity was studied by [9] focused on the inhibition by inorganic ions (Na+, Cl-, SO42- and K+). Nitrite reduction was less inhibited by the studied ions than nitrate reduction and both the osmotic pressure and the toxicity of the individual ions played key roles in the overall inhibition of denitrification by salinity. Feng L, et al. [10] took advantage of the adaptation of salt-tolerant denitrifiers for the treatment of high nitrate and high salinity wastewater.
Inhibition by nitric oxide
Even if the denitrified wastewater does not contain any other inhibitory substances, the immediate conditions of nitrate and nitrite concentrations and the organic substrate are crucial to determine whether the individual steps of denitrification are in balance. The denitrification reaction actually consists of four steps:
NO3- NO2- NO (aq) N2O N2 (1)
Variations in the rates of individual steps within the denitrification pathway have often reported. According to [1-3] under certain conditions, the reduction of nitrates was faster than reduction of nitrites, causing nitrite accumulation in the system. Other studies suggest that nitrous oxide production can exceed its reduction to molecular nitrogen, leading to the accumulation of nitrous oxide [4,11]. A number of authors describe the accumulation of nitrites during denitrification [12,13]. Nitrite accumulation may result from a lag in synthesis of nitrite reductase or from nitrate inhibition of nitric oxide reductase [14]. The inhibitory effect of the intermediate NO on COD via the inhibition of oxygen consumption is mentioned by Casey TG, et al. [15]. Schulthess RV, et al. [16] have reported the accumulation of NO as a result of a shock increase in the concentration of nitrites and the subsequent inhibition of the further steps of denitrification process. Lu, et al. [17] have reported that nitric oxide inhibits near all N-reductase, and is normally detected at very low concentrations in bacterial cells. The activity of nitric oxide reductase is approximately 10 times higher than that of nitrite reductase, thus ensuring accumulation of the toxic NO. [18] Nitric oxide, generated by the action of nitrite reductase, inhibited the respiratory terminal oxidase activity of Paracoccus denitrificans [19].
In their investigations, Schulthess RV, et al. [16] measured the production of volatile denitrification intermediates under both normal conditions and high nitrite concentrations. The microbial response to a high nitrite pulse was shown to be influenced by the physiological state of the biomass. Denitrifying organisms saturated with nitrate and reducing substrate experience a substantial accumulation of NO and N2O, along with severe and prolonged inhibition of their denitrification metabolism. The researchers proposed that the high net production of NO following a nitrite pulse is caused by a lag phase in NO reductase activity. They suggested that direct inhibition of nitric oxide reductase by nitrite.
Denitrification, applied as a full-scale industrial wastewater treatment technology, must address not only the demands of the denitrification process-where all phases of the complex microbial process need to be balanced—but also challenges arising from the nature of production and the composition of the wastewater. In real-world operations, inevitable fluctuations occur in nitrate concentrations and other accompanying compounds. Additionally, measuring and control instruments commonly used in research are not always available in practical applications [20,21]and in the case of disturbance of the process balance, NO is released and denitrification is inhibited.
This study describes efforts to prevent problems with NO inhibition on an industrial scale using resources that are available under such conditions. Interventions and optimization of wastewater treatment on such a large scale can result not only in financial benefits from the uninterrupted operation of production, which must halt if the treatment plant fails to perform as required, but also in a significant contribution to environmental protection due to impaired NOx reduction and release.
Operational problems caused by the formation of nitric oxide and its inhibitory effect on the full-scale denitrification of industrial wastewater from nitrocellulose production were studied and options for their elimination are discussed.
Materials and Methods
Wastewater treatment plant description
Biological denitrification is applied in the treatment of industrial wastewater from the production of nitrocellulose with a high concentration of nitric and sulfuric acids at a pH of around 1.5. The estimated current volume of produced wastewater is approximately 2 million m³ per year. The concentration of nitrate nitrogen in the raw wastewater typically ranges from 100 to 400 mg/L, with sulfates from 1 to 2 g/L, at a temperature from 15 to 35°C [22]. The estimated average flowrate of wastewater is 4786 m3/day. The WasteWater Treatment Plant (WWTP) has two main technological steps, neutralization and denitrification.
In the wastewater treatment plant reactor, filtered wastewater is pumped from the filtration station through a mixer into the neutralization reactor. 50% NaOH is dosed into the mixer. The pH probe InPro 4260i/SG/225 (METTLER TOLEDO) and the Nitrate ion selective electrode N-ISE sc (HACH) are installed in the neutralization reactor. The water effluent from the neutralization reactor is maintained at a pH value of 2.2 - 2.5. The subsequent increase in pH to the desired value of 7 is ensured by hydroxide ions produced during denitrification according to equation 2.
12NO3-+5 C2H5OH→6 N2+10 CO2+12 OH-+9 H2O (2)
Ethanol is added as an organic substrate. 5% NaOH is titrated for the precise pH adjustment, and phosphoric acid is added as a source of an essential nutrient. The mixed denitrification reactor is equipped with a Hach Nitratax probe where the UV absorption measures the sum of nitrite and nitrate. The reactor is also equipped with a Hach LDO probe for the luminescent measurement of dissolved oxygen, nitrate ion selective electrode N-ISE sc (HACH) and a Mettler Toledo model InPro 4260i/SG/225 pH probe.
The treated reactor effluent water is separated from the sludge biomass in a downstream sedimentation tank, a part of the sludge is returned to the denitrification reactor. The excess sludge is mechanically thickened and handed over for disposal.
The course and monitoring of the denitrification process
The concentration of nitrate and the influx of wastewater change during the day, sometimes significantly, and fluctuations due to the nature of production are not controlled. Nitrates concentration in the influent to the denitrification reactor is measured with an ISE probe as a base for calculation of actual nitrate loading rate along with the wastewater inflow. The nature of the signal from the ISE does not allow it to be used as a control probe for ethanol dosing, because in our conditions, there was a rapid shift in the probe response. It had to be calibrated often. So, it is more suitable for trend monitoring rather than providing precise concentration values. Another disadvantage of using the nitrate ISE was that the control system only dosed ethanol to remove nitrates and nitrites that had accumulated uncontrollably in the reactor. Thus, leaving the operation reliant on feedback control based on the Nitratax probe. The Nitratax probe which measures actual concentration of both oxidized nitrogen forms (nitrate and nitrite) in the denitrification reactor is employed to automatically control the dosing of ethanol as a substrate.
The ethanol dose is determined by multiplying the nitrate nitrogen mass loading by a coefficient intentionally set higher than the stoichiometric consumption of ethanol, which is 1,37 g of ethanol per g of N-NO3-. The regulator has two restrictions: a) the maximum ethanol flowrate limited to 400 L/h and b) ethanol dosing is stopped when the Nitratax probe signal falls below 10 mg/L and it resumes when the signal rises back to 10 mg/L. As a result, the dosing of ethanol is very uneven, but allows to maintain a relatively stable concentration of total inorganic nitrogen in the effluent from the wastewater treatment plant.
The LDO probe monitors dissolved oxygen [23] and is submerged in the denitrification reactor. The probe measures oxygen and was specifically placed to check the anoxic conditions in the upper part of the reactor, where atmospheric oxygen diffusion could occur and possibly inhibit denitrification [24]. However, during the inhibition events, the probe recorded extremely high signal levels that exceeded possible dissolved oxygen concentrations. An explanation was the interference reaction of the probe to a high concentration of NO. Klaus, et al. [25] observed a similar signal from the Hach LDO probe during denitrification tests in the laboratory that they attributed to NO.
Measurement of the LDO probe signal in the presence of NO
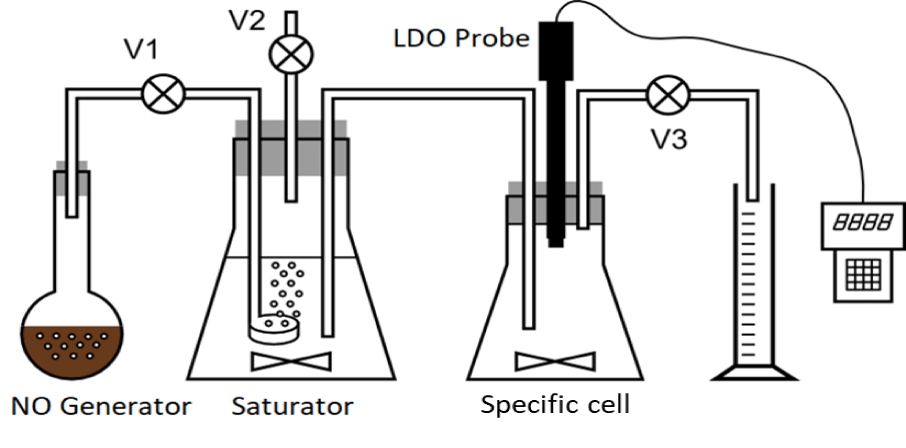
The laboratory experiment was carried out to determine whether the LDO probe reacts to the presence of nitric oxide and whether it is capable of detecting dissolved nitric oxide with sufficient sensitivity. The experiment consisted in gasification of distilled water with nitric oxide, which was prepared by reducing nitrite with divalent iron in generator according to following reaction.
NO2- + Fe2+ + 2H+ → NO + Fe3+ + H2O (3)
Crystalline sodium nitrite and crystalline ferrous sulfate were mixed in the generator with distilled water and the mixture was acidified with 98% sulfuric acid. The generated nitric oxide was directed into a saturator containing distilled water, where a saturated solution of nitric oxide was produced. Sources state that the maximum solubility of NO in water at room temperature and pressure is 2 mmol/L [26-29] This saturated NO solution was gradually displaced by nitric oxide (by opening the valve V1) into a specific cell with distilled water, where the response of the LDO probe was monitored. A laboratory Hach LDO probe with a portable Hach HQ30d converter was used for the measurements. The following apparatus (Figure 1) was constructed to perform the experiment:
Another important consideration was the autooxidation of NO in oxygen-containing water. In our experiment prepared a saturated NO solution was being added into a specific cell containing water that initially contained certain amount of soluble oxygen according to temperature and pressure. Ford PC, et al. [27-29] states that NO is oxidized in aqueous solutions with oxygen, following the reaction:
4 NO + O2 + 2 H2O → 4 NO2- + 4 H+ (4)
The oxidation of NO in aqueous oxygen-containing solutions is a second-order reaction in terms of kinetics [30]. Details of the experiment and data of the probe calibration are in Supplementary material.
Results and Discussion
LDO oxygen probe signal and NO concentration
The interference of nitric oxide with the LDO probe has been demonstrated by other authors [20,25], but the probe's responsiveness to dissolved NO concentration has not yet been measured which is essential for the design operational measures based on it.
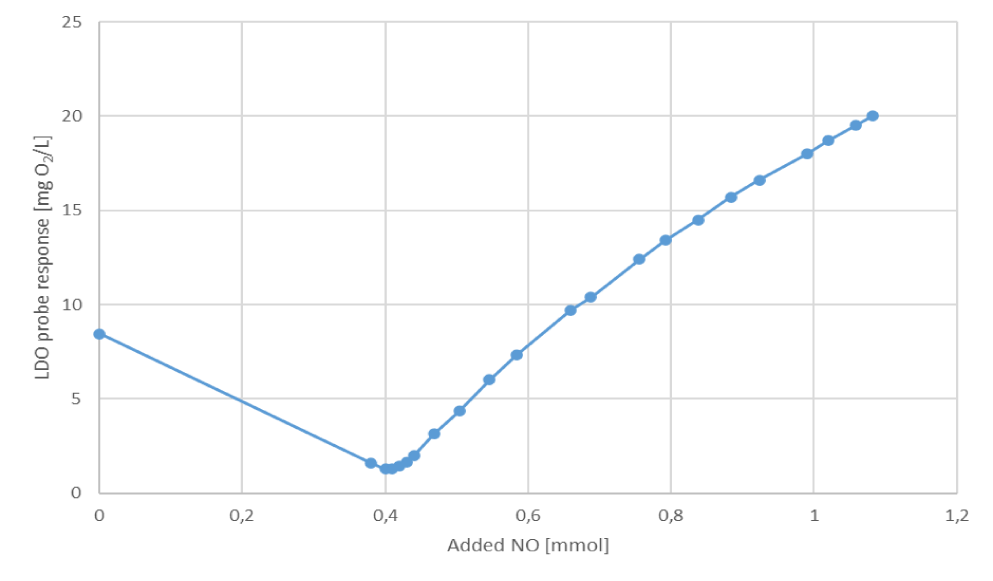
Following NO addition to the volume of water in specific cell, the LDO probe's response decreased as the incoming NO reacted with the dissolved oxygen. Once the oxygen was depleted, the probe began to respond steadily to the increasing nitric oxide concentration, showing continuous incremental response. In the following figure 2, the course of the response of the oxygen probe to increasing additions of dissolved NO is plotted.
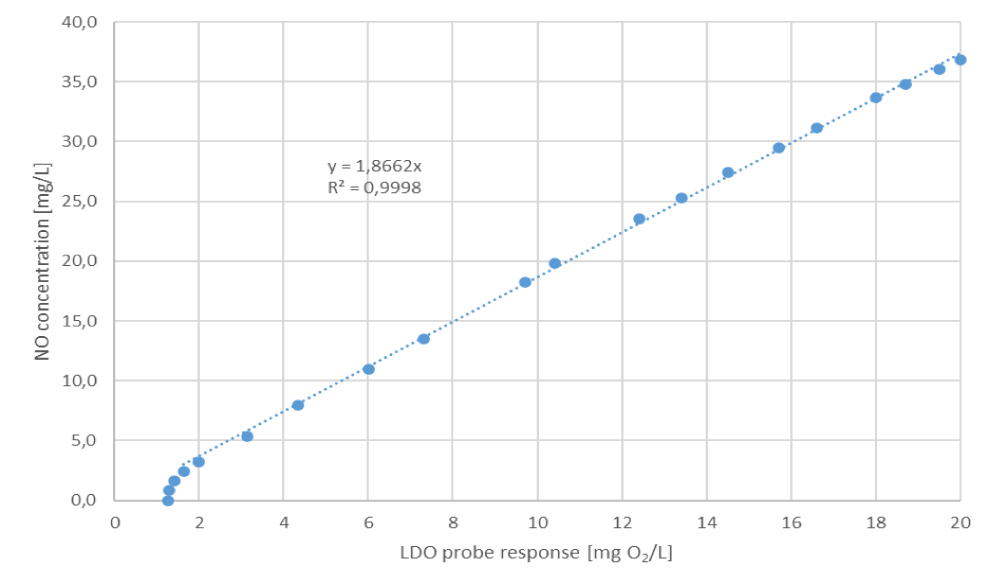
At first, there was a drop in the probe's signal because the introduced NO reacted with dissolved oxygen, reducing its concentration in the solution. So here the probe registered oxygen, and the NO brought in was oxidized. After the second NO addition to 0.4 mmol, the LDO probe signal reached its minimum of 1.27 mg/L O2. At this point it can be assumed that all the oxygen had been reacted with NO and since then the probe has only registered nitric oxide. The real concentration of NO is further calculated as difference between total added NO and NO consumed and the relation to the signal of LDO probe is presented in figure 3.
A linear regression is dotted in the graph, and above it is an equation including the calculation of the regression coefficient. From a NO concentration of 2.4 mg/L (0.08 mmol/L), the probe response to the NO concentration is linear and can be expressed as:
NO [mg/L] = 1.866 x LDO probe response [mg/L O2] (5)
Thus, the LDO probe's sensitivity to dissolved nitric oxide is nearly 2 times higher than that of dissolved oxygen alone. In the absence of oxygen, the probe response is linear to its maximum range, representing 36.8 mg/L NO.
We found that we could not detect very low concentrations with this procedure. The response of the LDO probe decreased at the beginning of the experiment, when the dosed nitric oxide reacted with dissolved oxygen, but when it decreased to a certain value, it started to increase again. Although we repeated the experiment several times, the probe response never fell below the values around 1.2 mg O/L. Despite this, in the denitrification reactor we measure values close to zero (e.g. 0.05 mg/L). A possible explanation is that the oxidation of NO, being a second-order reaction, proceeds very slowly at low concentrations. Thus, both dissolved gases (NO and O2) coexist in the system for a relatively long time. In contrast, in a real denitrification reactor, oxygen is entirely absent as it is immediately consumed in the oxidation of the added organic substrate.
The possibility of continuous measurement of NO concentration is a highly useful tool, enabling the immediate detection of its presence during denitrification and allowing for early technological interventions to avoid problematic situations that could reduce process efficiency.
At the time of this study, the market lacked an operational on-line measurement for direct, continuous monitoring of dissolved nitric oxide in aqueous solutions, that could be used to compare responses with the LDO probe. A brief test was conducted using an electrochemical NO sensor (a membrane electrode analogous to Clark's oxygen electrode) designed for use in medical research. The tests were not successful. The subtle probe was unable to function under the real conditions prevailing in the reactor in a mixture of water and denitrifying microorganisms. Therefore, the interaction of the LDO probe with nitric oxide was tested directly.
Monitoring the occurrence of NO inhibition
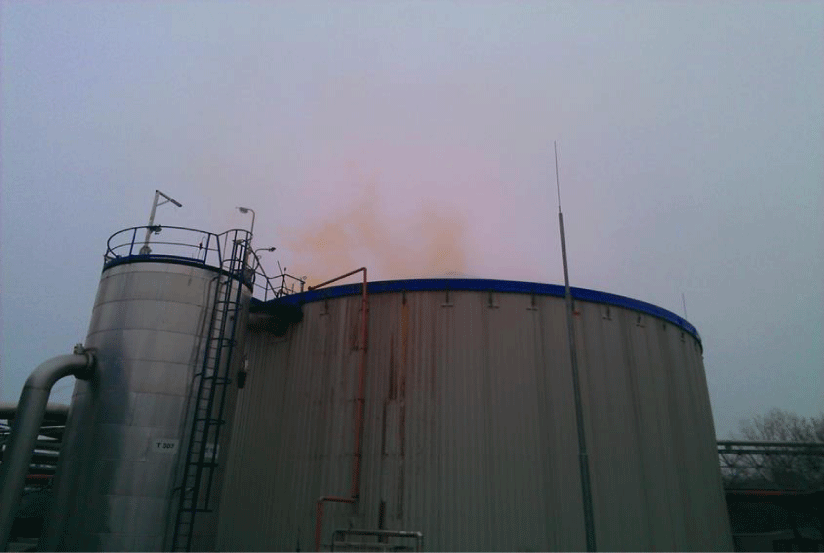
The inhibiting phenomenon always occurred abruptly and in some cases was accompanied also by the presence of brownish nitrogen dioxide gas, a product of reaction of nitric oxide with atmospheric oxygen, and presumably also colorless unreacted nitric oxide gas above the surface of the denitrification reactor, as shown in figure 4. Inhibition resulted in a complete cessation of denitrification as measured by nitrate conversion for several hours to days, causing the WasteWater Treatment Plant (WWTP) to be unable to process effluent and creating significant problems for industrial production. The onset of inhibition was always extremely rapid, with no warning indicators. In order to find out the connection with the deterioration of the process, all the available data from monitoring the process were studied in detail and compared.
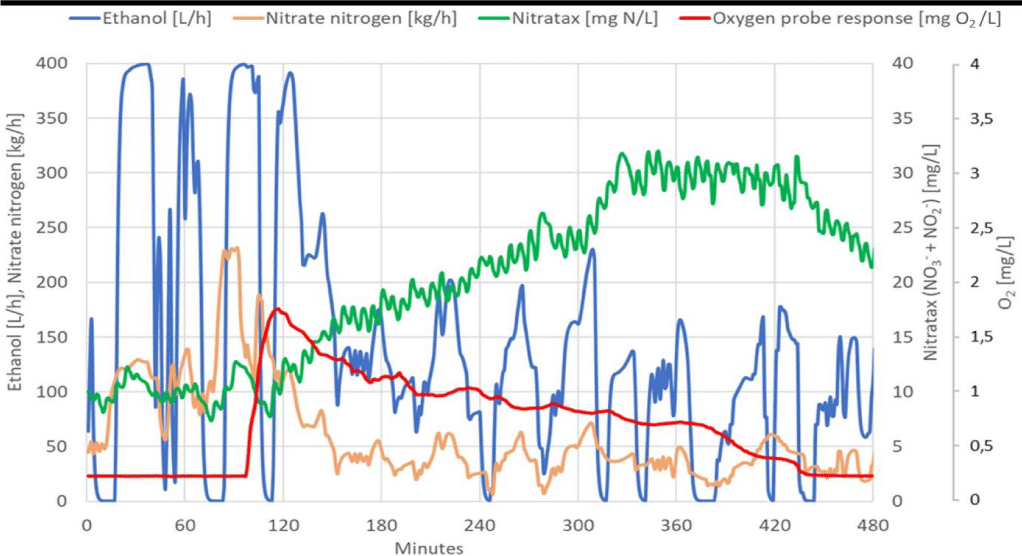
When searching for correlations with the occurrence of inhibition, all monitored parameters were compared. The oxygen probe signal unexpectedly showed a sharp rise in signal not corresponding to a stable low oxygen concentration just before the inhibitory state began. In the following figure 5, signals of the oxygen probe are presented, along with the nitrate nitrogen loading and the dose of ethanol when inhibition occurred.
From figure 5 it is evident that after a sharp and enormous increase in the signal of the LDO oxygen probe, the response of the Nitratax probe increased even though the nitrate loading rate was significantly reduced. This implies that the removal of nitrates has almost stopped. The recovery of the denitrification process occurred only after the reduction and removal of inhibitory NO, when the response of the LDO probe signal returned to the same level as before the inhibition.
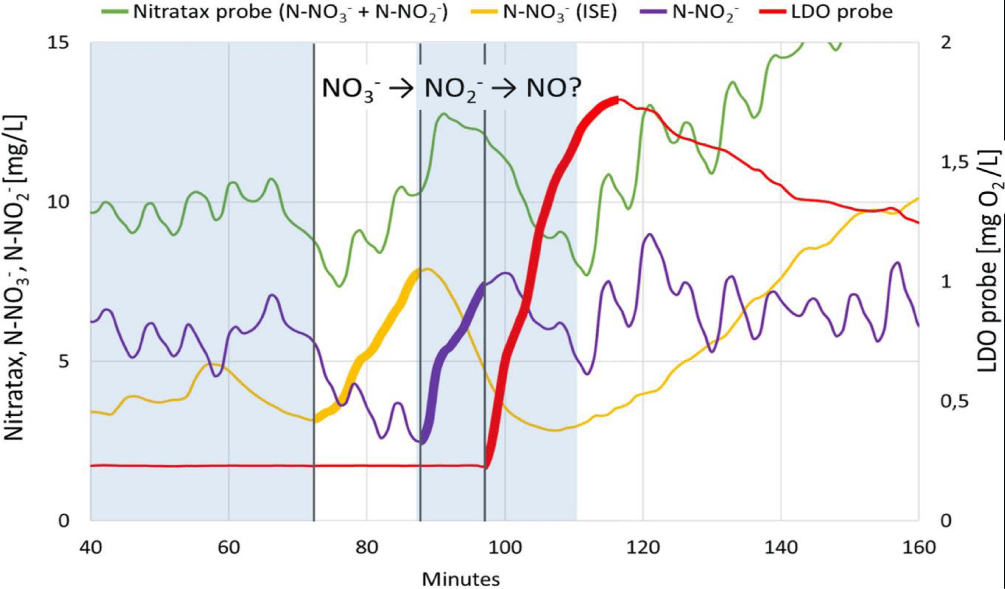
An unexpected LDO probe signal caused by increased NO concentration occurred at the moment when the increased nitrate nitrogen mass loading caused an increase in the concentrations of nitrate in the reactor. The regulator responded by dosing the maximum allowable dose of ethanol. These are the conditions leading to the accumulation of denitrification intermediates, such as NO2- and also NO in accordance with equation 1. The following figure 6 shows the concentrations of oxidized forms of nitrogen in the reactor just before the onset of inhibition.
NO2-is calculated as the difference of Nitratax and ISE probes measurements
Shaded Blue rectangles represent periods of ethanol dosing.
After the start of the second ethanol dosing (in the 84th minute), nitrites began to rise (in the 90th minute) and after another 7 minutes (in the 97th minute near the moment of nitrites culmination) did the LDO probe response start to rise detecting nitric oxide that start to inhibit the denitrification.
In the experiments of Klaus, et al. [31],When NO and N2O concentrations were measured by specific online sensors alongside oxygen probe, the initial dose of nitrites into the reactor caused an immediate increase in the concentration of NO in the liquid phase and, consequently, a slower increase in N2O concentration [21,32]. The increase in NO concentration corresponded to the increase in dissolved oxygen signal values of the Hach LDO probe and a test with injected tap water with pure nitric oxide and nitrous oxide showed that the interference effect on the LDO probe occurred with the addition of NO, not N2O [31].
Suppression of inhibition based on knowledge of NO occurrence
So, the ability to detect impending inhibition was available, but it was necessary to find how to prevent it from fully unfolding. When studying the circumstances that preceded the inhibition, it turned out that it usually occurs after a sudden increase in the organic loading. It can be seen from figures 5,6 that a sudden increase in the nitrate load induces an increased substrate dosage, which persists, even as the nitrate load decreases being transformed but only to nitrite. This was also evident from the literature. High NO production normally follows the accumulation of nitrite [13,33-35]. It has been shown that if substrate dosing continues during nitrite accumulation, nitric oxide will be produced in such quantity to escape from the denitrifiers cells into the water and cause inhibition of the denitrification process. Oxygen measurements indicated that the presence of oxygen is virtually zero for most of the time. Oxygen that diffuses into the reactor through the open surface is immediately consumed in the oxidation of the added substrate, which unfortunately results in higher operating costs. During a shutdown in nitrocellulose production, if there is a prolonged period of low nitrate loading, and the remaining amount of nitrate is removed through endogenous denitrification, substrate dosing may not be required for an extended period. This leads to a very slow increase in the LDO probe signal, representing diffusing oxygen and once substrate dosing begins, the signal drops quickly. However, the phenomenon described in this study is the opposite: there is a sharp increase in the signal during substrate dosing and a slow decrease after dosing stops.
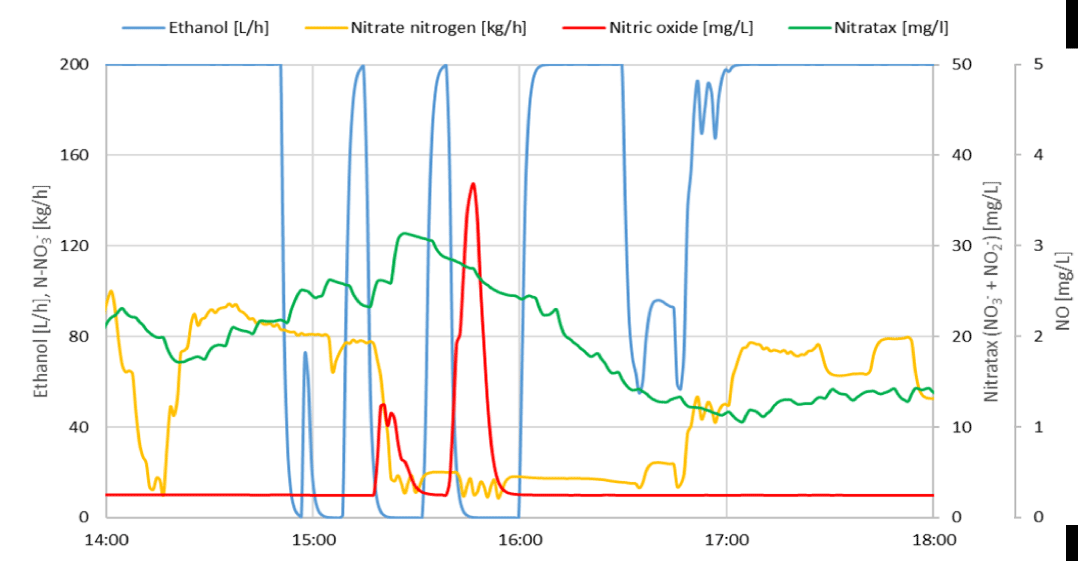
Based on these new findings the fast reduction of the substrate load should be considered as the nitrogen loading cannot be influenced too much. When increasing the response of the LDO probe, the ethanol dosage was immediately turned off. The trend of the signal reversed very quickly and began to decrease until it reached back to the zero NO concentration level. After that, the substrate dosing was resumed and the nitrate concentration in the reactor started to decrease, and the denitrification performance was restored. No more significant long-lasting inhibition was observed since substrate dosing interruptions based on LDO probe signal were applied. The following figure 7 documents the course of nitric oxide concentration in the denitrification reactor, as measured by the LDO probe and recalculated using equation 5. It can be seen that repeated reductions in the dose of ethanol lead to a rapid conversion of inhibitory NO and a return to the normal course of denitrification.
Nitratax probe (NO3- and NO2-), Nitrate ISE probe (NO3-) and LDO probe (NO).
The reason for reducing the nitrogen loading was the high concentration of nitrogen in the reactor effluent, which already exceeded the legislative limits on effluent. Apparently due to frequent substrate dosing shutdowns when nitric oxide occurred. The reduction in nitrogen loading was achieved by limiting the volume of wastewater supplied
Usually, several such occurrences are registered per week, of varying intensity but with the same course. The increase in the response of the LDO probe always follows increased dosing of ethanol, but after the quick interruption of the ethanol dosing the response of the probe drops rapidly in the range of 30 min., indicating the drop of nitric oxide concentration. To compare the duration of inhibition without timely adjustment of the substrate dosage documented by figure 5 reached up to 300 min.
A significant influence of the amount of substrate on denitrification is also suggested by the electron distribution among different nitrogen oxide reductases [34]. The results showed that electron competition occurs under not only substrate limiting but also substrate abundant conditions. N2O as a consequent product of NO reduction accumulated when the electron flux going to nitrite reduction was higher than that going to N2O reduction. Decreased inhibition can also be achieved by addition of some external reagents. For example, N2O production from denitrifying fluidized bed bioreactors can be reduced using calcium (Ca2+) dosage, but this is not very suitable for large volumes and flows of wastewater [36].
However, not every sharp increase in load will cause such a reaction of the probe, and it is not excluded that another, as yet unknown circumstance plays some role in this proces.
Relation of pH and temperature with inhibition
All measured data were evaluated in relation to inhibition states including data of pH and temperature. Table 1 presented values of pH and temperature during inhibition events.
| Table 1: pH and temperature during inhibition events. | ||
| Duration of inhibition [h] | pH in the denitrification reactor | Temperature [°C] |
| 8.5 | 7.4 | 16.0 |
| 8 | 6.1 | 30.0 |
| 18 | 6.1 | 21.2 |
| 24.5 | 6.2 | 27.6 |
| 17 | 6.2 | 31.1 |
| 14 | 6.3 | 30.8 |
| 24 | 6.9 | 27.2 |
| 8 | 7.0 | 29.6 |
Five out of the eight inhibitions observed occurred at pH lower than 6.5. Two occurred around pH 7, and in one case even pH 7.4 did not prevent inhibition. The conclusion is not quite clear, but nevertheless inhibition appeared more frequently at lower pH. An effect of lower pH was observed by others [37] who found that at a lower pH there is a more pronounced accumulation of denitrification intermediates (nitrites and nitrous oxide).
A lower temperature could also be the reason for the slowing down of the nitric oxide concentration. However, the temperature in the reactor varies from 16 to 35°C depending on the season and inhibitions occurred practically throughout this range with no significant relation to temperature.
Conclusion
Nitric oxide as intermediate product of denitrification is highly toxic and therefore responsible for inhibiting the denitrification of wastewater from nitrocellulose production and thus causes serious problems. While investigating the cause of its evolution and the possibility of its monitoring, the dependence of the oxygen probe signal on its concentration was found.
The oxygen optical luminescence (LDO) probe was calibrated to measurement of NO in absence of oxygen. The relationship is linear and can be express as NO [mg/L] = 1.866 O2 [mg/L] and as a result the concentration of nitric oxide in the wastewater can be measured.
By monitoring the increased signal of the oxygen probe caused by the presence of NO, it may be possible to intervene before the inhibition develops to a dangerous level. A sharp increase in signal from the oxygen probe is associated with high nitrate loading which, in the presence of corresponding high dose of ethanol, leads to the accumulation of nitrites as a denitrification intermediate. This accumulation, combined with an excessive dose of substrate, results in the formation of NO.
A connection between substrate excess and NO occurrence was strongly suggested by the results. Immediate short-term stop in substrate dosing after rise of the LDO signal prevented the accumulation of nitric oxide and thus the inhibition of denitrification process. Inhibition’s phenomenon seems to be independent of temperature in the range of 16-35°C.
References
- Park JY, Yoo YJ. Biological nitrate removal in industrial wastewater treatment: which electron donor we can choose. Appl Microbiol Biotechnol. 2009 Mar;82(3):415-29. doi: 10.1007/s00253-008-1799-1. Epub 2009 Jan 16. PMID: 19148639.
- Lefebvre O, Moletta R. Treatment of organic pollution in industrial saline wastewater: a literature review. Water Res. 2006 Dec;40(20):3671-82. doi: 10.1016/j.watres.2006.08.027. Epub 2006 Oct 27. PMID: 17070895.
- Luo L, Zhou W, Yuan Y, Zhong H, Zhong C. Effects of salinity shock on simultaneous nitrification and denitrification by a membrane bioreactor: Performance, sludge activity, and functional microflora. Sci Total Environ. 2021 Dec 20;801:149748. doi: 10.1016/j.scitotenv.2021.149748. Epub 2021 Aug 18. PMID: 34467905.
- Di Capua F, Milone I, Lakaniemi AM, Lens PNL, Esposito G. High-rate autotrophic denitrification in a fluidized-bed reactor at psychrophilic temperatures. Chemical Engineering Journal. 2017;313:591-598. doi: 10.1016/j.cej.2016.12.106.
- Manipura A, Duncan JR, Roman HJ, Burgess JE. Potential Biological Processes Available for Removal of Nitrogenous Compounds from Metal Industry Wastewater. Process Safety and Environmental Protection. 2005;83(5):472-480. doi: 10.1205/psep.04271.
- Mariángel L, Aspé E, Martí MC, Roeckel M. The effect of sodium chloride on the denitrification of saline fishery wastewaters. Environ Technol. 2008 Aug;29(8):871-9. doi: 10.1080/09593330802015318. PMID: 18724642.
- Biradar PM, Dhamole PB, Nair RR, Roy SB, Satpati SK, D'Souza SF, Lele SS, Pandit AB: Long-term stability of biological denitrification process for high strength nitrate removal from wastewater of uranium industry. Environmental Progress. 2008;27(3):365-372. doi: 10.1002/ep.10283.
- Dhamole PB, Nair RR, D'Souza SF, Lele SS. Denitrification of high strength nitrate waste. Bioresour Technol. 2007 Jan;98(2):247-52. doi: 10.1016/j.biortech.2006.01.019. Epub 2006 Mar 10. PMID: 16529924.
- D'Aquino A, Kalinainen N, Auvinen H, Andreottola G, Puhakka J, Palmroth M. Effects of inorganic ions on autotrophic denitrification by Thiobacillus denitrificans and on heterotrophic denitrification by an enrichment culture. Science of The Total Environment. 2023;901:165940. doi: 10.1016/j.scitotenv.2023.165940.
- Feng L, Wu G, Zhang Z, Tian Z, Li B, Cheng J, Yang G. Improving denitrification performance of biofilm technology with salt-tolerant denitrifying bacteria agent for treating high-strength nitrate and sulfate wastewater from lab-scale to pilot-scale. Bioresour Technol. 2023 Nov;387:129696. doi: 10.1016/j.biortech.2023.129696. Epub 2023 Aug 19. PMID: 37598804.
- Du R, Peng Y, Cao S, Li B, Wang S, Niu M. Mechanisms and microbial structure of partial denitrification with high nitrite accumulation. Appl Microbiol Biotechnol. 2016 Feb;100(4):2011-2021. doi: 10.1007/s00253-015-7052-9. Epub 2015 Nov 3. Erratum in: Appl Microbiol Biotechnol. 2020 Apr;104(7):3207. doi: 10.1007/s00253-020-10473-7. PMID: 26526457.
- Kampschreur MJ, Temmink H, Kleerebezem R, Jetten MS, van Loosdrecht MC. Nitrous oxide emission during wastewater treatment. Water Res. 2009 Sep;43(17):4093-103. doi: 10.1016/j.watres.2009.03.001. Epub 2009 Mar 11. PMID: 19666183.
- Zhang M, Tan Y, Fan Y, Gao J, Liu Y, Lv X, Ge L, Wu J. Nitrite accumulation, denitrification kinetic and microbial evolution in the partial denitrification process: The combined effects of carbon source and nitrate concentration. Bioresour Technol. 2022 Oct;361:127604. doi: 10.1016/j.biortech.2022.127604. Epub 2022 Jul 11. PMID: 35835421.
- Betlach MR, Tiedje JM. Kinetic explanation for accumulation of nitrite, nitric oxide, and nitrous oxide during bacterial denitrification. Appl Environ Microbiol. 1981 Dec;42(6):1074-84. doi: 10.1128/aem.42.6.1074-1084.1981. PMID: 16345900; PMCID: PMC244157.
- Casey TG, Wentzel MC, Loewenthal RE, Ekama GA, Marais GvR. A hypothesis for the cause of low F/M filament bulking in nutrient removal activated sludge systems. Water Research. 1992;26(6):867-869. doi: 10.1016/0043-1354(92)90020-5.
- Schulthess Rv, Kühni M, Gujer W: Release of nitric and nitrous oxides from denitrifying activated sludge. Water Research 1995, 29(1):215-226.
- Lu H, Chandran K, Stensel D. Microbial ecology of denitrification in biological wastewater treatment. Water Res. 2014 Nov 1;64:237-254. doi: 10.1016/j.watres.2014.06.042. Epub 2014 Jul 11. PMID: 25078442.
- Otte S, Grobben NG, Robertson LA, Jetten MS, Kuenen JG. Nitrous oxide production by Alcaligenes faecalis under transient and dynamic aerobic and anaerobic conditions. Appl Environ Microbiol. 1996 Jul;62(7):2421-6. doi: 10.1128/aem.62.7.2421-2426.1996. PMID: 8779582; PMCID: PMC168025.
- Carr GJ, Ferguson SJ. Nitric oxide formed by nitrite reductase of Paracoccus denitrificans is sufficiently stable to inhibit cytochrome oxidase activity and is reduced by its reductase under aerobic conditions. Biochim Biophys Acta. 1990 May 15;1017(1):57-62. doi: 10.1016/0005-2728(90)90178-7. PMID: 2161257.
- Iverson NM, Hofferber EM, Stapleton JA: Nitric oxide sensors for biological applications. In: Chemosensors. 2018;6. doi: 10.3390/chemosensors6010008.
- Privett BJ, Shin JH, Schoenfisch MH. Electrochemical nitric oxide sensors for physiological measurements. Chemical Society Reviews. 2010;39(6):1925-1935. doi: 10.1039/B701906H.
- Stanek R, Vodicka O, Zabranska J, Bartacek J. Denitrification of wastewater from nitrocellulose production. SOVAK. 2012;21(9):283-286.
- Mitchell TO. Luminescence based measurement of dissolved oxygen in natural waters. Hach Company. LDO White paper. 2006.
- Oh J, Silverstein J. Oxygen inhibition of activated sludge denitrification. Water Research. 1999;33(8):1925-1937. doi: 10.1016/S0043-1354(98)00365-0.
- Klaus S, Sadowski M, Jimenez J, Wett B, Chandran K, Murthy S, Bott C. Nitric oxide production interferes with aqueous dissolved oxygen sensors. Environmental Engineering Science. 2017;34. doi: 10.1089/ees.2016.0634.
- Ford PC, Miranda KM. The solution chemistry of nitric oxide and other reactive nitrogen species. Nitric Oxide. 2020 Oct 1;103:31-46. doi: 10.1016/j.niox.2020.07.004. Epub 2020 Jul 25. PMID: 32721555.
- Ford PC, Wink DA, Stanbury DM. Autoxidation kinetics of aqueous nitric oxide. FEBS Lett. 1993 Jul 12;326(1-3):1-3. doi: 10.1016/0014-5793(93)81748-o. PMID: 8325356.
- Zacharia IG, Deen WM. Diffusivity and solubility of nitric oxide in water and saline. Ann Biomed Eng. 2005 Feb;33(2):214-22. doi: 10.1007/s10439-005-8980-9. PMID: 15771275.
- Ignarro LJ. Nitric oxide: Biology and Pathobiology Academic Press; 2000.
- Ignarro LJ, Fukuto JM, Griscavage JM, Rogers NE, Byrns RE. Oxidation of nitric oxide in aqueous solution to nitrite but not nitrate: comparison with enzymatically formed nitric oxide from L-arginine. Proc Natl Acad Sci U S A. 1993 Sep 1;90(17):8103-7. doi: 10.1073/pnas.90.17.8103. PMID: 7690141; PMCID: PMC47296.
- Klaus S, Sadowski M, Jimenez J, Wett B, Chandran K, Murthy S, Bott CB. Nitric oxide production interferes with aqueous dissolved oxygen sensors. Environmental Engineering Science. 2017;34(9):687-691. doi: 10.1089/ees.2016.0634
- Iverson NM, Hofferber EM, Stapleton JA. Nitric oxide sensors for biological applications. 2018;6(1):8. doi: 10.3390/chemosensors6010008.
- Jones CM, Stres B, Rosenquist M, Hallin S. Phylogenetic analysis of nitrite, nitric oxide, and nitrous oxide respiratory enzymes reveal a complex evolutionary history for denitrification. Mol Biol Evol. 2008 Sep;25(9):1955-66. doi: 10.1093/molbev/msn146. Epub 2008 Jul 8. PMID: 18614527.
- Pan Y, Ni BJ, Bond PL, Ye L, Yuan Z. Electron competition among nitrogen oxides reduction during methanol-utilizing denitrification in wastewater treatment. Water Res. 2013 Jun 15;47(10):3273-81. doi: 10.1016/j.watres.2013.02.054. Epub 2013 Mar 14. PMID: 23622815.
- Thakur IS, Medhi K. Nitrification and denitrification processes for mitigation of nitrous oxide from waste water treatment plants for biovalorization: Challenges and opportunities. Bioresour Technol. 2019 Jun;282:502-513. doi: 10.1016/j.biortech.2019.03.069. Epub 2019 Mar 14. PMID: 30898409.
- Eldyasti A, Nakhla G, Zhu J. Mitigation of nitrous oxide (N2O) emissions from denitrifying fluidized bed bioreactors (DFBBRs) using calcium. Bioresour Technol. 2014 Dec;173:272-283. doi: 10.1016/j.biortech.2014.09.121. Epub 2014 Sep 30. PMID: 25310863.
- Pan Y, Ye L, Ni BJ, Yuan Z. Effect of pH on N2O reduction and accumulation during denitrification by methanol utilizing denitrifiers. Water Res. 2012 Oct 1;46(15):4832-40. doi: 10.1016/j.watres.2012.06.003. Epub 2012 Jun 15. PMID: 22749904.
Content Alerts
SignUp to our
Content alerts.
 This work is licensed under a Creative Commons Attribution 4.0 International License.


