Medicine Group . 2023 August 10;4(8):1184-1193. doi: 10.37871/jbres1785.
Ultrasonic-Assisted Extraction of Bioactive Compounds from Elecampagne (Inula helenium, Radix Inulae)
Vasile Staicu1*, Justinian Andrei Tomescu1, Mihaela Neagu2, Adriana Popescu3, Mariana Popescu4, Cristina Manea2 and Ioan Călinescu5
2SC Hofigal Export Import SA, Bucharest, Romania
3Department of Bio-Physics and Medical Physics, University of Bucharest, Romania
4Faculty of Pharmacy, University Titu Maiorescu, Romania
5Bioresources and Polymer Science Department, Faculty of Chemical Engineering and Biotehnologies, University Politehnica of Bucharest, Romania
- Alantolactone
- Isoalantolactone
- Ultrasound
- Inulin
Abstract
In this study, we had developed a method of ultrasound assisted extraction from Elecampane in order to obtain, identify and the dosing the main bioactive compounds from plant, such as: alantolactone and isoalantolactone, inulin etc. Aqueous/hydroalcoholic extraction assisted by ultrasound, was used in order to obtain plant extracts rich in bioactive compounds, in order to ensure the highest possible extraction yield (exhausting the plant). In the process of extracting bioactive compounds from plant, the acoustic energy of the ultrasound is not absorbed by the molecules and, as such, has an effect of breaking the cell walls and improving the mass transfer. Ultrasound are transmitted in the reaction medium in the form of pressure waves that induce vibrational movements of the molecules, thus the molecular structure of the medium, alternately, it compresses and expands, as a result of a pressure, that varies over time. When the ultrasound intensity is high enough, the expansion cycle can create bubbles or cavities. Cavitation is the process by which bubbles form, grow and undergo implosion. Ultrasound allows the solvent to penetrate the cell walls, and the bubbles produced by the acoustic cavitation favor the breaking of the cell wall and the release of the active compounds, increasing the reaction yield.
A high content from these compounds, make the plant to be used in the treatment of different respiratory diseases (asthma, cold, flu), indigestion, intestinal parasites etc.
Recent studies had shown that the extracts from dried root of Elecampane have antitumor and antimicrobial effect and also detox and anti-inflammatory action.
Introduction
Elecampane is sporadically cultivated as a medicinal plant, but often it is found in spontaneous flora, in wet places from meadows, everglades, orchards and vineyards. It is used in traditional medicine for headaches, colds, tuberculosis, stomach diseases. The root of Elecampane contains Inulin (40-50%), volatile oils, alantolactone, the leaves contain alantopicrine (sour principle), vitamin C, mineral salts and the flowers contain helenina.
Active principles give it, diuretic, anti-inflammatory, anti-rheumatic properties, and sour principles of alantolactone and isoalantolactone give it, general tonic properties and moderate anti-tumor properties.
Elecampane roots, harvested in the fall, after the 2-3 year of vegetation, are traditionally used for skin conditions, bronchitis, helmithic diseases [1], against asthma, expectorant and insecticide [2], diaphoretic and antibacterial agent [3].
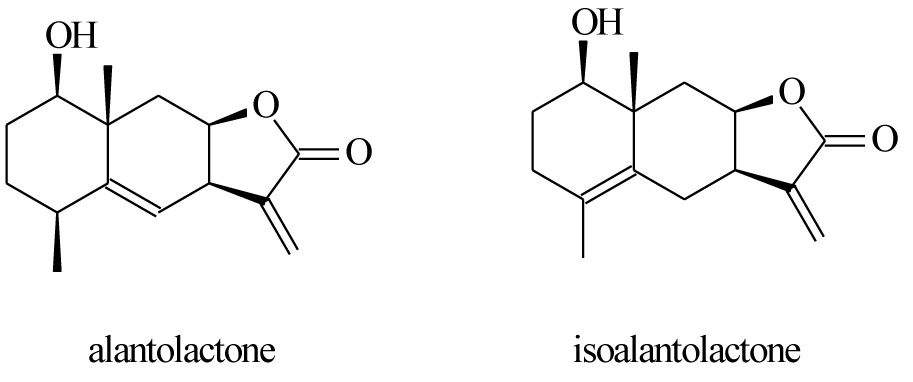
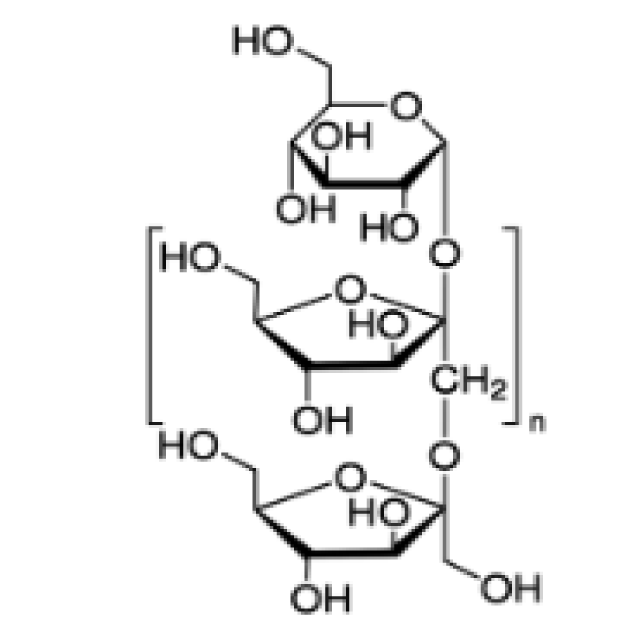
Native Americans used elecampane decoction to treat lung disorders and tuberculosis [4]. Some specialized article show that polyphenols and flavones from elecampane have antioxidant [5], antitumor [6] and immunomodulatory properties [7]. Other articles show that the extracts from elecampane, in the form of fractions, obtained by column chromatography, have an important activity against Mycobacterium Tuberculosis, in particular, due to the 2 lactones in the composition, alantolactone and isoalantolactone [8]. The structures of alantolactone, isoalantolactone and inulin are presented in figures 1,2. Figure 3 shows images of the elecampagne plant.
In this study we set out to identify and dose the active aqueous/hydroalcoholic extracts, from the root of the elecampagne, the dried, ground and sieved plant. Aqueous/hydroalcoholic extraction assisted by ultrasound, was used in order to obtain plant extracts rich in bioactive compounds, in order to ensure the highest possible extraction yield (exhausting the plant). In the process of extracting bioactive compounds from plant, the acoustic energy of the ultrasound is not absorbed by the molecules and, as such, has an effect of breaking the cell walls and improving the mass transfer. Ultrasound are transmitted in the reaction medium in the form of pressure waves that induce vibrational movements of the molecules, thus the molecular structure of the medium, alternately, it compresses and expands, as a result of a pressure, that varies over time. When the ultrasound intensity is high enough, the expansion cycle can create bubbles or cavities. Cavitation is the process by which bubbles form, grow and undergo implosion [11,12]. Ultrasound allows the solvent to penetrate the cell walls, and the bubbles produced by the acoustic cavitation favor the breaking of the cell wall and the release of the active compounds, increasing the reaction yield [13].
Physico-chemical analysis was performed to determine total polyphenols (expressed in gallic acid) total flavones (expressed in quercitin) as well as the antioxidant capacity, for de extracts used. The volatile compounds were extracted, using the method described in the European Pharmacopoeia [14] starting from 50 g of elecampagne root, and the chromatographic profile of the volatile compounds from the extracted oils was analyzed by GS-MS, in which alantolactone and isoalantolactone were identified.
Materials and Methods
Materials
The root of Elecampane was harvested, in 2022, from Hofigal SA. This was washed and then dried on artificial dryer Biovita, in controlled regime (at 40°C, for a period of 48 hours). Biovita dryer is a dehydrator with hot air, with trays. After drying, the plant is grinded in the mill GM-200, of laboratory, supplier RETSCH-VERDER-Romania, at granulation 1-2 mm, for dried plant and 1-3 mm for fresh, undried plant.
The reagent Folin-Ciocălteu, Fehling, CuSO4, Neocuproine, sodium acetate, aluminium chloride, ethanol, methanol and the other used solvents and reagents are of analytical purity (chemical pure, cp or for analyze, pa).
Ultrasonication apparatus is a cuvette ELMASONIC P type, Elma, with PULSE application, working frequency 80 KHz, max.1130 W power, with displaying of working temperature and setting of the working time.
Working method
In this study, the extraction assisted by ultrasound of the elecampagne root it was followed, in the presence of water or ethanol (aqueous solutions of 50 or 96.5%) as solvent, according to scheme 1 shown below. For sample 5(P5), in order to obtain an inulin concentrate, I used the method from the literature [15], with 60 g of elecampagne root, in methanol solvent, R = 1/5, in the presence of ultrasound, followed by precipitation of inulin with 96% ethanol.
The elecampagne the fresh root, was harvested in October-November 2022, it was cleaned of soil, washed, dried and ground in laboratory mill, GM 200. The cited fraction, between 315-500 µm, was used for de following five types of extraction (Scheme 1):
| Scheme 1: Working method. | |||
| Sample | Dried Plant, g (Elecampagne) | Solvent | Treatment |
| P1 | 1 | 50 mL ultrapur water | 15 min. grinding + 15 min. US |
| P2 | 1 | 50 mL ethanol 96.5% | idem |
| P3 | 1 | 50 mL ethanol 50% | idem |
| P4 | 20 | 200 mL ethanol 50% | 15 min. grinding + one hour US |
| P5 | 60 | 300 mL methanol | Maceration, 7 days, one hour US, concentration, precipitation with ethanol 96% and analysis of precipitate [15]. |
| Note 1: This sample (P5) was studied to obtain, with the help of maceration and ultrasound, an increased dosage yield of inulin from elecampagne root, by extraction in methanol and precipitation with 96% ethanol. Then, by comparing the result with the data from the literature, we will be able to observe the positive effect of applying ultrasound in order to increase the reaction yield. Note 2: Filter the solution after each ultrasound. |
|||
Sample processing for analysis (samples 1-4): 1 g of the prepared sample (of the 4 samples - solution) is weighed on the analytical balance into a weighing vial, then placed in a 10mL volumetric flask and adjusted with the same solvent (ultrapure water, HA 50%, or ethanol 96.5%) for each sample in which the plant material was extracted.
Sample 5: For the determination of inulin in the precipitate using the spectrophotometric method, weigh 1.0 gram of the precipitate into a weighing vial on the analytical balance, and crush with 5 mL or 10 mL of ultrapure water at a room temperature of 25ºC. Leave for 10 minutes, filter through a Whatman filter with pore size 8-12 μm into a 100 mL volumetric flask and wash the Whatman filter with ultrapure water, repeat the crushing operation several times with small volumes of ultrapure water until the filter remains clean and add to the mark with the same solvent.
Methods of analysis
Total Polyphenol Content (TPC), expressed as gallic acid equivalent: The Total Polyphenol Content (TPC) was assessed using the Folin-Ciocâlteu method [16].
The absorbance was measured at 765 nm against ultrapure water with a Jasco V-530 UV/VIS spectrophotometer and the total polyphenol content was determined using the standard gallic acid calibration curve with concentrations ranging from 5 to 100 μg/100 mL and expressed as gallic acid equivalent (mg/g).
The Total Flavone Content (TFC): Was determined using the method described by Marinova D, et al. [17], namely the spectrophotometric method in the presence of aluminium chloride, using quercetin (λ = 510 nm) as analytical standard.
This method is based on the formation of a light reddish-brown colored complex following the reaction of flavonoids and aluminium chloride in a weakly acidic medium. The total flavonoid content was expressed as quercetin equivalent (mg/g) [17].
The absorbance was measured at 510 nm against a control prepared with water instead of the extract sample with a Jasco V-530 UV/VIS spectrophotometer, and the TFC was determined using a standard quercetin calibration curve with concentrations ranging from 5 to 100 µg /mL and expressed as quercetin equivalent per gram.
Total antioxidant capacity (Ac AO) by CUPRAC (CAT-CUPRAC-Reducing Antioxidant Power) method: The CUPRAC method described and modified by Özyürek M, et al [18], is based on the total antioxidant capacity (CAT-CUPRAC-Reducing Antioxidant Power) by reducing the cupric ion Cu2+ to the cuprous ion Cu+. The antioxidant activity is measured using a Jasco V-530 UV/VIS spectrophotometer, based on a calibration curve using Trolox (antioxidant substance) of known concentrations as standard, at a wavelength λ = 450 nm [18,19].
Determination of the antioxidant capacity FRAP II λ = 593 nm (by reducing Fe3+ to Fe2+) (Ferric reducing antioxidant power): This Frap II method relies on the reducing power of biologically active compounds associated with their electron-donating capacity, thus reducing ferric ions to ferrous ions, which form an intensely violet-blue colored complex under acidic pH [20,21].
The inulin content (P5) is determined using the spectrophotometric method (UV-VIS): At an absorbance of 413 nm, using perchloric acid, resorcinol and hydrochloric acid as reagents, based on a previously established calibration curve [22,23].
GS-MS identification of the active substances, alantolactone and isoalantolactone: Analyses were performed using the Thermo Scientific Focus GC gas chromatograph with a Macropol 20,000 R column (0.25 µm film thickness, 60 m length and 0.25 mm diameter). The mobile phase used was helium at a flow rate of 1.5 mL/min, while the sample injection volume was 1 µL. The Thermo Scientific DSQII mass spectrometer was used for detection.
Elecampane, raw material, dried, ground and sieved plant is prepared for GS-MS, same as sample 2 (dried plant + ethanol 96.5%, grinding, US, filtration, concentration, uptake in HA 50%). The GS-MS identification of active substances in elecampane is also performed for sample 4, as sample 4 is the extraction method for active substances very common in practice (solvent : plant ratio = 10:1, v/m, US, 1 hour, solvent, ethanol 50%). For both determinations, raw material and sample 4, the sample preparation for GS-MS analysis involves the following procedure:
A volume of 50 mL of the extract prepared as above (HA 50%) is placed in a separating funnel with a volume of 10 mL hexane. After stirring, leave to stand for separation of the two layers (hexane and hydroalcohol). The hydroalcoholic layer is removed from the separation funnel, and the hexane layer is run over anhydrous sodium sulfate to remove traces of water, then filtered through a 0.2µm filter, and injected into the system.
Statistical methods
All 5 analyzed samples were carried out in triplicate and the data were expressed as mean value ± SD (Standard Deviation) for triplicate of samples (n = 3). All the results were subjected to one-way Analysis of Variance (ANOVA). Statistical analysis of the data was performed using the multiple comparison post hoc t-tests in order to detect the significant statistical differences between the averages of the Total Polyphenol Content (TPC) and Total Flavone Content (TFC) of two or more independent groups. The differences were considered statistically significant at p < 0.05 as a minimal level of significance.
Results and Discussion
The results of the above analyses are listed in tables 1,2 below.
| Table 1: Values of total polyphenols and flavones, mg/mL and mg/gDM. | |||||||||
| Crt. No. | Analysis Description | Concentration Solutions, Scheme 1, mg/mL | Content Solutions, Scheme 1, mg/gDM (extraction yield) |
||||||
| P1 | P2 | P3 | P4 | P1 | P2 | P3 | P4 | ||
| 1 | Total flavones | 0.28 | 0.233 | 0.639 | 2.042 | 14 | 11.65 | 31.95 | 20.42 |
| 2. | Total polyphenols | 0.103 | 0.401 | 0.172 | 0.665 | 5.15 | 20.05 | 8.6 | 6.65 |
| Table 2: Antioxidant capacity values, mg/g, CUPRAC and FRAP 2. | |||||
| Crt. no. | Analysis Description | Obtained Values, mg/g, Antioxidant Capacity, P1, P2, P3, P4, Scheme 1. | |||
| P1 | P2 | P3 | P4 | ||
| 1. | Antioxidant capacity, CUPRAC, expressed in TROLOX | 0.172 | 0.504 | 0.376 | 2.141 |
| 2. | Antioxidant capacity, FRAP2expressed in FeSO4xH2O | 0.199 | 0.059 | 0.375 | 1.539 |
Total Polyphenol Content (TPC)
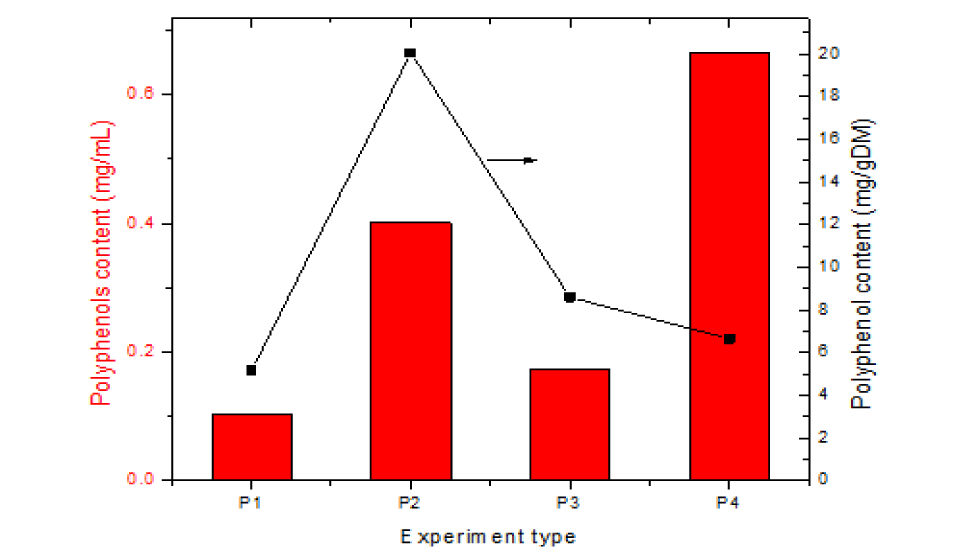
The data analysis in table 1 shows that the solvent is very important, the replacement of water with ethanol (96.5%) causes a significant increase in the amount of polyphenols (about four times compared to the water solvent). When ethanol is used as solvent 50% the amount of polyphenols extracted decreases but remains higher than when only water is used. In terms of plant: solvent ratio, a plant: solvent ratio of 1 to 50 was used in the first three types of extractions. Under these conditions the amount of extracted compounds is higher (expressed in mg/gDM) (sample 3 compared to sample 4) but the concentration of the obtained solutions is too low for commercial uses (expressed in mg/mL). For commercial uses the best conditions are those of experiment 4, where 50% ethanol solution in a S:L ratio of 1:10 is used as solvent and the solutions are sufficiently concentrated to be used in food supplements.
The chart representation of the results in table 1 is shown in figure 4. From the chart shown in figure 4 it appears that sample 4 provides the most concentrated solutions.
It can be concluded that the best method for extracting polyphenols from dried elecampagne root is the US-assisted hydroalcoholic extraction at an optimal plant/solvent ratio, R = 1/10.
Total Flavones Content (TFC)
According to the data in table 1 the best solvent for flavone extraction is 50% ethanol. Again, changing the S:L ratio from 1:50 (experiments 1-3) to 1:10 (experiment 4) leads to a decrease in the amount of extracted flavones (expressed in mg/gDM). However, the fact that a sufficiently high concentration is obtained in solution (expressed in mg/mL) makes this type of extraction suitable for commercial applications.
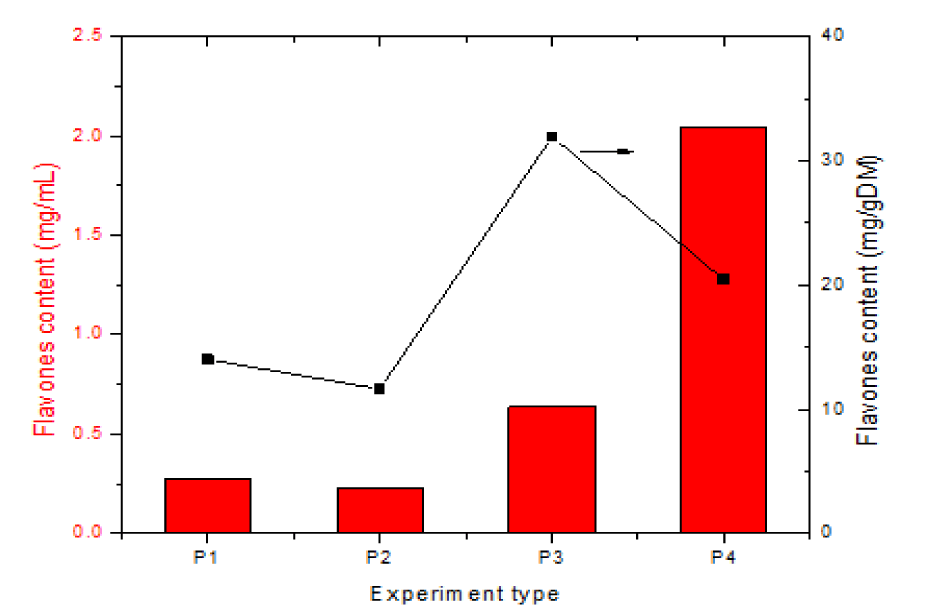
The chart representation of the data in table 1 is shown in figure 5.
As shown in the chart and data in table 1, concentration of total flavones are 2.3 times higher in the HA 50% hydroalcoholic extract, with R = 1/50, than in P1 and 7.3 times higher in the HA 50% hydroalcoholic extract, with R = 1/10, US, one hour, than in P1. It shows that the method most often used in practice, i.e., ultrasonic-assisted extraction in hydroalcoholic solvent at the optimum plant/solvent ratio, R = 1/10, gives the best results. The lowest flavone values of 0.233 mg/mL (for sample 2) indicate lower flavone extraction in concentrated alcohol, 96.5% ethanol.
Antioxidant capacity CUPRAC
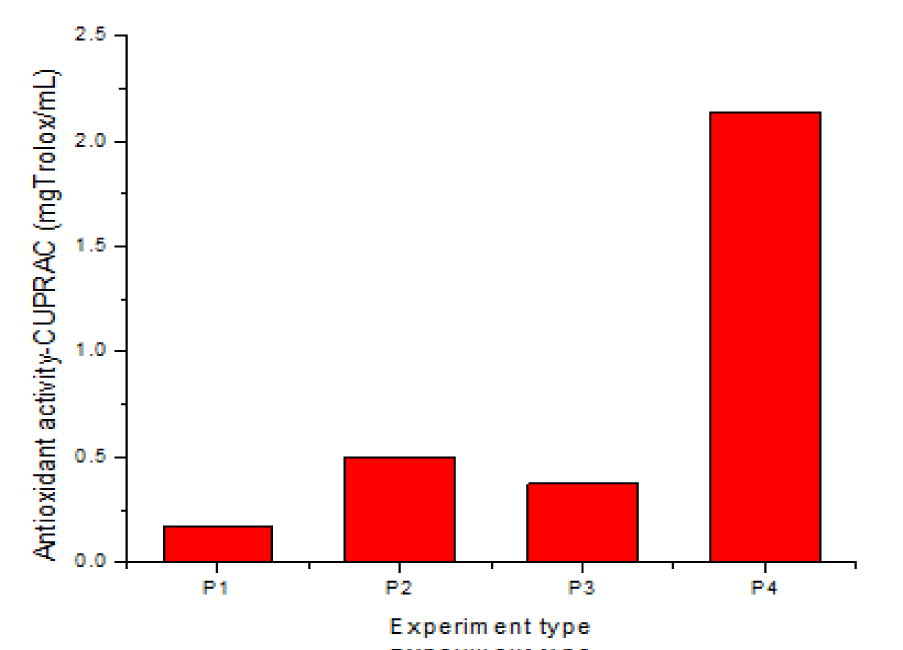
The data in table 2 show that the values for CUPRAC antioxidant activity, (expressed as TROLOX, mg/g) for the extracts studied have the following values: 0.172 mg/g for P1, 0.504 mg/g for ethanolic extract 96.5%, 0.376 mg/g for hydroalcoholic extract HA 50%, with plant/solvent ratio R = 1/50 and 2.141 mg/g for HA 50%, with R = 1/10. The chart representation of the results obtained for CUPRAC is shown in figure 6.
As shown in the chart and the data in table 2, the CUPRAC values are lower in hydroalcoholic solvent, HA 50%, than in ethanol 96.5%, with the same plant/solvent ratio, R = 1/50 and the same ultrasonication time, 15 min, but double/triple compared to P1. However, by increasing the ultrasonication time from 15 min. to one hour and by improving the plant/solvent ratio fivefold, at R = 1/10, the CUPRAC values also reach values 5.7 times higher (sample 4 compared to sample 3) and 12 times higher than the values obtained in aqueous extraction (P1). The extraction conditions for sample 4, i.e. plant/solvent ratio R = 1/10, US, one hour and hydroalcoholic solvent HA 50%, are the most favourable for the extraction of active principles, including CUPRAC, which is also confirmed in industrial practice for the Elecampane root.
Antioxidant capacity FRAP 2
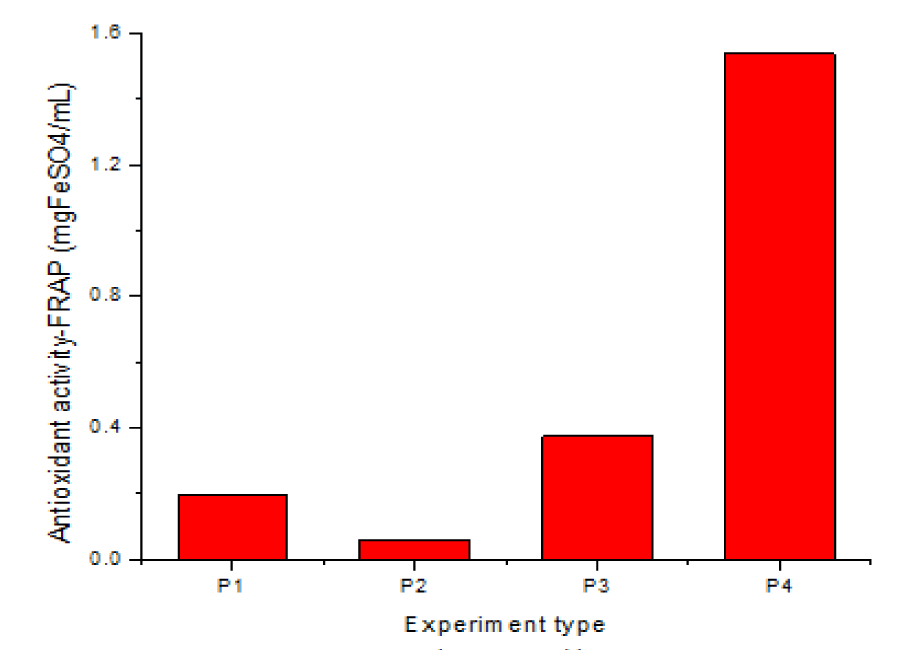
The data in table 2 show that the antioxidant activity, FRAP 2 (expressed in mg/g FeSO4H2O) has a value of 0.199 mg/g for P1, 0.059 mg/g for ethanolic extraction 96.5%, lower than P1, 0.375 mg/g for hydroalcoholic extraction HA 50% and 1.539 mg/g for sample 4, which meets the most favorable extraction conditions: plant/solvent ratio R = 1/10, US, one hour, hydroalcoholic solvent Ha 50%. The chart representation of the data in table 2 for FRAP 2 is shown in figure 7.
From the chart representation and the data in table 2, the FRAP 2 values increase relative to P1 in the hydroalcoholic extracts, twice for R = 1/50 and US, 15 min. and reach 7.7 times higher values for the most favorable conditions obtained for sample 4, i.e.: US, one hour, HA 50%, R = 1/10.
Regarding the ratio between the antioxidant capacity values, CUPRAC or FRAP 2, they are approximately equal in most of the samples, except for sample 2, where CUPRAC has values 10 times higher than FRAP 2, which shows that the mechanism of FRAP 2 (ferric reducing antioxidant power) mechanism does not occur in 96% ethanol medium.
Taking into account all studied parameters (TPC, flavone content and antioxidant activities) the best results for the studied extractions or obtained for sample 4, with the following conditions: extraction time assisted by US 60 min, solvent HA 50%, R = 1/10. These conditions represent the most favorable way of working encountered in practice.
From the data presented above, it follows that the concentration of polyphenols, flavones and antioxidant activity is positively influenced by the concentration of the solvent, leading to the highest values for ethanol 50%, but equally by the solvent/plant ratio(R) (m/v), for which R = 10/1 is the optimal value obtained. This optimal ratio between solvent and plant leads to at least double the values of the bioactive compound concentration (expressed in mg/mL) compared to the other ratio, R = 50/1. This has a high economic efficiency by using small amounts of solvent. The optimal ratio, R = 10/1, favors the vibrational movements of the molecules so that the molecular structure of the solvent, under the influence of ultrasound, compressed and expands, favoring the penetration of the solvent inside the cells and the release of active compounds, increasing the reaction yield.
The inulin contend (P5) analyzed in chapter Methods of analysis, has a value of 383.2 mg/g(38.32%),which corresponds to the literature data
According to Bokov DO, et al. [24], the inulin content should be min. 25%, in the dry plant and according to Petkova NT, et al. [25], the inulin content is 32-33%. With the extraction in methanol, daily stirring, US, 1 hour, followed by precipitation of inulin with 96% ethanol [15], we managed to increase the value of the inulin content dosed from the dried plant to 38.32%.
GS-MS identification of the active substances, alantolactone and isoalantolactone
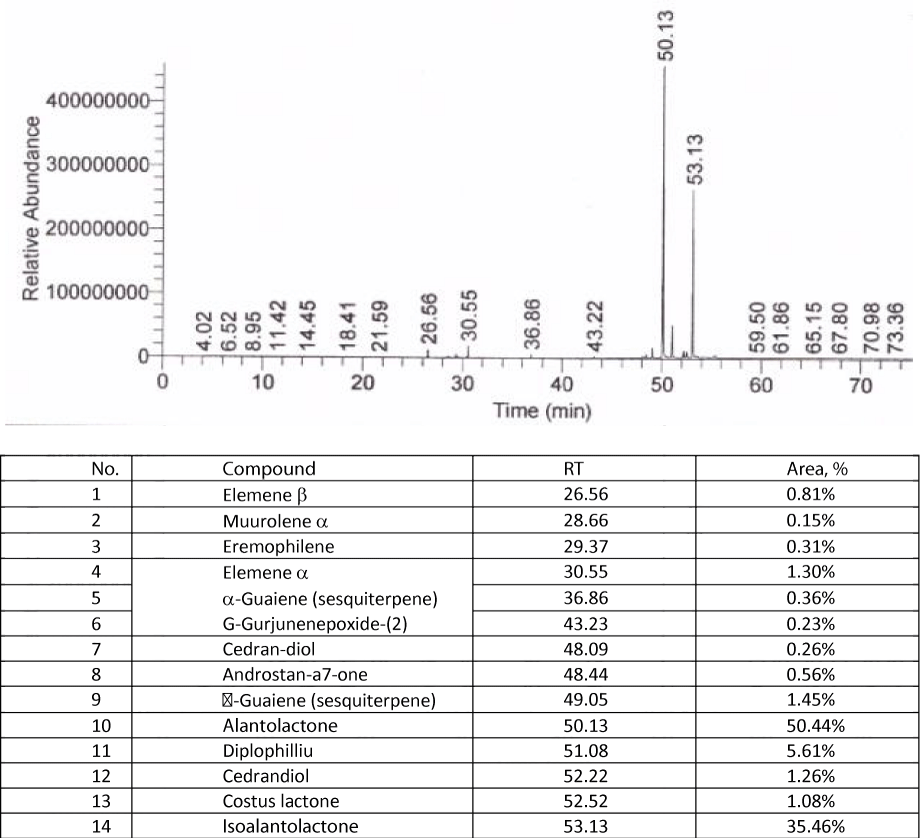
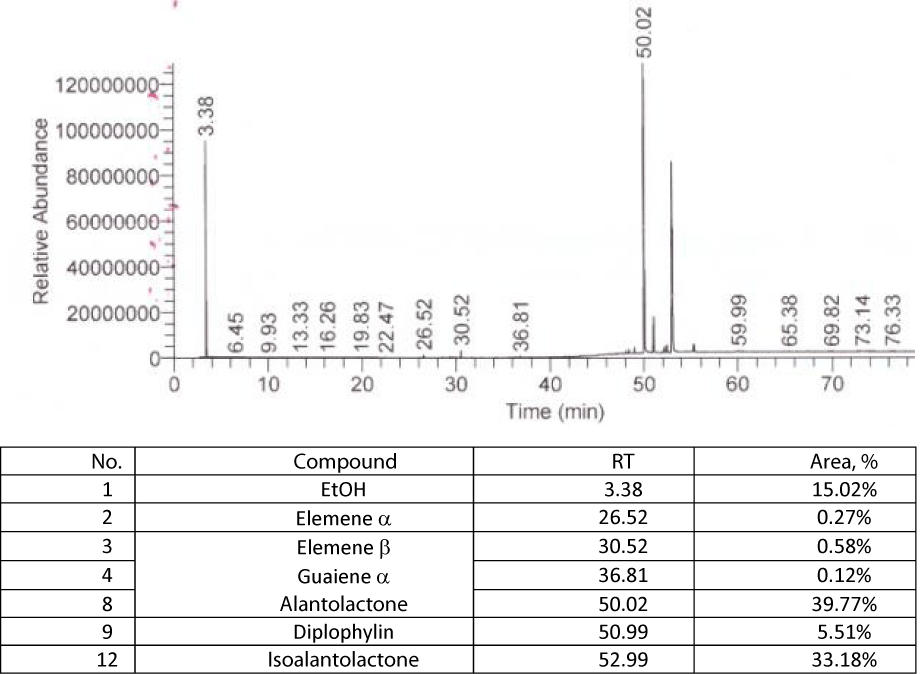
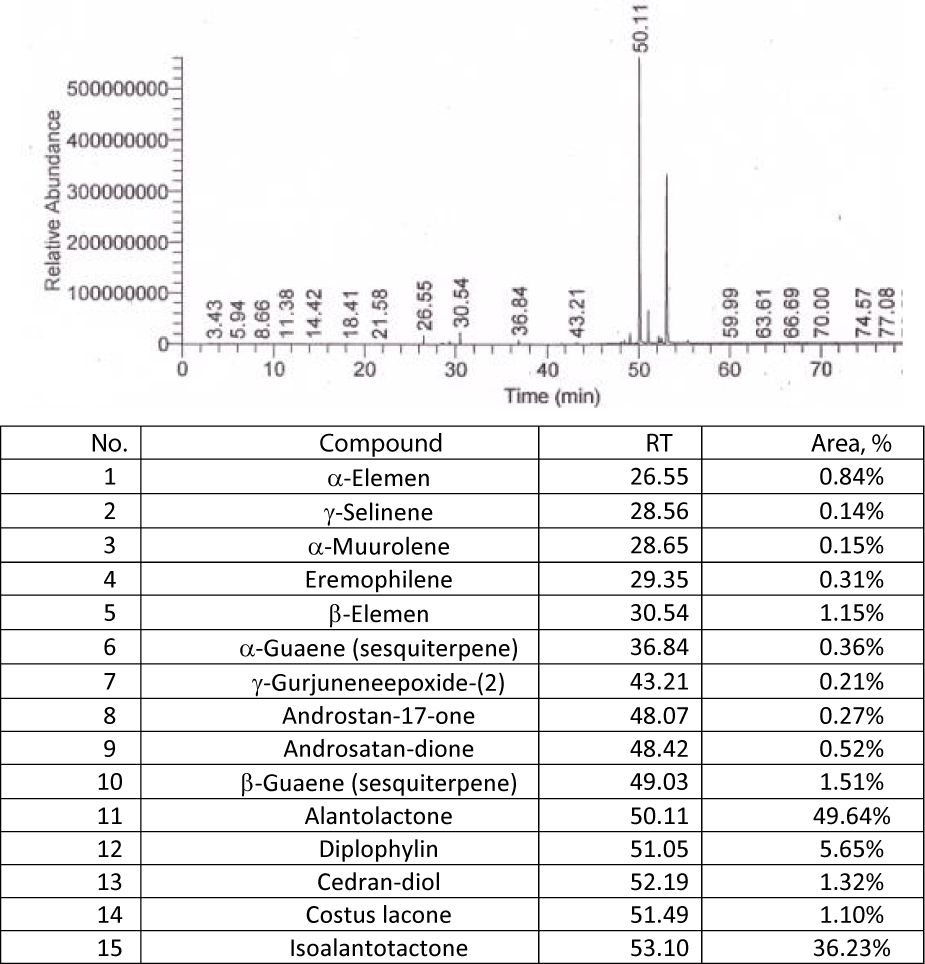
The identification of the active substances in the elecampagne, alantolactone and isoalantolactone, using the GS-MS was carried out for the dry raw material and for sample 4, an extraction often used in current practice. The resulting chromatograms, following the procedure described in chapter Methods of analysis, are shown bellow in figures 8,9. The two active substances, alantolactone and isoalantolactone have the largest peak area, making them the main bioactive compounds in elecampane root, raw material or hydroalcoholic extract, with the value of the cumulative concentrations for the two alantolactones reaching 86%, which is extremely beneficial for the treatment of respiratory diseases and for the antitumor and antimicrobial effect of elecampagne root products.
We had determined by distillation (method from European Pharmacopoeia, [14]) the content of volatile oils from plant, obtaining a value of 0.25 mL per 50 g of the sample taken in the work, i.e. a value of 5 mL per kg of dry plant, and we analyzed, GS-MS, the volatile oil. We identified the existence of alantolactone and isoalantolactone in chemical composition of these oils, using the library of spectra NIST. Below we give GS-MS chromatogram for the volatile oil of Elecampane, figure 10.
Conclusion
In this study the extraction of the bioactive compounds from the elecampagne root was followed, considering the importance of this plant in the treatment of various ailments. Using the US-assisted extraction of the active compounds from the elecampagne root, we obtained results comparable to those in specialized literature. The most suitable solvent was the hydroalcoholic solution of ethanol in ratio S:L of 1:10.
Ultrasound assisted extraction of bioactive compounds from inula root is highly efficient, requires low energy, small amounts of solvent and short periods of time to carry out the extraction process. It works at ambient temperature, thus avoiding possible damage to active plant substances, an important thing for industry.
Applying this protocol of extraction, we had demonstrated a high efficiency in the separation and the extraction of the compounds from plant, with perspectives of application in pharmaceutical industry, in particular, for obtaining dietary supplements and of dermato-cosmetic products.
Acknowledgment
The authors are grateful for the financial support received, in the form of scholarships, through the Human Capital Operational Program, Priority Axis 6-Education and skills, Project: Training of doctoral students and postdoctoral researchers in order to acquire applied research skills- SMART, MySMIS code:153734.
The authors acknowledge the financial support received from the Competitiveness Operational Programme 2014-2020, Action 1.1.4: Attracting high-level personnel from abroad in order to enhance the RD capacity, ID project P_37_471, MySMIS 105145, Ultrasonic/Microwave Nonconventional Techniques as New Tools for Nonchemical and Chemical Processes, financed by contract 47/5 September 2016.
References
- Seca AM, Grigore A, Pinto DC, Silva AM. The genus Inula and their metabolites: from ethnopharmacological to medicinal uses. J Ethnopharmacol. 2014 Jun 11;154(2):286-310. doi: 10.1016/j.jep.2014.04.010. Epub 2014 Apr 19. PMID: 24754913.
- Chevallier A. Encyclopedia of Medicinal Plants. In: Kindersley D, editor. Dorling Kindersley Publishers Ltd; 2001.
- Abed KM, Noori WO, Darwesh OM. Extraction of bio-active compounds extracted from Inula helenium roots by leaching process. Research Journal of Pharmaceutical, Biological and Chemical Sciences. 2014;5(6):254-261.
- Moerman DE. The medicinal flora of Native North America: an analysis. J Ethnopharmacol. 1991 Jan;31(1):1-42. doi: 10.1016/0378-8741(91)90141-y. PMID: 2030588.
- Stratil P, Klejdus B, Kubán V. Determination of total content of phenolic compounds and their antioxidant activity in vegetables--evaluation of spectrophotometric methods. J Agric Food Chem. 2006 Feb 8;54(3):607-16. doi: 10.1021/jf052334j. PMID: 16448157.
- Sawa T, Nakao M, Akaike T, Ono K, Maeda H. Alkylperoxyl radical-scavenging activity of various flavonoids and other phenolic compounds: implications for the anti-tumor-promoter effect of vegetables. J Agric Food Chem. 1999 Feb;47(2):397-402. doi: 10.1021/jf980765e. PMID: 10563906.
- Park JH, Lee JK, Kim HS, Chung ST, Eom JH, Kim KA, Chung SJ, Paik SY, Oh HY. Immunomodulatory effect of caffeic acid phenethyl ester in Balb/c mice. Int Immunopharmacol. 2004 Mar;4(3):429-36. doi: 10.1016/j.intimp.2004.01.013. PMID: 15037220.
- Cantrell CL, Abate L, Fronczek FR, Franzblau SG, Quijano L, Fischer NH. Antimycobacterial eudesmanolides from Inula helenium and Rudbeckia subtomentosa. Planta Med. 1999 May;65(4):351-5. doi: 10.1055/s-1999-14001. PMID: 10364842.
- Marshal J, Cohen N. The structure of alantolactone. J Org Chem. 1964;29(12):3727-3729. doi: 10.1021/jo01035a527
- Richardson AM, Tyuftin AA, Kilcawley KN, Gallagher E, O'Sullivan MG, Kerry JP. The Application of Pureed Butter Beans and a Combination of Inulin and Rebaudioside A for the Replacement of Fat and Sucrose in Sponge Cake: Sensory and Physicochemical Analysis. Foods. 2021 Jan 26;10(2):254. doi: 10.3390/foods10020254. PMID: 33530603; PMCID: PMC7911311.
- Drăgan O, Iancu C. Ultrasunete de mari energii. Editura Academiei Republicii Socialiste România. 1983.
- Chemat F, Rombaut N, Sicaire AG, Meullemiestre A, Fabiano-Tixier AS, Abert-Vian M. Ultrasound assisted extraction of food and natural products. Mechanisms, techniques, combinations, protocols and applications. A review. Ultrason Sonochem. 2017 Jan;34:540-560. doi: 10.1016/j.ultsonch.2016.06.035. Epub 2016 Jun 23. PMID: 27773280.
- Da-Wei L, Liang-Wu B, Zhen-Dong Z, Dong-Mei L, Xian-Zhang L. Optimization of ultrasound-assisted extraction of carnosic acid from rosemary leaves. Chemistry and Industry of Forest Products. 2011;31(3):60-64.
- Council of Europe. Farmacopeea Europeeana. 10th ed.
- Konishi T, Shimada Y, Nagao T, Okabe H, Konoshima T. Antiproliferative sesquiterpene lactones from the roots of Inula helenium. Biol Pharm Bull. 2002 Oct;25(10):1370-2. doi: 10.1248/bpb.25.1370. PMID: 12392098.
- Kamboj A, Rana A, Deep Kaur R, Jain UK. Application and analysis of the Folin Ciocalteu method for the determination of the total phenolic content from leaves, stems and seeds of Cucumis sativus L. Journal of Pharmacy Research. 2015;9(5):323-329.
- Marinova D, Ribarova F, Atanassova M. Total phenolics and total flavonoids in Bulgarian fruits and vegetables. Journal of the University of Chemical Technology and Metallurgy. 2005;40(3):255-260.
- Özyürek M, Güçlü K, Apak R. The main and modified CUPRAC methods of antioxidant measurement. TrAC Trends in Analytical Chemistry. 2011;30(4):652-664. doi: 10.1016/j.trac.2010.11.016.
- Apak R, Güçlü K, Ozyürek M, Karademir SE. Novel total antioxidant capacity index for dietary polyphenols and vitamins C and E, using their cupric ion reducing capability in the presence of neocuproine: CUPRAC method. J Agric Food Chem. 2004 Dec 29;52(26):7970-81. doi: 10.1021/jf048741x. PMID: 15612784.
- Benzie IF, Strain JJ. The ferric reducing ability of plasma (FRAP) as a measure of "antioxidant power": the FRAP assay. Anal Biochem. 1996 Jul 15;239(1):70-6. doi: 10.1006/abio.1996.0292. PMID: 8660627.
- Benzie IF, Szeto YT. Total antioxidant capacity of teas by the ferric reducing/antioxidant power assay. J Agric Food Chem. 1999 Feb;47(2):633-6. doi: 10.1021/jf9807768. PMID: 10563944.
- Sánchez-Viesca F, Gómez R. Reactivities involved in the Seliwanoff reaction. Modern Chemistry. 2018;6(1):1-5. doi: 10.11648/j.mc.20180601.11
- Kirschvink N, Fiévez L, Dogné S, Bureau F, Art T, Lekeux P. Comparison of inulin with urea as dilutional markers of bronchoalveolar lavage in healthy and heaves-affected horses. Vet Res. 2001 Mar-Apr;32(2):145-54. doi: 10.1051/vetres:2001117. PMID: 11361150.
- Bokov DO, Karabeshkin DI, Samylina IA, Potanina OG, Krasnyuk II, Malinkin AD, Sergunova EV, Kovaleva TYu, Bobkova NV, Antsyshkina AM, Bondar AA, Evgrafov AA, Galiakhmetova EK, Moiseev DV, Bessonov VV. Pharmacopoeial analysis of inulin-containing medicinal plant raw materials and drugs. Pharmacognosy Journal. 2020;12(2):415-421. doi: 10.5530/pj.2020.12.64.
- Petkova NT, Vrancheva R, Mihaylova D, Ivanov I, Pavlov A, Denev P. Antioxidant activity and fructan content in root extracts from elecampane (Inula helenium L). J BioSci Biotechnol. 2015;4(1):101-107.
Content Alerts
SignUp to our
Content alerts.
 This work is licensed under a Creative Commons Attribution 4.0 International License.


