Environmental Sciences . 2022 December 30;3(12):1548-1561. doi: 10.37871/jbres1634.
The Environmental Circumstances of Cardiovascular Disasters in Saint Petersburg, Summer 2002
Olga Stupishina1*, Elena Golovina2, Sergei Noskov3,4, Gennady Eremin3 and Sergei Gorbanev3
2Meteorological Faculty of the Department of Meteorology, Climatology and Atmospheric Protection, Russian State Hydrometeorology University, Saint Petersburg, Russia
3North-West Public Health Research Center, Saint Petersburg, Russia
4North-West State Medical University named after I.I. Mechnikov, Saint Petersburg, Russia
- Space weather
- Terrestrial weather
- Solar activity phases
- Calendar seasons
- Human health
- Cardiac diseases
Abstract
The work proposed the results of the investigation of helio-geo-physical and meteorological factors variations those were matching the different cardio-events. Those events were recorded by 6 medical institutes (state establishments) of Saint Petersburg. The findings show the importance of the solar radiobursts impact, the daily spread of the geomagnetic field variations, the changing of the atmosphere pressure systems for the creation of the dangerous situation for the people with the cardiac disasters. Also alternative safe for such people environmental situation is shown.
Introduction
The investigations of the connections between a living organism and its environment have the long history enough from the times of Hippocrates, who noted about the importance of the nature circumstances for the human health, to nova days. In our times there are a lot of careful studies of the selected environmental factors which can impact the human organism as well as other living objects which are located on the Earth’ surface [1-10]. Most part of the mentioned authors show very informative results in narrow sectors of the environmental features those can be considered as factors of the nature impact on the living object, it means: geomagnetic impact [3,5,10], high temperature impact [6,7], cosmic rays which have disturbed the high levels of atmosphere so created an ionosphere-atmosphere impact [1,9], atmosphere electromagnetic field impact [2]. The mentioned works are shown here only as the examples of active works in the field of environmental-biosphere connections, in fact there are hundreds of very important results in this field. But most of authors are investigating only selected environmental features when nature is really complex. Some authors considered this complexity of our environment [4,8] so we too are interesting in the study of the complex environmental impact on the human organism.
The presented work is made for the continuation of our previous works those were intended to find out some reliable connections between status of a human organism and environmental parameters variations [11-20]. In fact, this work evaluates the previous study [14] with the new environmental data and the new data treating algorithm.
Materials and Methods
Input data
As in our previous works [13,14,19,20] the environmental data under study were divided by their belonging to two fields of environment: (1) Space Weather, (2) Terrestrial Weather. The term ‘Space Weather’ is well known for many years now and ‘concerned with the time varying conditions within the Solar System, including the solar wind, emphasizing the space surrounding the Earth, including conditions in the magnetosphere, ionosphere, thermosphere and exosphere’ [21,22]. The term ‘Terrestrial Weather’ is old enough and should not need the first word as the clarification if only we have decided to study only the terrestrial atmosphere variations-variations of the atmosphere electric field, variations of meteoparameters which are connected with atmosphere circulation processes (atmosphere pressure, nebulosity, wind velocity) as well as the pressure systems changing; variations of the air humidity, variations of the air temperature. As we can see from the list of fields those we have mentioned above, there are too many different environmental shells which surround us. So we think that the idea to specify the identity of the environmental characteristic to the certain weather type and its particular field may be suitable for the clarifying of the role of each environmental shell that consists of factors which can impact the living organism with the location on the Earth’ surface. In our work we have introduced the term ‘data block’ for the environmental parameters data those are belonging to particular fields of different weather types. We have included 10 data blocks-5 blocks of the environmental parameters which are characterizing the Space Weather conditions and 5 blocks of the Terrestrial Weather characteristics in the days under study. Those blocks are follows:
- Space weather: Global variations of Solar Activity (SA) parameters-daily indexes of SA (the full radio-flux on the wavelength of 10.7 cm, the sunspot number, the summarized spot area on the solar disk, the number of new Active Regions on the solar disk) [23].
- Space weather: Daily characteristics of the SA flare-component in the various bands of the electromagnetic spectrum (the number of optical flares, the same for X-ray flares, the same for radiobursts in different radio-bands and different types of bursts) [23].
- Space weather: Variations of Interplanetary Space characteristics in the Earth’ vicinity-the electron fluxes (with energy E > 0.2 MeV, E > 2 MeV), the proton fluxes (with energy E > 1 MeV, E > 10 MeV, E > 14 MeV, E > 30 MeV, E > 60 MeV, E > 100 MeV), the background X-ray fluxes (0.5-8 Å; 1-8 Å), the speed, density and the temperature of plasma in the solar wind, the longitude and latitude angles of the mentioned plasma fluxes, variations of the neutron flux (its deviation from the background) [23,24].
- Space weather: Variations of Geomagnetic Field (GMF) at the altitude of the geostationary orbit-full GMF vector, x- , y- , and z- components of this vector [24], k-indexes of GMF on various terrestrial latitudes [23], x- , y- , and z- components of GMF on Saint-Petersburg latitude [25].
- Space weather: The ionosphere disturbances [26].
- Terrestrial weather: Variations of Atmosphere Electric Field (AEF) (AEF intensity and the same for the unipolarity coefficient [own data of Russian State Hydrometeorological University].
- Terrestrial weather: Variations of meteoparameters which are connected with atmosphere circulation processes (atmosphere pressure, nebulosity, wind velocity) [27].
- Terrestrial weather: Variations of air humidity values-the relation humidity, the dew point temperature; the deficit of the dew point temperature [27].
- Terrestrial weather: Variations of air temperature [27].
- Terrestrial weather: Variations of the oxygen weight-content in the air [the calculated value].
Also we have investigated the atmosphere circulation characteristic [28] and own data of Russian State Hydrometeorological University.
For each environmental parameter’s row, we have calculated the daily statistics – mean, median, maximum, minimum, range, standard deviation, coefficients of oscillation and variation. Each daily statistic of each environmental parameter we investigated as the self-contained parameter because in this work we suppose the obscurity of some parameter characteristic priority (e.g. maximum daily parameter value vs daily range).
To compare with our previous work [14] we have expanded the number of corpuscular fluxes in Earth’s Vicinity, have included more types of solar radiobursts, have included GMF variation at the geostationary orbit altitude, have included sudden ionosphere disturbances and atmosphere circulation characteristics.
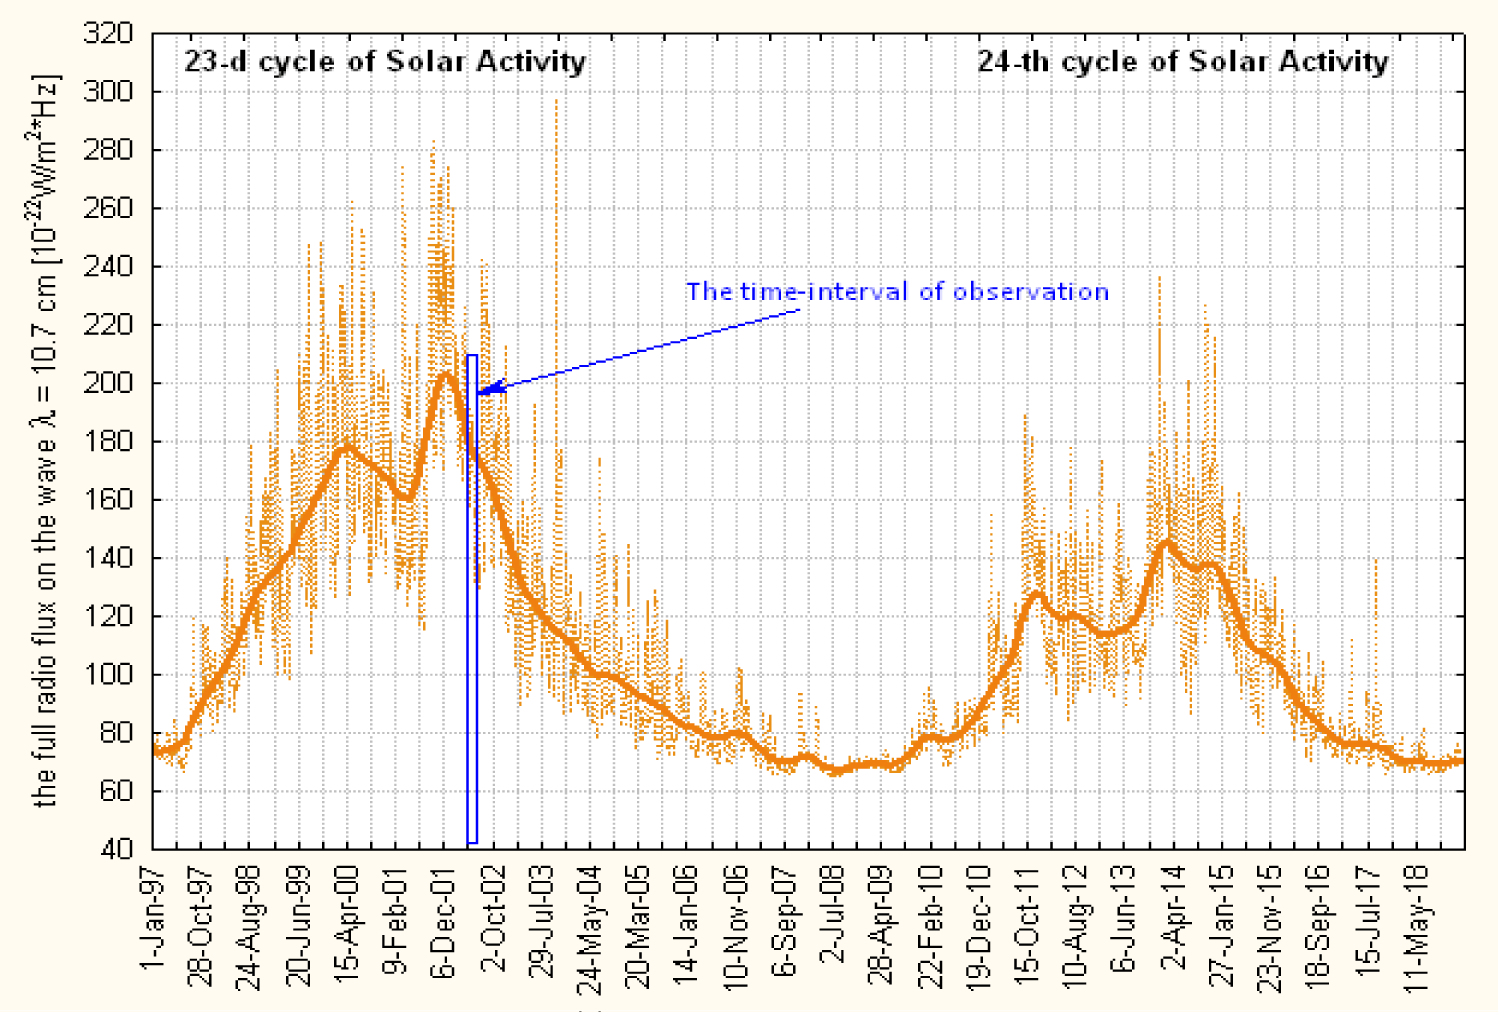
The medical data are the same as in the previous work [14] and these data are very specific. Usually, when we have worked with data of particular clinics [11-13], we often doubted that these data were the representative selection from the general population sample of our city (Saint Petersburg, Russia, the population size for 2002 year is 4,661,000 people), so all effects that we have found out may be local, specific for the certain clinic but not for the whole territory with investigated environmental variations. In summer 2002 it was the unique case when 6 medical institutes invited us to study the environmental problems (as it was assumed) with the cardiac catastrophes. Also we may note that this time-interval is interesting in itself: too close to the maximum of the twenty-third solar activity cycle but at the very beginning of its fall branch it means that we may catch the effects of active Sun when the interplanetary effects began to rise (include the Earth’s shells reaction on the income of the galactic cosmic rays those are more prominent at the solar activity cycle fall branch) as well as geomagnetic effects. So when we have gotten the data from different health care institutions we tried to compare them for the purpose to mark out the veracious situation in the human population in the certain time interval. For this purpose, we have investigated 6 medical sources for the same time interval the summer 2002 (1.06.2002-30.08.2002), the beginning of the 23rd solar cycle fall branch (Figure 1).
The medical sources were follows: (1) Sudden Cardiac Deaths (SCD) on Saint-Petersburg streets with the post mortal diagnosis ‘Ischemia’ (1044 cases: 730 men, 314 women), (2) SCD on Saint-Petersburg streets with the post-mortal diagnosis ‘Insults’ (88 cases: 50 men, 38 women), (3) SCD in the Research Institute of Emergency Medicine (RIEM) (19 cases: 10 men, 9 women), (4) city Emergency Service (ES) call-logs with records of the ‘lethal outcome’ (2474 cases, without dividing by gender attribute), (5) suburb (Sestroretsk town) ES call-logs with records of ‘lethal outcome’ (39 cases, without dividing by gender attribute), (6) local city area (Department Petrogradskii) ES call-logs with records of ‘lethal outcome’ (168 cases, without dividing by gender attribute).
Here we must explain the choice of the SCD for the investigation. SCD is the most problematic case among all cardiac catastrophes because it is unexpected and often inexplicable. 'Sudden Cardiac Death (SCD) is an unexpected death due to cardiac causes that occur in a short time period (generally within 1 hour of symptom onset) in a person with known or unknown cardiac disease. It is estimated that more than 7 million lives per year are lost to SCD worldwide, including over 300,000 in the United States’ [29]. From this description, we can see that often SCD can occur just on a street, outdoors, because of its suddenness and unpredictability. Such cases are registered in the forensic medical examination logs. There are different post-mortal diagnoses, not heart attacks. ‘In contrast to a heart attack, sudden cardiac arrest occurs when the electrical system of the heart malfunctions and suddenly becomes very irregular. The heart beats dangerously fast. The ventricles may flutter or quiver (ventricular fibrillation), and blood is not delivered to the body. In the first few minutes, the greatest concern is that blood flow to the brain will be reduced so drastically that a person will lose consciousness' [30]. From this description, we can learn about the malfunction of the electrical system in the heart, and by the opinion of physicians, some ambient impact can be guilty of such disruption. Also, let’s note the reduction of the blood flow to the brain. All of the above leads to a preferential quantity of Ischemia and Insults between all post-mortal diagnoses in the forensic medical logs. This fact allowed to highlight the cases with mentioned post-mortal diagnoses for our investigation between all outdoor SCD as well as SCD in RIEM and at home (the last was registered by ES call logs as a ‘lethal outcome’). The medical data from each source were treated by the calculation of the SCD number per day. We have built the season (summer, 2002) distribution of these daily numbers and were interested in the days with maximal, and minimal critical points in these distributions and also in the days when the daily number of the above were in the frames of the upper quartile of the season distributions as well as in frames of the median deviation.
After the meticulous investigation of each medical sample, we have extracted a few veracious dates when mentioned above statistics were registered concurrently in all samples from our 6 medical sources (including the samples of the different genders). We think that such cases describe the situation on the whole territory with investigated environmental variations more truthfully than the data from only one clinic. The selected dates were presenting the following categories from the medical view:
- The worst days (named ‘bad’ in this work) of maximal daily numbers of SCD in all samples concurrently (if some sample had not maximum in the certain date – it had at least the number of SCD from the upper quartile of its season distribution).
- The days with usual number (in frame of the median deviation) of SCD-season-distribution (named ‘norm’ in this work) in all medical samples.
- The safe days with absence SCD or minimal SCD from the distribution of the whole investigated summer in any sample (named ‘good’ in this work).
The resulting selection is not large but we are quite sure about its quality: 7 days ‘bad’, 4 days ‘norm’, and 4 days ‘good’. Other days in summer, 2002 were specific for some clinics under our study but not for all 6 medical sources.
The mentioned descriptive daily statistics are shown in the table 1.
| Table 1: Descriptive statistics of cardiac events in St. Petersburg, summer 2002. | |||
| Medical Data Samples | Maximum Number of Daily Cases | Upper Quartile Number of Daily Cases | Median Number of Daily Cases |
| SCD-Ischemia (city street cases) | 13 | 9-10 | 5 |
| SCD-Insults (city street cases) | 2 | 1 | 0 |
| SCD-RIEM | 2 | 1 | 0 |
| Lethal outcome (city ES call-logs) | 45 | 29-30 | 27 |
| Lethal outcome (suburb ES call-logs) | 4 | 2 | 1 |
| Lethal outcome (local region ES call-logs) | 6 | 3 | 2 |
From this table we can learn that only the combined and comparing data from different medical sources can show us the reliable situation in the city population for small samples (patients in RIEM) or very rare cases (SCD-insults) even 2 cases per day means maximum of a season. Only when the same worth situation is registered in big samples too we can be sure about the real ‘bad’ day.
The treating method
The data treating method we have carefully described in [19]. Here we should say only about the key points of it:
Each environmental parameter that was included to the investigation was standardized on its season median by the follow operation:
where x is the certain value of the certain parameter that was measured in its own units, is the parameter’s value median that was calculated from the sample of calendar season size, is the standard deviation of this parameter’s value in this sample.
The benefit of this procedure we described in [19] and we only should repeat it here. The procedure allows:
To present the daily collection of various environmental parameters as a single holistic sample. It means that the set of heterogeneous parameters translated into the sample of members of the identical conventional units. These units describe the deviation of each parameter from its seasonal distribution center. The previous heterogeneous collection immediately turns into a sample set for which descriptive statistics can be calculated, therefore, it is possible to characterize the whole complex by, for example, its mathematical expectation and variance.
To assess the degree of deviation of the entire complex of weather parameters from its norm for a given calendar season – the proximity of the median of such a sample to zero means the proximity of the entire weather parameters complex to its seasonal norm.
To compare the different weather parameters complexes corresponding to the days of different medical events (the realization of situation ‘bad’, ‘norm’ or ‘good’) by their descriptive statistical characteristics. In the case of differences in the characteristics of weather complexes, we can talk about the difference in the conditions in which different medical events are formed. Actually the searching for such conditions that is the main task of the entire study.
The conjunction between the environmental parameters variation and exact medical category (‘bad’- ‘norm’- ‘good’) we have done by the follow procedure: the day of the registration of each medical category was described by the holistic environmental parameters set (weather parameters complex) for the observation day.
For the dynamic investigation of the process we study the time-interval of folder epochs of +/-5 days around the day of the medical event (the realization of situation ‘bad’, ‘norm’ or ‘good’) - key-day. For each day from this interval we have collected the environmental parameters for the mentioned above weather complex.
The investigation is ongoing for pairs (1) ‘bad’ - ‘norm’, (2) ‘bad’ - ‘good’, (3) ‘norm’ - ‘good’. In such pairwise comparing the individual environmental features of every medical category is more distinct than when comparing three categories together.
For each pair each environmental parameter is checked for difference when belongs to the different medical events (is registered in the exact medical event days). The checking method is the nonparametric Mann-Whitney method of the hypothesis investigation with the 0-hypothesis of the distribution similarity. The sample for the distribution consists from the observations in number of certain medical-event days. The environmental parameters those are not different when corresponds to different medical events are excluded from the further investigation. The remained environmental parameters constitute the purified sets for the next analysis steps.
We investigated parameters sets firstly in the time interval from (- 5)-day to ‘key-day’ and try to detect the day of maximal differences between the weather parameters complexes those were corresponded to the days with different medical category. The reason of this maximal-difference-day pursuit is the looking for the reliable base for the forecast of the risk situation for the human health. Secondly we search such maximal-difference-day in the whole folder epoch interval it should show us the location of the investigated medical event on the weather-changing line.
The parameters sets are very similar to cluster sets from the mathematical apparatus of Cluster Analysis. This fact allows us to use some method from this analysis exactly the determination of distance between clusters to lay down the maximal distance and point the day when it is occurred. We use the Euclid’s distance between clusters in this work:
where and are the environmental parameters clusters those are corresponding to different medical events (e.g. ‘bad’ or ‘norm’); xi and yi are the median (from the sample of days when the certain medical event was observed) values (standardized values) of each parameter that belongs to the exact environmental set; n is the total number of parameters in the set.
We calculate the guide cosine of each parameter (the member of the weather complex cluster):
Using the whole sample of observation days for each medical category we calculate the projection of each observed parameter’s value on the between-cluster line by their guide cosines. The mathematical apparatus is described in [19].
We investigate the distributions of mentioned above projections on the between-cluster line and define in the epoch folder interval the day with the longest and plausible distance between weather complexes of different medical events belonging. The plausible of the correct distance we define by the nonparametric Mann-Whitney method of the hypothesis investigation with the 0-hypothesis of the distribution similarity.
If the Mann-Whitney method result is not enough for the maximal distance definition – it may be in case of similar significant levels of this method for few days in the investigated folder epoch interval – we make additional calculation of the distance between projection clusters by taking into account their intrinsic variation: the Euclid’s distance minus the sum of standard deviations of each projection-clusters.
At the end we have
The correct value of the distance between environmental parameters sets, so we have one day or two days of the maximal difference between weather complexes – the first day is before the medical events, the second day may occur after the medical events in case if they are lying not at the end of the weather-changing line. So we have the point for the forecast (first maximal-difference day) and the understanding of the global environmental process way (the maximal-difference day in the whole folder epoch interval).
The rating of environmental parameters under investigation by their guide cosines and Mann-Whitney significance levels. The last allows us to select important parameters which guide cosines are maximal and the significant Mann-Whiney levels of their distributions similarity is minimal – it means they are really different when match different medical events so may be responsible for the environmental circumstance of these medical events. For such environmental parameters we may examine their behavior in the folder epoch interval that help us to visualize the nature processes.
Results
All described below results show only effects of those environmental parameters which are different (by Mann-Whitney criteria) when corresponds to different medical events and constitute the purified sets for the next analysis steps as it was specified in the paragraph of the treating method. We can consider such environmental parameters responsible for the formation of conditions for the different medical events.
And firstly we may note the absence of sudden ionosphere disturbances data block in the results. It means that this parameter was not different when was registered in days of different medical events in any point of the folder epoch time-interval and in any comparing pair.
The results that were obtained with the purified environmental parameters sets:
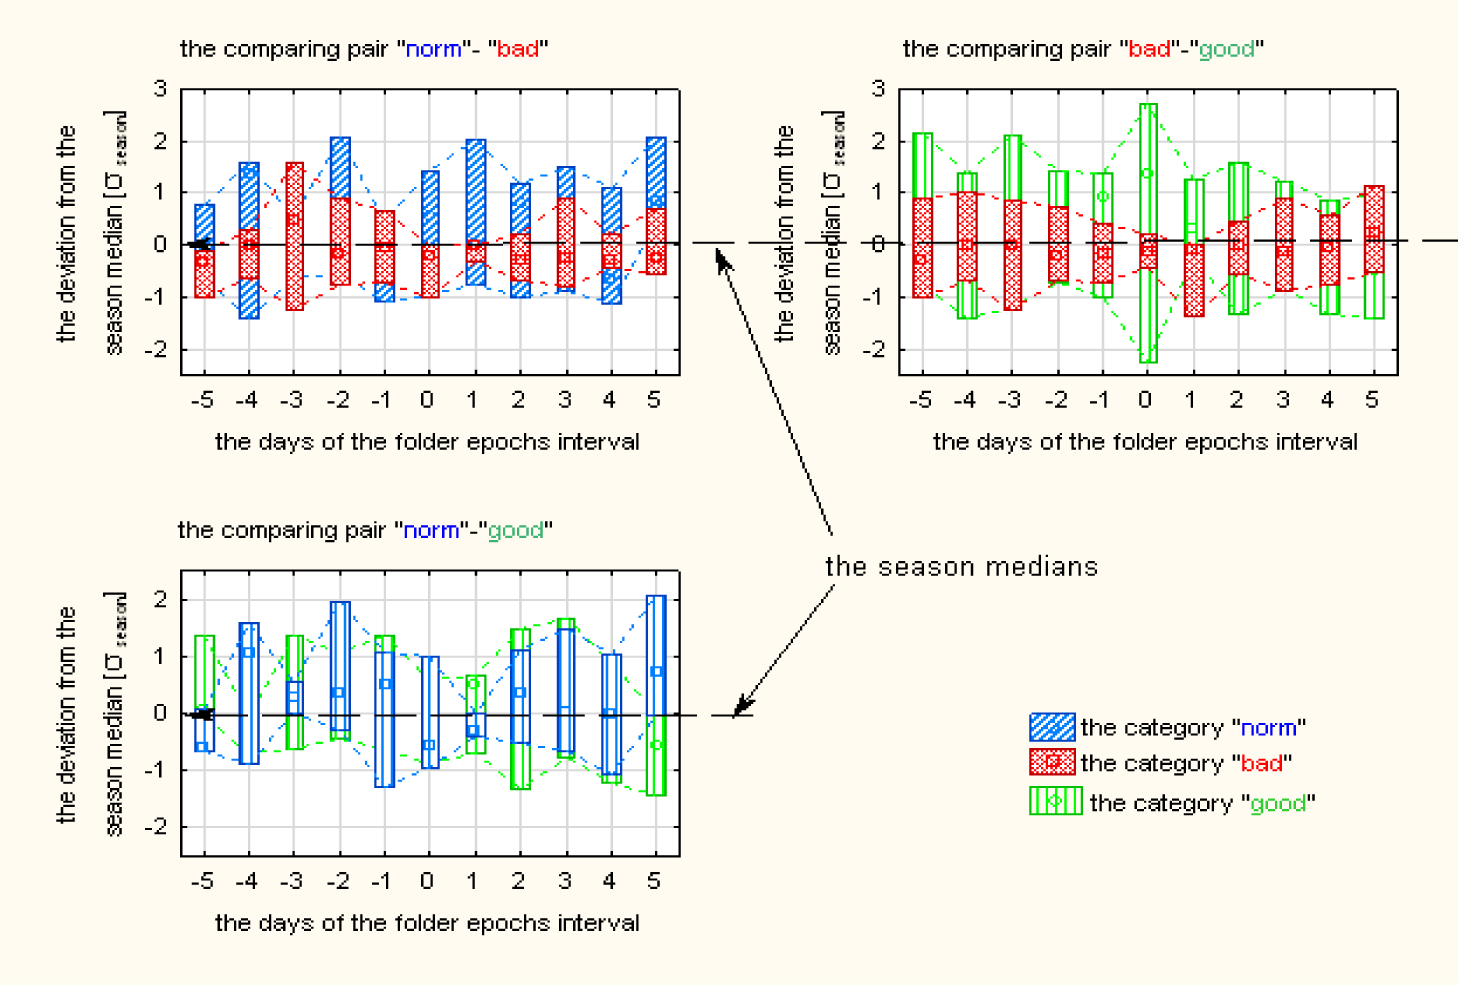
Weather complexes are quite different when match different medical events: the ‘bad’ medical events occur mainly near the ‘norm’ season weather, ‘good’ and ‘norm’ medical events occur with more variable weather situation but their variations are in the frame of +/- 2.8 standard deviations (Figure 2).
This result looks unexpected at first glance – usually we think about some serious violations that can affect a living organism from nature. But we have gotten the same result when have inspected the environmental circumstances of SCD-ischemia on the city streets only, in the time intervals 1.12.2001-28.02.2003 and 1.12.2005-28.02.2007 (13038 cases, 8057 men, 4981 women [13]). We can assume 3 hypotheses:
- The long period of the very calm weather is worse than its mild arousal. Note, that we see really mild deviation of the weather parameters complex from the season norm not more than 3 season standard deviation near the days of ‘norm’ and ‘good’ medical categories.
- On the background of the calm weather any even small deviation from it may be dangerous. The same result we saw when have investigated the environmental circumstances of the deterioration of the condition of patients of the rehabilitation cardiological sanatorium in October, 1995 (65 cases, 35 men, 30 women [11]).
- The behaviour of some environmental parameters may be very specific around the ‘bad’-days, for example the small but stable spread (for example, oscillations) can occur in the days of the folder epoch interval.
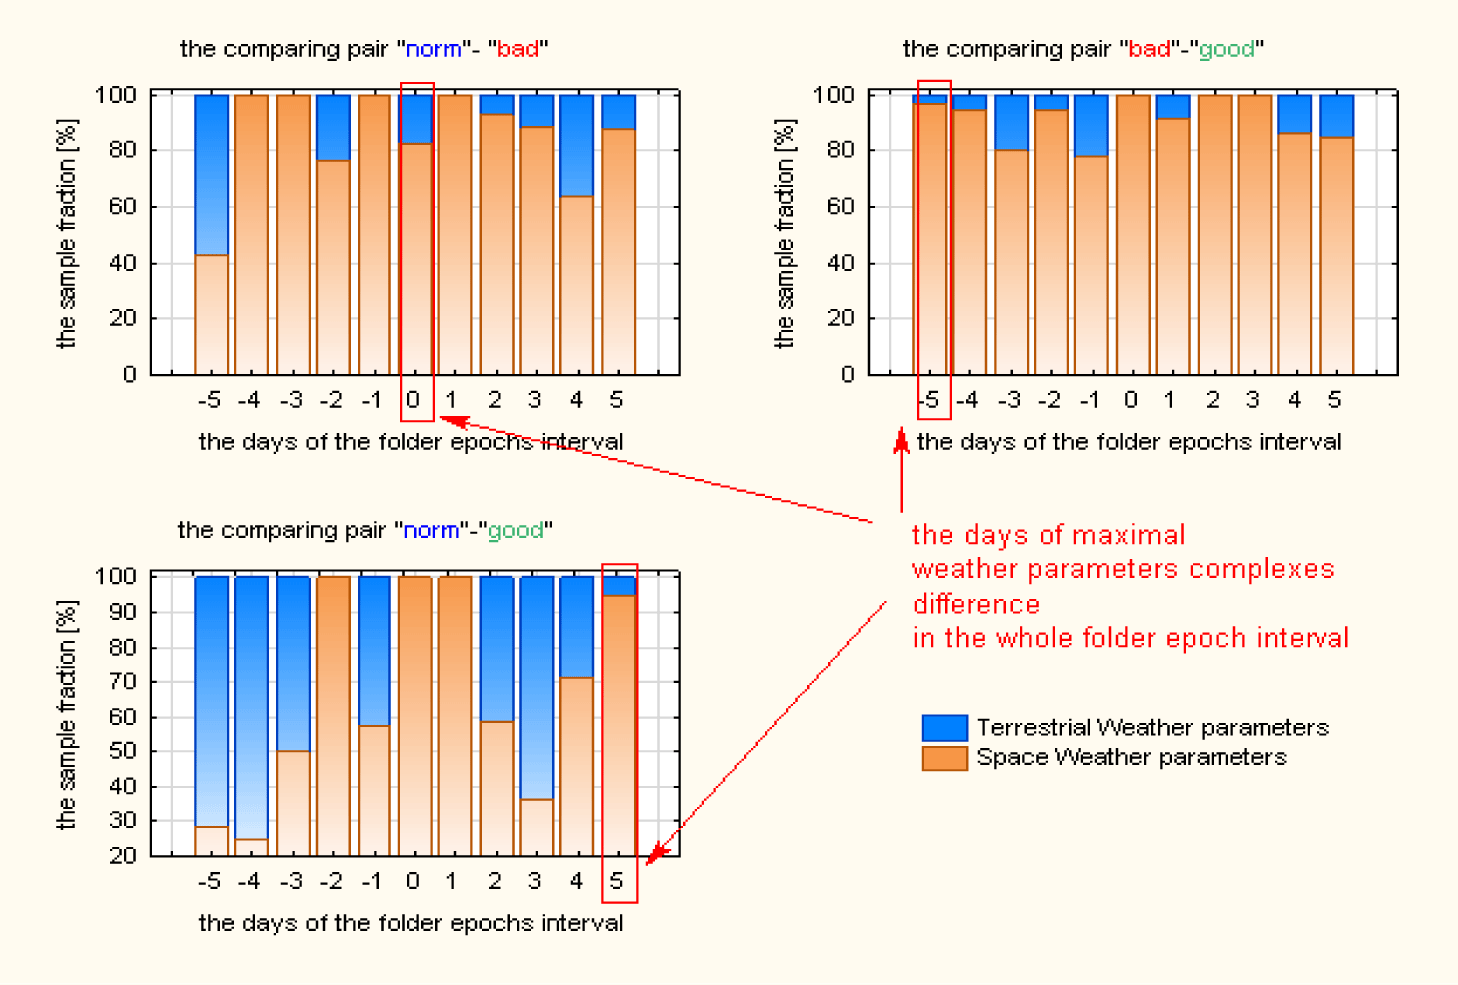
The days of maximal difference between the weather parameters complexes are different in different pairs of comparing:
- In the comparing pair ‘norm’- ‘bad’ the weather complexes are most different exactly in the key-day. Before this day the most difference between environmental parameters was in (-3)-day.
- In the comparing pair ‘bad’- ‘good’ the most weather complexes difference was in (-5)-day.
- In the comparing pair ‘norm’ - ‘good’ the most difference occurs in (+5)-day. Before the key-day the most difference was registered in (-1)-day for the weather complexes of this pair.
This result shows the forecast possibility of the investigating of weather characteristics in (-5)-day and (-3)-day in relation to the ‘bad’ events. Also it shows that the ‘good’ events are lying on the weather-changing line far from the end of this changing.
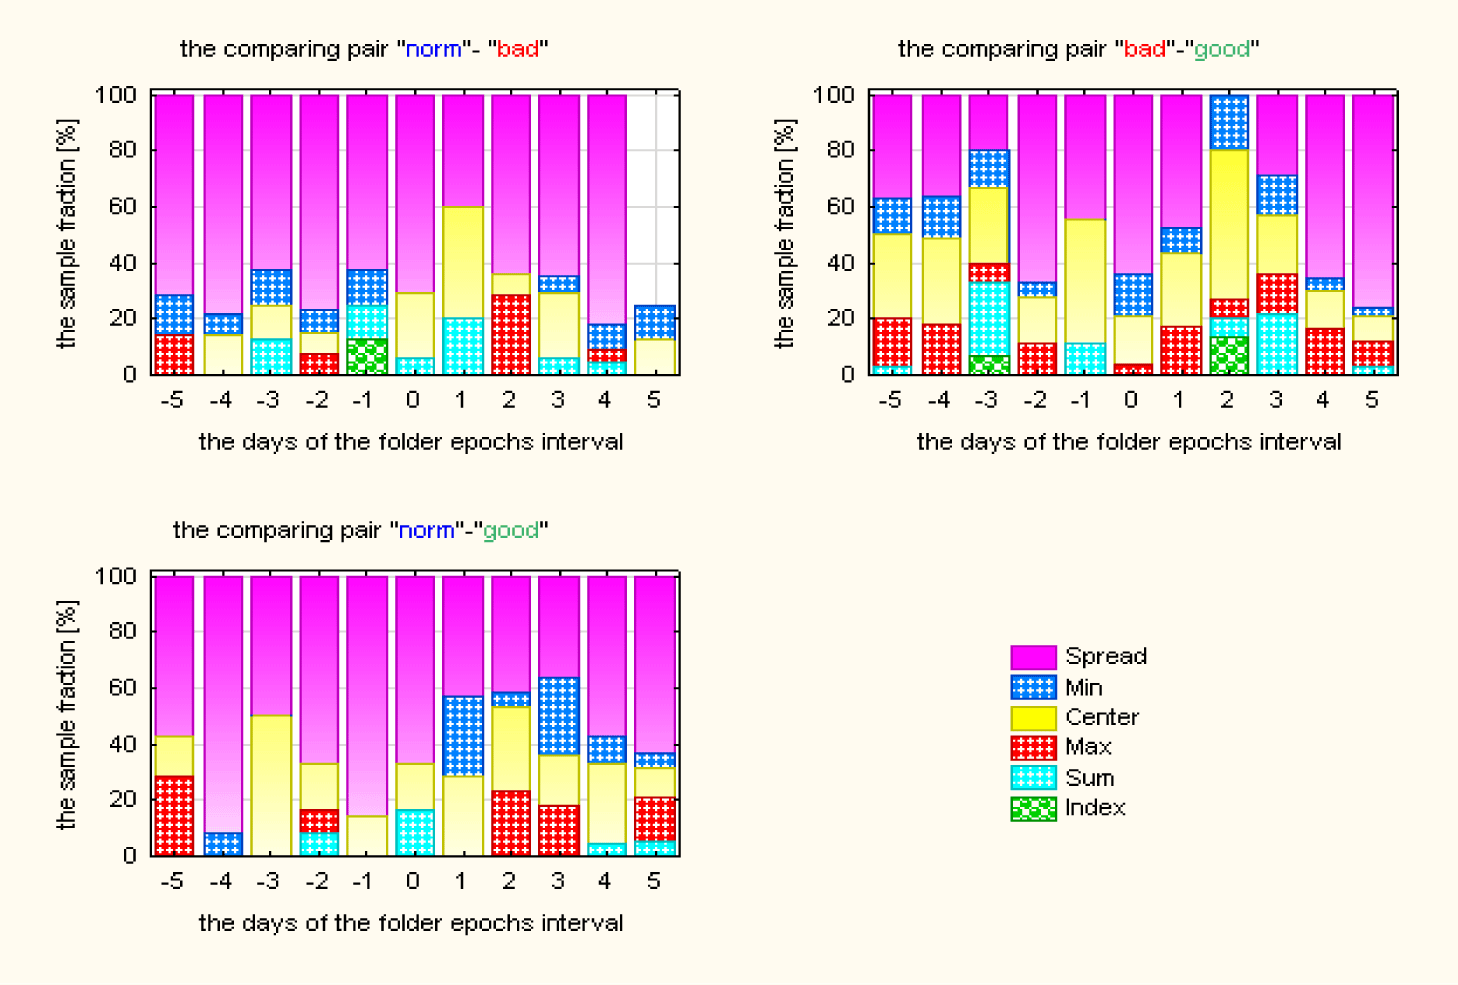
The investigation of the weather type in mention days as well as in days of the whole folder epoch interval shows the dominance of Space Weather parameters that differ when belong to ‘bad’ category of days in relation to ‘norm’ and ‘good’ days. In the pair ‘norm’ - ‘good’ the Terrestrial Weather parameters play significant role (Figure 3).
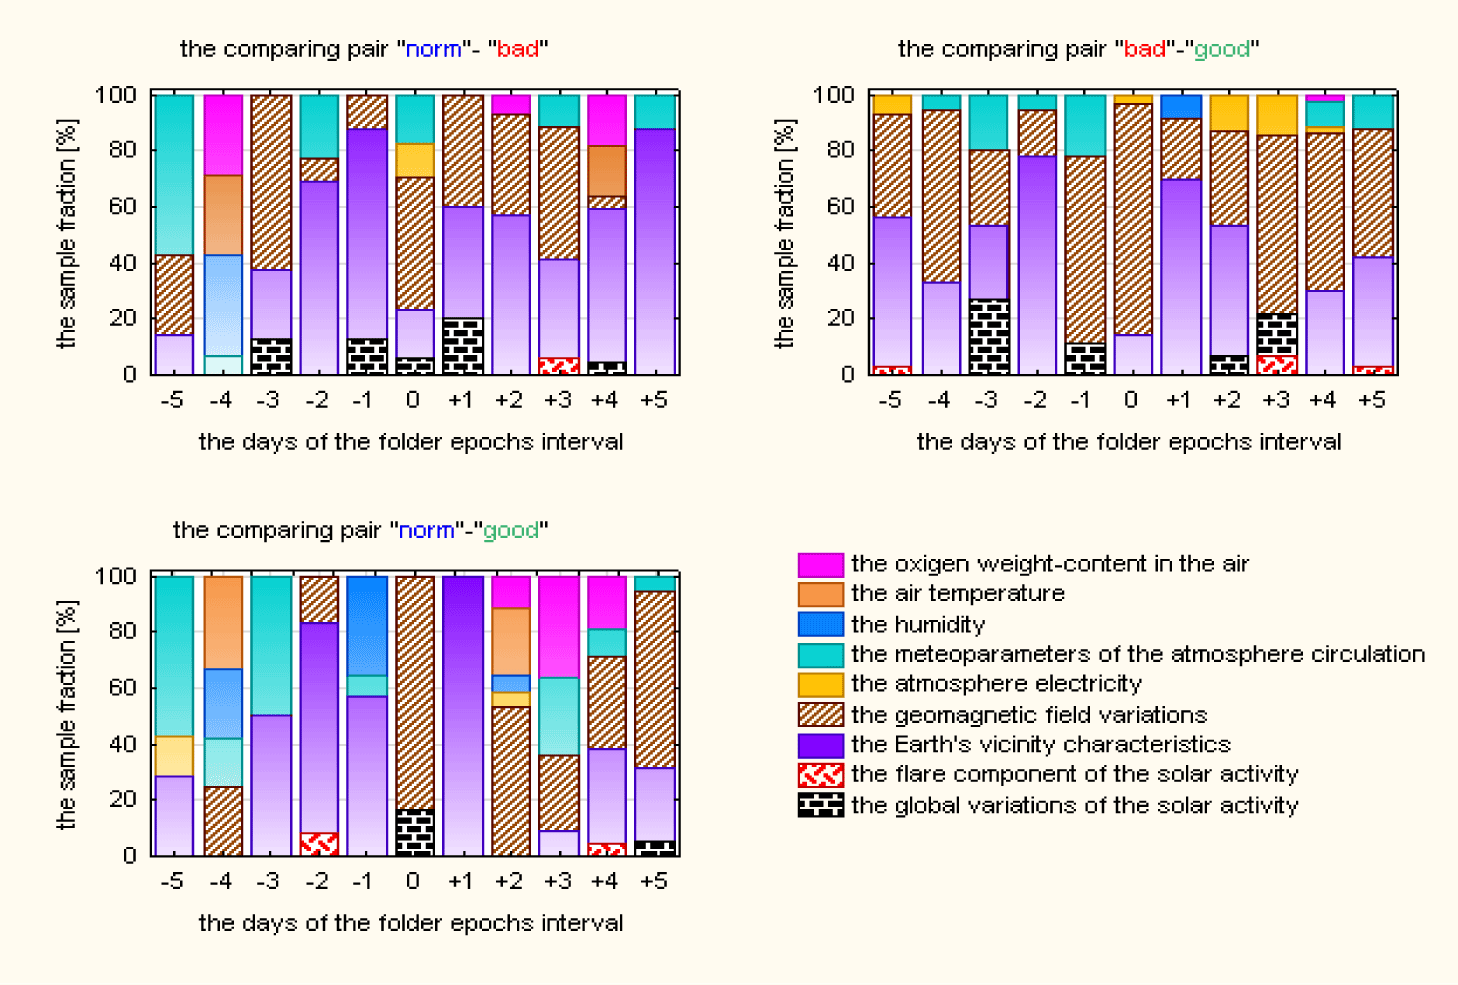
The detailed investigation of the weather parameters complexes shows the dominance of geomagnetic and Earth’s vicinity parameters those differ in any comparing pair when corresponded to different medical events (Figure 4). Also on the figure 4 we can see the absence of the ionosphere parameters (we have studied sudden ionosphere disturbances as it was specified in the paragraph of input data). It means that those parameters are not different when corresponds to different medical events in any point of the folder epoch interval and in any comparing pair.
The investigation of the daily statistics of discovered environmental parameters shows the dominance of the daily spread of them as the significant factor for the difference between the investigated medical categories (Figure 5).
The most different parameters (they have the maximal guide cosines and the minimal Mann-Whitney significant level in according to the described method) in the first half of the folder epochs time-interval were (Table 2).
| Table 2: Environmental parameters those had the most difference when correspond to different medical categories in the day of maximal weather complexes difference in the half folder epoch interval-from (-5)-day to the key-day (are useful for the forecast purpose). | ||
| The Comparing Pare | The Day of the Maximal Weather Parameters Complexes Difference | The Parameter |
| ‘bad’ - ‘norm’ | -3 | The daily sum of the solar radio bursts with energy (10-100) 10-22W/m2*Hz |
| ‘bad’ - ‘norm’ | -3 | Coefficient of variation of the full GMF vector at the altitude of the geostationary orbit |
| ‘bad’ - ‘good’ | -5 | The daily minimal solar wind plasma speed |
| ‘bad’ - ‘good’ | -5 | The daily variation of the atmosphere electric field strength |
| ‘norma’ - ‘good’ | -1 | The daily median of the relative humidity |
| ‘norma’ - ‘good’ | -1 | The daily range of the relative humidity |
| ‘norma’ - ‘good’ | -1 | The daily coefficient of variation of the relative humidity |
| ‘norma’ - ‘good’ | -1 | The daily coefficient of oscillation of the relative humidity |
The most different parameters (they have the maximal guide cosines and the minimal Mann-Whitney significant level in according to the described method) in the whole folder epochs time-interval were (Table 3).
| Table 3: Environmental parameters those had the most difference when correspond to different medical categories in the day of maximal weather complexes difference in the whole folder epoch interval (it shows the leader-parameters location on the weather-changing line). | ||
| The Comparing Pare | The Day of the Maximal Weather Parameters Complexes Difference | The Parameter |
| ‘bad’ - ‘norm’ | 0 | The daily range of the GMF y-component at the altitude of the geostationary orbit |
| ‘bad’ - ‘norm’ | 0 | The daily coefficient of variation of the atmosphere wind speed |
| ‘bad’ - ‘good’ | -5 | The daily minimal solar wind plasma speed |
| ‘bad’ - ‘good’ | -5 | The daily variation of the atmosphere electric field strength |
| ‘norma’ - ‘good’ | +5 | The daily range of the GMF y-component at the altitude of the geostationary orbit |
| ‘norma’ - ‘good’ | +5 | The daily coefficient of variation of the GMF y-component at the altitude of the geostationary orbit |
| ‘norma’ - ‘good’ | +5 | The daily coefficient of oscillation of the GMF y-component at the altitude of the geostationary orbit |
| ‘norma’ - ‘good’ | +5 | The daily median of the atmosphere wind speed |
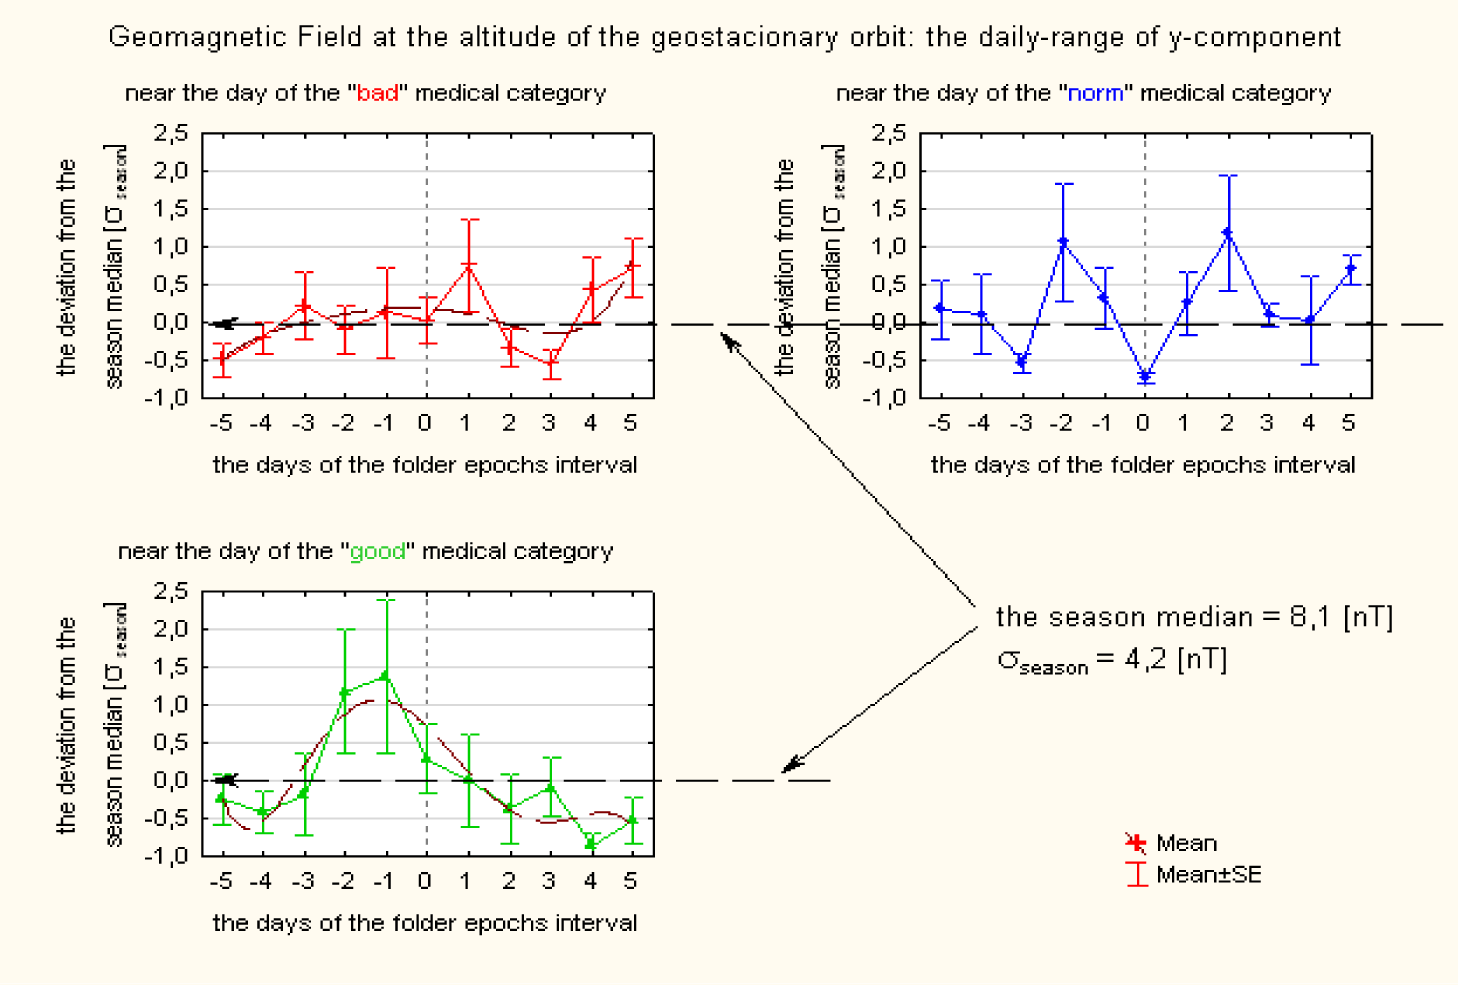
From the tables above we can see that the daily spread (range, coefficients of variation and oscillation) of y-component-GMF at the altitude of the geostationary orbit often repeated as the important environmental parameter in different comparing pairs. So it seems interesting to consider the behavior of it in the time interval of folder epochs (Figure 6).
The figure 6 shows a good confirmation of our above described assumptions (result 1).
- The ‘bad’ days are on the calm GMF-disturbances line – the daily-range is near the season median (Figure 6 shows only one GMF-component, but other components, those are not shown here, have the same behaviour). But just after the ‘bad’ days the asymmetric (the most changing is in the daily-range y- component that is longitudinal) GMF disturbances began. (The approximation line emphasizes the calm level). As we have assumed there is the deviation of the parameter’s level from the calm background.
- As we assumed, the disturbance is expressed as an increase of spread, it means the daily-range.
- The ‘good’ days are on the smooth slope of mentioned above asymmetric GMF-disturbances. Also we can see that ‘good’ days lie far enough from the end of this parameter’s changing line.
- The ‘norm’ days are on the variable line of the considered parameter some ‘middle-behaviour’ of it between the situations of ‘bad’ and ‘good’ days.
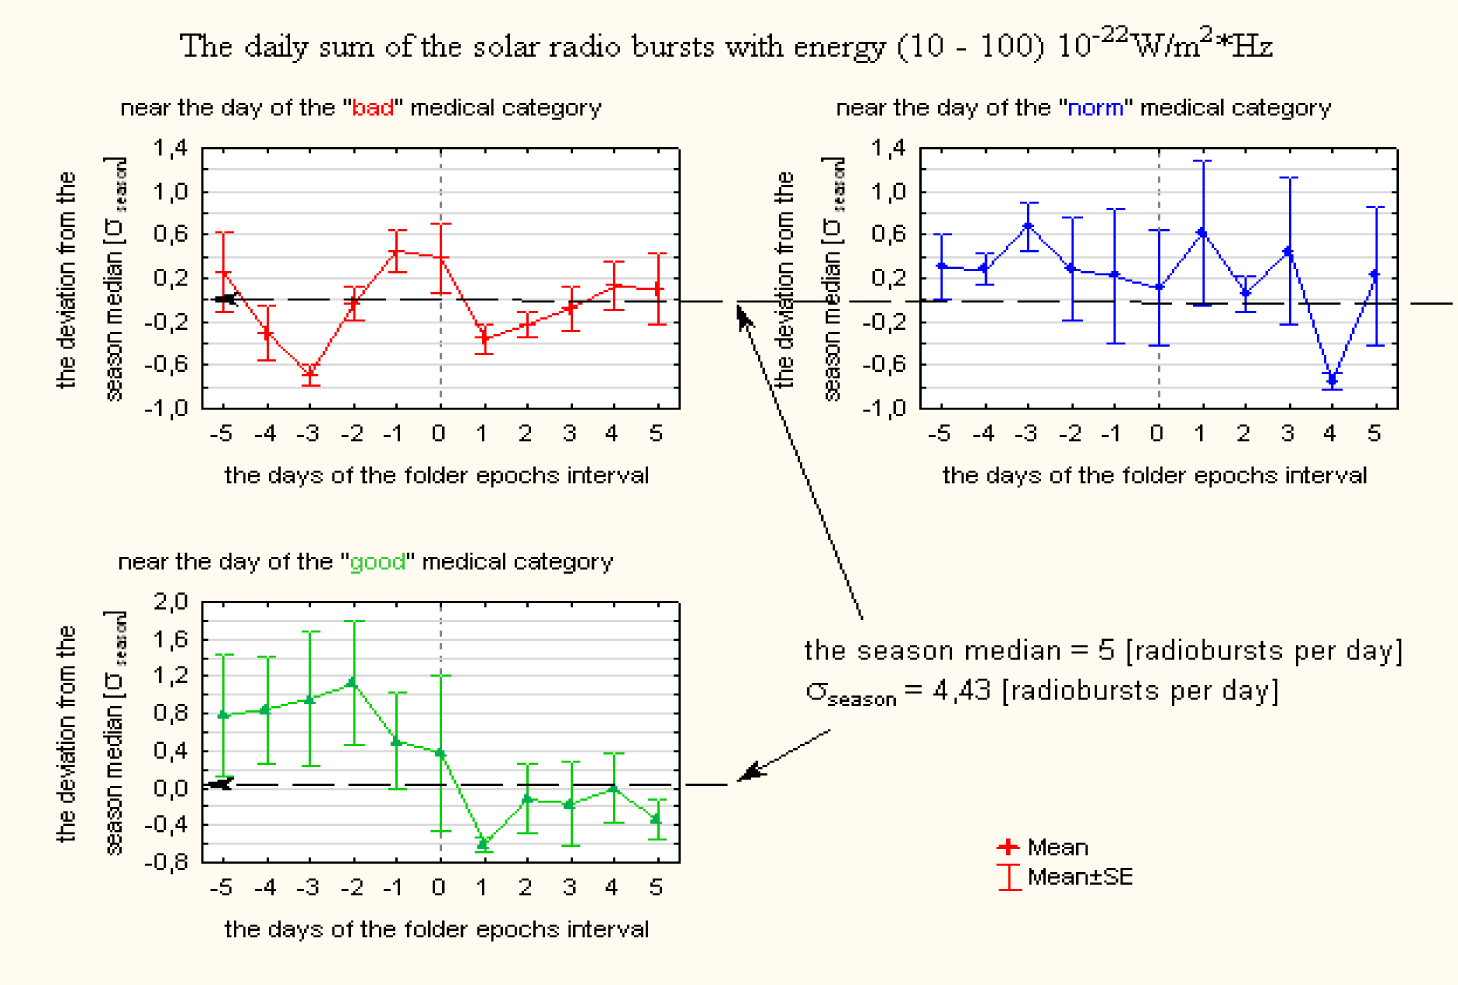
The increase in the level of GMF-disturbances in case of ‘bad’ days requests the explanation. And we have it from the investigation of the environmental parameters list in the day of maximum difference of weather complexes before the key-day (Table 2). We see there the daily sum of the solar radio bursts with energy (10-100) 10- 22W/m2*Hz. It is very significant: firstly, we see there the solar activity manifestation, secondly, as we know, the solar radio can penetrate into the terrestrial atmosphere trough the so named ‘radio window’. So for the reason to understand the effect we want to consider the behavior of this parameter (Figure 7).
The behavior of the investigated parameter explains us the situation. We can see that in 5 days before the ‘bad’ days (that is (-5)-day-the day of the maximal difference between weather complexes of ‘bad’ and ‘good’ medical events) the clear fall of this parameter began. Than in (-3)-day (the day of the maximal difference between weather complexes of ‘bad’ and ‘norm’ medical events in the half folder epoch time interval) there is the turn of the behaviour line of this parameter to the increasing. The peak is quiet close to the key-day. The increasing of the GMF spread may be caused by this impact.
Only one terrestrial parameter repeated as important in different comparing pairs in the day of maximal weather complexes difference in the whole folder epoch time interval. That is the wind speed in the comparing pair ‘bad’ - ‘norm’ again the daily spread of this parameter was important, in the pair ‘norm’- ‘good’ the daily median value was important. For the purpose to understand the reason of this parameters manifestation we have investigated the atmosphere circulation in the days of the medical events. It was discovered that all days of ‘bad’ events or ‘good’ events were the days of the atmosphere pressure systems changing but not all days of ‘norm’. Also we can note that often there was the changing to or from the high pressure flat field and it was in all ‘bad’ days (Table 4).
| Table 4: The atmosphere pressure system changing on the days of different medical events. | ||
| Date | The Medical Category | Pressure System Changing |
| 3-Jun-2002 | ‘bad’ | crest-high pressure flat field |
| 4-Jun-2002 | ‘bad’ | high pressure flat field- crest |
| 7-Jun-2002 | ‘bad’ | high pressure flat field- anticyclone |
| 11-Jun-2002 | ‘bad’ | crest-high pressure flat field |
| 4-Jul-2002 | ‘bad’ | high pressure flat field-cyclone |
| 13-Jul-2002 | ‘bad’ | raddle- high pressure flat field |
| 19-Jul-2002 | ‘bad’ | anticyclone- high pressure flat field |
| 25-Jun-2002 | ‘good’ | trough-crest |
| 10-Jun-2002 | ‘good’ | cyclone- high pressure flat field |
| 20-Aug-2002 | ‘good’ | high pressure flat field-trough |
| 21-Aug-2002 | ‘good’ | trough-crest |
| 10-Jun-2002 | ‘norm’ | anticyclone-crest |
| 14-Jun-2002 | ‘norm’ | |
| 21-Jul-2002 | ‘norm’ | |
| 17-Aug-2002 | ‘norm’ | high pressure flat field-anticyclone |
Discussion
We have results of very local investigation local territory, local season and local phase of the solar activity, and the few veracious dates for investigated territory. But the large number of input medical data those allowed us to select the veracious dates of the clear situation in the city of great general population sample give us hopes in the reliability of these results. At least for the certain season, certain phase of the solar activity and for our territory.
These results show us the difference of environmental circumstances of dangerous and safe days for the people with the cardiac disease also as the difference of such days’ environmental situation from the situation in usual-normal days. We have discovered that the proximity to weather norm does not mean a calm situation in the sense of cardio disasters. Contrariwise, in case of the long (at least 5 days) calm weather we must carefully monitor each-even small deviation from its level, especially it is true for the daily spread of environmental characteristics.
Our observation was not so far from the maximum of 23rd solar activity cycle. May be it is the reason of the solar activity (flare component) manifestation importance. In [19] we have investigated the ischemia cases in one local department of Saint Petersburg (15120 cases) but in the phase of solar activity minimum and have not discovered so clear manifestation of solar flare parameters. For its part the significance of the geomagnetic parameters variations is discovered in both studies despite of the solar activity cycle phase. So we may say about the importance of GMF-parameters monitoring which must track the GMF-variations (including the symmetry breaking) on the border of GMF at high altitudes, not only on the Earth’s surface.
We quite understand that the few discovered important environmental parameters are only the markers of the holistic environmental processes. So the obvious next task is the tracking of a sequence of physical processes which leads to the manifestation of found parameters. The character of the found parameters behavior (for example smooth slope of GMF spread near ‘good’ days vs. increasing or jumping of this parameter) shows us the way to the next steps.
Now we have registered that the worst cardiac situation in frames of observation conditions was observed when combined with the solar radio bursts impact, the asymmetric geomagnetic disturbance, and the atmosphere systems changing (from or to the high-pressure flat field). The best cardiac situation was registered on the smooth slope of geomagnetic variations, on the smooth slope of solar radio bursts number, but with the atmosphere systems changing too (not only with the participation of the high-pressure flat field). For the “norm” situation part, it occurs in quite regular GMF variations without a clear trend line (not a long increase or decrease) and not always at the atmosphere pressure system changing.
The found days of the maximal weather parameters complexes difference in the first part of the folder epoch interval when these complexes belong to different medical events give hope for the forecast of dangerous and safe environmental situations.
References
- Ferrari F, Szuszkiewicz E. Cosmic rays: a review for astrobiologists. Astrobiology. 2009 May;9(4):413-36. doi: 10.1089/ast.2007.0205. PMID: 19519216.
- Cifra M, Apollonio F, Liberti M, García-Sánchez T, Mir LM. Possible molecular and cellular mechanisms at the basis of atmospheric electromagnetic field bioeffects. Int J Biometeorol. 2021 Jan;65(1):59-67. doi: 10.1007/s00484-020-01885-1. Epub 2020 Apr 25. PMID: 32335726; PMCID: PMC7782448.
- Belisheva NK, Martynova AA, Pryanichnikov SV, Solov’evskaya NL, Zavadskaya TS, Megorsky VV. Connection of the parameters of the interplanetary magnetic field and the solar wind in the polar Cusp Region with the psychophysiological state of the Inhabitants of Arch. Spitsbergen. Herald of the KSC RAS. 2018;4:5-24. doi: 10.25702/KSC.2307-5228.2018.10.4.5-24.
- Khabarova OV, Dimitrova S. Some proves of integrated influence of geomagnetic activity and weather changes on human health. Fundamental Space Research, Proc. of International Conference. Sunny Beach, Bulgaria. 2008;21-28:306-309.
- Kodochigova AI, Samsonov SN, PolidanovMA. Psychological characteristics of the Heliomed 2 project volunteers and geomagnetic disturbance at high latitudes IOP Conference Series. Earth and Environmental Science. 2021. doi: 10.1088/1755-1315/853/1/012027.
- Cui L, Geng X, Ding T, Tang J, Xu J, Zhai J. Impact of ambient temperature on hospital admissions for cardiovascular disease in Hefei City, China. Int J Biometeorol. 2019 Jun;63(6):723-734. doi: 10.1007/s00484-019-01687-0. Epub 2019 Mar 9. PMID: 30852664.
- Ochiai AM, Gonçalves FL, Ambrizzi T, Florentino LC, Wei CY, Soares AV, De Araujo NM, Gualda DM. Atmospheric conditions, lunar phases, and childbirth: a multivariate analysis. Int J Biometeorol. 2012 Jul;56(4):661-7. doi: 10.1007/s00484-011-0465-y. Epub 2011 Jul 9. PMID: 21744100.
- Sasonko ML, Ozheredov VA, Breus TK, Ishkov VN, Klochikhina OA, Gurfinkel YI. Combined influence of the local atmosphere conditions and space weather on three parameters of 24-h electrocardiogram monitoring. Int J Biometeorol. 2019 Jan;63(1):93-105. doi: 10.1007/s00484-018-1639-7. Epub 2018 Dec 18. PMID: 30565078.
- Stoupel E, Radishauskas R, Bernotiene G, Tamoshiunas A, Virvichiute D. Blood troponin levels in acute cardiac events depends on space weather activity components (a correlative study). J Basic Clin Physiol Pharmacol. 2018 Jun 27;29(3):257-263. doi: 10.1515/jbcpp-2017-0148. PMID: 29397386.
- Samsonov S, Parshina S. Space weather in the 11-year solar cycle and cardio-sensitivity of volunteers in the middle latitudes IOP Conference Series. Earth and Environmental Science. 2021. doi: 10.1088/1755-1315/853/1/012025.
- Golovina E, Trubina M, Stupishina O, Misyura O. Influence of the urban atmosphere on human health. Proceedings of the 15th International Congress of Biometeorology & International Conference on Urban Climatology Sydney, Australia. 1999;265-270.
- Golovina E, Karpova J, Stupishina O, Trubina M, Tenilova O. Biometeorological investigations in St. Petersburg. Polish-Russian Proceedings of Symposium “Applied Climatology & Bioclimatology”, Lodz, Poland. 2001;167-170.
- Stupishina OM, Golovina EG. Investigation of correspondence between Environmental Parameter Complexes and Human Body Status. Proceedings of V International conference “Atmosphere, Ionosphere, Safety”. 2016;263-267.
- Stupishina OM, Golovina EG. Detection and monitoring of Environmental Factors those can be Responsible for the Cardio-Catastrophes, Proceedings of VI International conference “Atmosphere, Ionosphere, Safety”. 2018;235-239.
- Stupishina OM, Golovina EG. On space weather factors which can impact terrestrial physical and biological processes. Pan-Eurasian Experiment (PEEX)-Observation, Modelling and Assessment in the Arctic-Boreal Domain. EGU. Vienna. 2020. doi: 10.5194/egusphere-egu2020-5892.
- Stupishina OM, Golovina EG, Noskov SN. Assessment of the relationship of the population’s medical care with the factors of earth and space weather. Hygiene and Sanitation. 2021. doi: 10.47470/0016-9900-2021-100-8-775-781.
- Stupishina OM, Golovina EG, Noskov SN. The relation of the human cardiac-events to the environmental complex variations IOP Conference Series. Earth Environ Sci. 2021.
- Stupishina OM, Golovina EG, Noskov SN. The relation of the Ischemia cases in St. Petersburg to the environmental complex variations. Public Health and Life Environment. 2021. doi: 10.35627/2219-5238/2021-29-9-16-22.
- Stupishina OM, Golovina EG, Noskov SN, Eremin GB, Gorbanev SA. The space and terrestrial weather variations as possible factors for ischemia events in St. Petersburg. Atmosphere. 2021. doi: 10.3390/atmos13010008.
- Noskov SG, Golovina EG, Stupishina OM, Mironenko OV. Assessment of the influence of climatic factors on the well-being of the population by method of questioning. Hygiene and sanitation. 2022. doi: 10.47470/0016-9900-2022-101-8-866-871.
- Poppe BB, Jorden KP. Sentinels of the Sun: Forecasting Space Weather. Boulder, Colorado: Johnson Books; 2006.
- Bothmer V, Daglis I. Space Weather: Physics and Effects, New York: Springer-Verlag; 2006.
- Solar data source: Space Weather Prediction Center.
- Satellite GOES data source: Space Weather Prediction Center.
- Geomagnetic data source: INTERMAGNET- the global network of observatories monitoring the Earth’s magnetic field, Nurmijarvi observatory, St. Petersburg observatory.
- Ionosphere data source: Space Weather Prediction Center.
- Meteorological data source.
- Synoptic data.
- Heart Disease and Sudden Cardiac Death, Written by WebMD Editorial Contributors, Medically Reviewed by Beckerman J on June 19, 2020.
- Practice Essentials.
Content Alerts
SignUp to our
Content alerts.
 This work is licensed under a Creative Commons Attribution 4.0 International License.


