Medicine Group . 2022 April 19;3(4):348-354. doi: 10.37871/jbres1447.
Impacts and Causes of Flood Hazards on Public Health and Socio-Economic: The Case of Hirna Town, West Hararghe Zone, Oromia National Regional State, Ethiopia
Shemsedin Abrahim1, Michael Aliyi2, Muhammad Ali3 and Tewekel Melese4*
2College of Hydraulic Science and Engineering Yangzhou University, China
3Yangzhou University, Department of Clinical Medicine, China
4Department of Hydrology and water resources, Jilin University, China
- Flood
- Public health
- Socio-economic impact
- Coping strategies
- Hirna town
Abstract
Introduction: Flooding is the most common destructive natural event globally.
Aim: The goal of this study was to identify the causes of floods and their socio-economic consequences and public health.
Materials and Method: The primary data collection methods were structured survey questionnaires, key informant interviews, focus group discussions, field observation, and document analysis. The survey questionnaires with 29 items were sent to 121 homes. The sample size for the house-to-house questionnaire survey was determined using the formula for sample size determination. Both probability and non-probability sampling techniques were used in this investigation. The data were summarized and analyzed using both qualitative and quantitative methodologies. The qualitative data gathered from key informant interviews, focus group discussions, and observation was interpreted, and the analysis was combined with survey findings to substantiate the outcome.
Results: The lack of flood drainage infrastructure in the research area, according to 74.4 % of the homes, is the most important root cause of floods. Floods can increase the danger of waterborne pathogens and bug infections, with the most prevalent ailments experienced by the tested households being the common cold, malaria, diarrhea, and pneumonia. The lack of an early warning system played a significant role in exacerbating the flood damage. About (18.2%) claimed they were evacuated from their homes until the rainy season was over and back. The other (25.6%) diverged water flow direction and coping strategies to prevent flood impacts during flood events.
Conclusion: One of the most prevalent illnesses observed in the houses surveyed was malaria. As a result, flooding is the most serious concern or hazard in the research area. Based on this analysis, the government should find a way to prevent flooding and drainage problems among the suspected areas. It is recommended that the watershed of the site should be delineated, and the streamline should be identified and managed properly.
Introduction
Flooding is the most common destructive natural event globally, affecting all rural and urban areas in developed and developing countries [1]. Flooding causes many immediate and long-term health consequences, ranging from drowning and injuries to infectious infections and mental health issues. Flooding has killed 1000 people and affected over 3.4 million people in the region over the last ten years. Drowning accounts for two-thirds of all deaths, with the rest coming from physical damage, heart attacks, electrocution, carbon monoxide poisoning, and fire. Region. Two-thirds of such deaths are from drowning, and the remainder from physical trauma, heart attacks, electrocution, carbon monoxide poisoning and fire [2]. The elderly and the impaired are particularly vulnerable. Social implications, such as evacuation and displacement and events during the restoration period, have substantial health consequences. Furthermore, the health and social repercussions might vary greatly depending on local weather and flood conditions, the timing of floods and warnings, preparation, and socio-economic status [3,4]. Flood vulnerability is high in developing countries [5]. Due to limited development prospects and relatively cheaper land, for instance, poor people tend to choose distant low-lying floodplains [6]. Their livelihoods and assets are less safeguarded, and as a result, they have a limited capacity to cope with property losses caused by flooding as well as individual and cumulative disaster-related experiences or stressors, such as water damage, loss of personal belongings, and reconstruction challenges [7,8]. Flooding accounts for more than 30% of global economic losses from all-natural disasters worldwide [9]. Flood control infrastructure, early warning, insurance, land use planning, and building standards are among the risk reduction and adaptation strategies being considered by many countries [10]. Understanding how a wide range of disaster losses are distributed across socioeconomic categories should help policymakers progress both in adaptation and economic development [11]. Natural disasters can disproportionately affect low-income households [12,13]. Many people work in the agricultural sector in developing countries, which is particularly exposed to natural disasters, either directly or indirectly [14].
Floods are the most frequent and widespread disaster in the African continent. Floods are becoming more frequent and severe in most parts of Africa, particularly Sub-Saharan Africa [15]. It is mostly caused by the country’s terrain, including highland mountains and lowland plains with natural drainage systems formed by the major river basins [16]. Samson [17] stated that most floods in the country are caused by rivers overflowing, causing runoff and inundation along their banks in lowland plains and topographic features that are 0% to 2% swampy and vulnerable to flooding. However, due to a limited number of hydrology and stream gauging stations, it is impossible to measure and map all forms of flood hazards in Ethiopia [18]. Excess rainfall on upstream watersheds causes flash floods, which surge downstream with huge concentration, speed, and intensity, and river floods that overflow outside the river channel. The most dominant flood-prone woredas, 31%, are found in Oromia regional national states due to the major overflow of rivers and the heavy rainfalls. Flash floods are common in most parts of a region, especially when rains occur during prolonged dry spells [19].
Hirna town is one of the towns in the West Hararghe Zone that has been impacted by flooding for a long time, causing loss of life, property damage, and disrupting economic activity [20]. Flooding has become more common in recent years, resulting in significant losses in human life and property in a town and neighboring rural kebele. Indeed, this is intimately linked to investigating the causes of flooding hazards and the public health and socio-economic consequences of floods at a specific location, with all of its characteristics and flow patterns. The objective of this research was to assess the Impacts and causes of flood hazards on Public health and socio-economic.
Materials and Methods
The astronomical location of the city is approximately 9°13’0” to 9°13’30” N and 41°5’30” to 41°6’0” E latitude and longitude. The altitude of Hirna town is as low as 1765 m and as high as 1933 m above sea level. The study area lies within the semi-arid climate where winter remains cool, and summer is hot. The mean temperature of the study areas ranges between 14°C and 28°C some times, in the summer seasons, it rises to above 28ºC. Its land features are ups and downs in the northern and in all directions has farming spaces that do not have available infrastructure at all. The soil type around Hirna is primarily gray to very dark gray, or black clays or clay loams, and in some areas, there are also brown to reddish-brown clay soils. However, such soil characters usually have low infiltration rates during intense rainfall and promote rapid runoff. Soil surface properties can be the most important influence on runoff. The economic activities of the study areas are diverse. The agricultural production systems in Hirna town and surrounding areas are mixed farming and livestock rearing.
The primary data collection methods were structured survey questionnaires, key informant interviews, focus group discussions, and document analysis. The questionnaire of this study was both open and close-ended. Pre-testing of the questions was undertaken on 8 randomly selected non-sample households before interviewing sample respondents to make the necessary modification. The survey questionnaire with twenty-nine items was administered to 121 sample households in all purposefully chosen zones. The study purposefully selected five respondents for focus group discussion to fill the gaps in earlier research. They were purposely chosen because they understood the problem and had lived for more than ten years with the support of the 01 kebele leader. Disasters disproportionately affect women, children, and the elderly [21]. This study’s field survey observed the actual condition in the areas because the information gathered through site survey and observation is relevant to the research findings [22].
For this study, the sample size for the house-to-house questionnaire survey was determined using the formula for sample size determination as indicated in Equation 1. Hirna town is divided into two kebeles, each divided into several zones, as mentioned in the descriptions. Kebele 01 has three zones: zone 1, zone 2, and zone 3. Out of these zones, the kebele administration leaders assisted in the purposeful selection of flood-prone zones, classified as high, medium, and low exposure zones, with a minimum of 250 to 350 families in each zone. The overall number of homes affected in the kebele is estimated to be approximately 991, and the study used a representative sample of 12% of those involved for the house-to-house questionnaire survey. The sample size for the house-to-house questionnaire survey in this study was estimated using the Cochran formula expressed as Equation (1) [19].
where; no is the sample size for proportion population, Z is 95% confidence limit, i.e., 1.96, p is 0.1 (proportion of the people to be included in the sample), q is 1-p, which is 0.9, e is the acceptable margin of error that is 0.05 (is the desired or actual sample size), and N is the total number of household head in the kebele. As shown below; after using the two formulae one after the other (by substituting the value of no in the first formula into the second formula), the actual sample size was obtained
Both probability and non-probability sampling techniques were used in this investigation. In the non-probability sampling, a purposive sampling technique was utilized to select the study area the most vulnerable regions for flood based on the current knowledge, information obtained from elders and proximity to the most flood-inducing river.
The data were summarized and analyzed using both qualitative and quantitative methodologies. All survey questionnaires were analyzed in this study. Data analysis has been done in the form of descriptive and interpretive methods, using both qualitative and quantitative discussion of the data, which has been obtained from both primary and secondary sources. The questionnaire data were tallied, organized, and presented using simple descriptive statistical analysis techniques like graphs, tables, and charts. The qualitative data gathered from key informant interviews, focus group discussions, and observation was analyzed, and the analysis was combined with survey findings to substantiate the outcome. Various forms of tables, charts, and graphs were used in the descriptive analysis of both qualitative and quantitative data.
Results
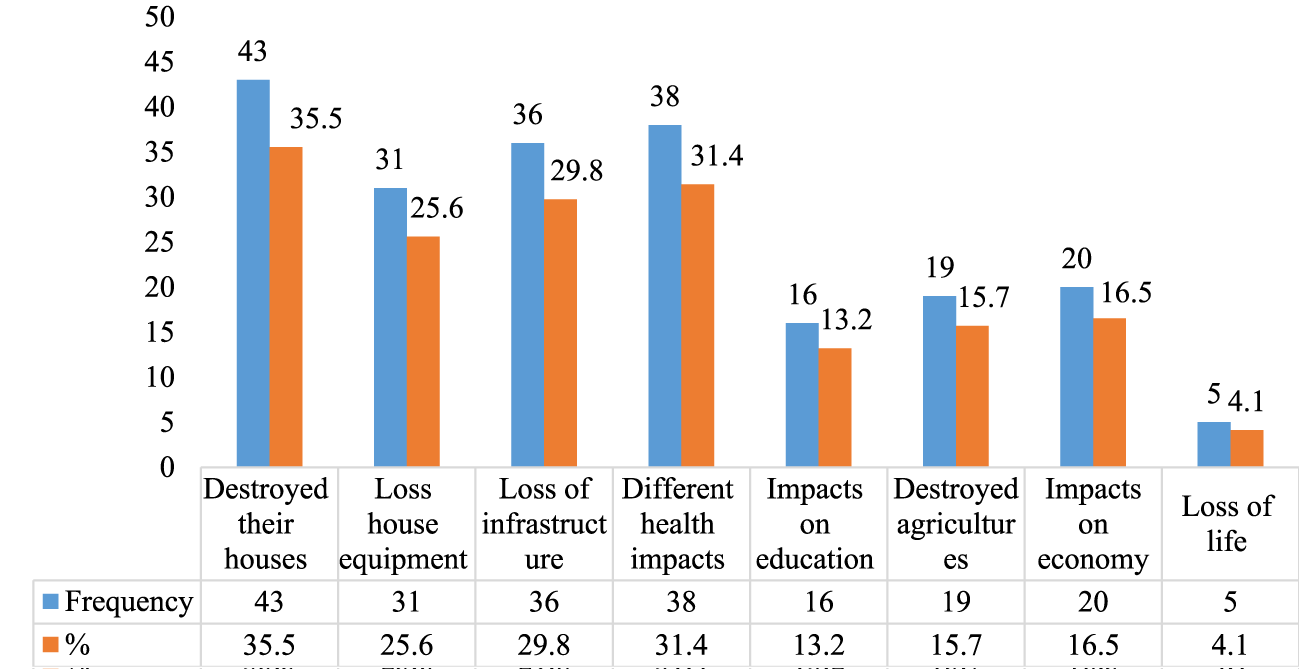
Because of the serious nature of the problem under investigation, it was important to identify respondents in the study area who were old enough to understand the issues and give meaningful responses, which will help an appropriate policy direction to correct the problem. From the total sampling, about 62% of the respondents are aged between 15-49 years, while 33% are aged between 50-65 years and only 5% of the respondents are aged above 65 years. In analyzing the socioeconomic impacts of flooding in the study area, most respondents chose more than one effect stated on the house to house questionnaire. The flood destroyed their homes (35.5%), household equipment loss (25.6%), the flood has cost them physical infrastructure loss (29.8%), different kinds of health effects related due to flooding (31.4%), agricultural or garden areas were destroyed (13.2%), impacts on education sectors (15.7%), disturb economic activities (16.5%) by destroyed valuable commercial items and about 5 households (4.1%) loss their family due to flooding were described as major effects cause by the flood in the study area. Similarly, the majority of the respondents, 90.1%, agreed that during flooding, their health infrastructure, especially the classrooms of Hirna primary hospital and its fences, were always destroyed.
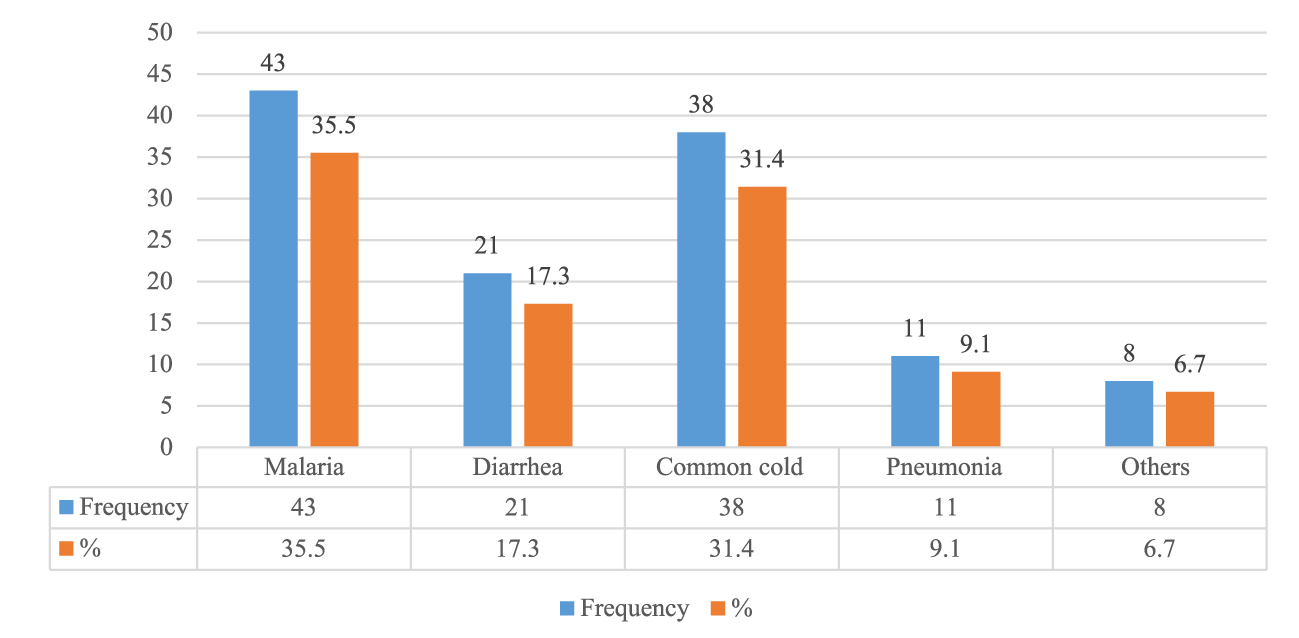
Additionally, participants mentioned that many elderly people die and several children were affected by diarrhea during flood season due to flood-related disease though this should be substantiated with the proper scientific method in the future. The study found that conditions such as common cold, malaria, cholera, and pneumonia were prevalent in the study area due to flooding. The most significant diseases experienced among the sampled households were common cold 31.4%, malaria 35.5%, diarrhea 17.3%, pneumonia 9.1% and merely 6.7%of the sampled households they experienced other disease outbreaks like scabies during the floods.
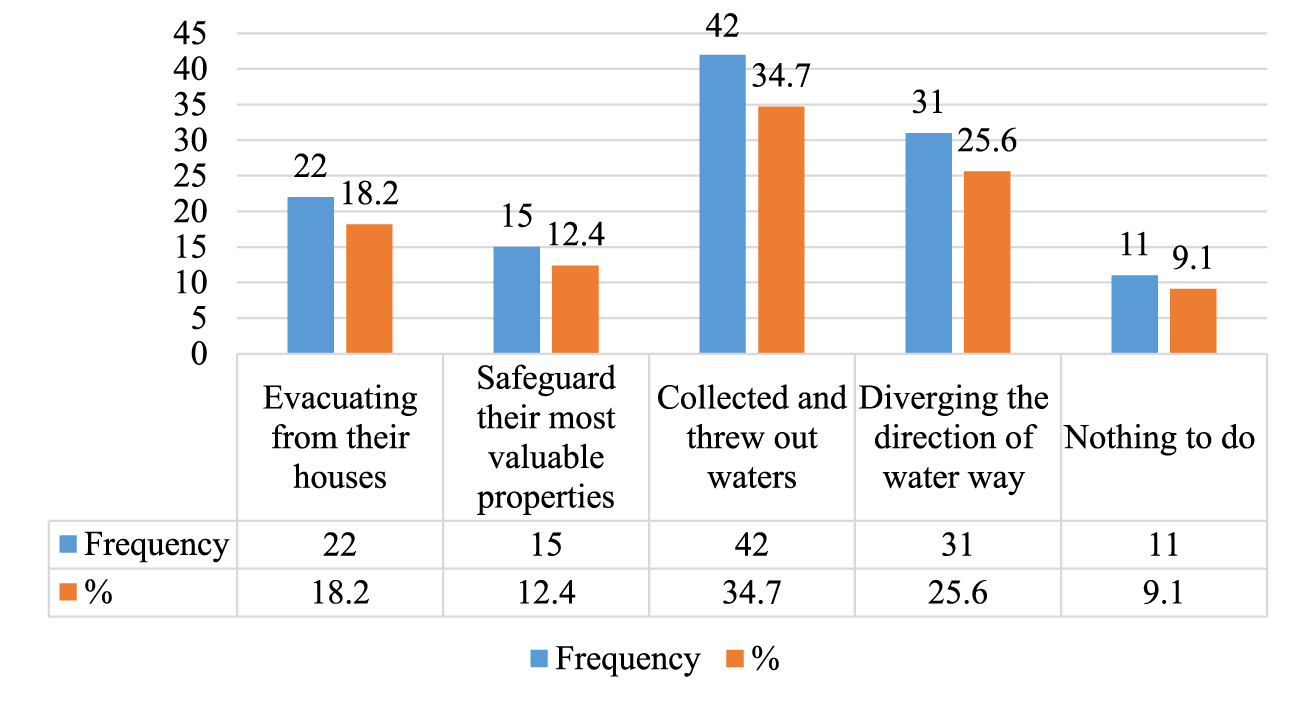
Local strategies employed by households during flood events, those who believed their coping strategies on how to prevent flood impacts during flood events are, majority of respondents (34.7%) collected and threw out water after it entered their homes, about (18.2%) of respondents claimed they were evacuated from their house until the rainy season is over, about (12.4%) made efforts to safeguard their most valuable properties with the others or shifting properties to relatively drier areas during flooding, and the other (25.6%) diverging the direction of water to different ways.
Discussion
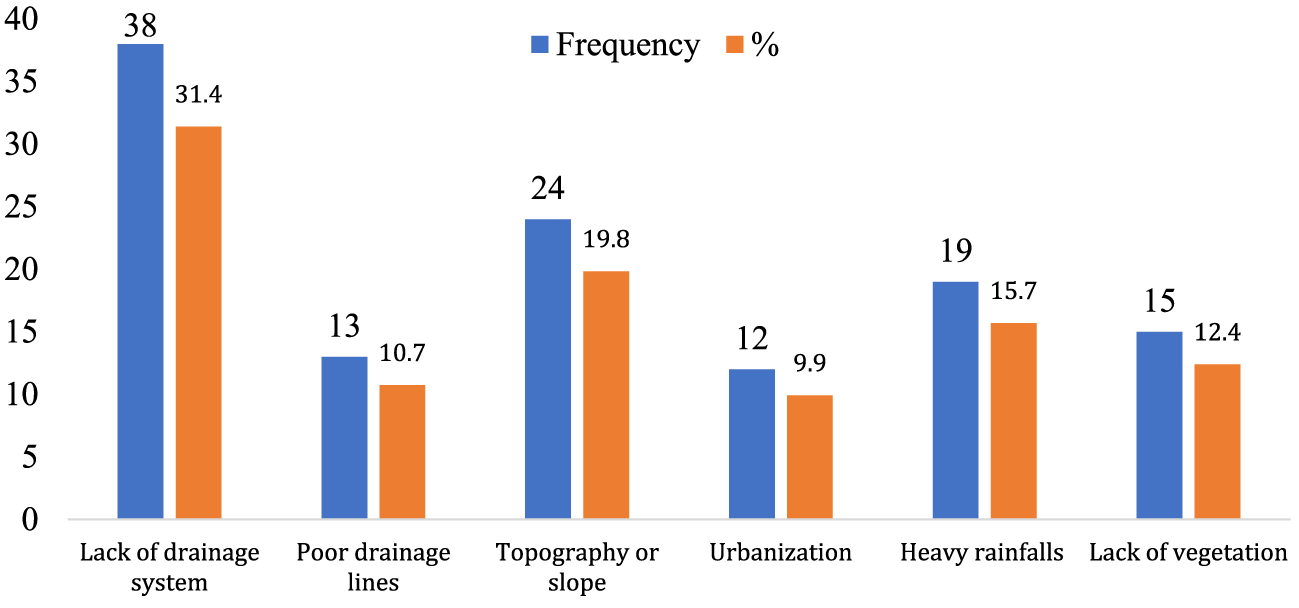
Determining the major causes of flooding is essential to help policymakers and other stakeholders plan and mitigate current situations and prevent future floods [23]. The main flood factors are the combined effects of both human-induced and natural causes. This conforms with Stephen, [24] that floods are caused by single or multiple factors that are either natural or anthropogenic due to inappropriate development in flood plains, building on the watercourse and impermeable materials. According to the respondents (31.4%), the most important root factor of floods in the study area is the lack of flood drainage systems (Figure 1).
In many developing countries, urban floods are caused by the effects of deficient or improper land use planning and riverside settlements [23]. The main factors of flooding in the specific areas are the combined effects of human-induced and natural causes, including heavy rainfalls, topographic nature, deforestation, increased population density along the river, poor land-use planning, poor urban planning and quarrying along with flood plains areas, similar to Reddy [16]. In light of the above information, about (%19.9) of respondents believe that the other factors that cause flood were related to the topographic nature. The intensity and the occurrence of flash flooding can be determined by the power and distribution of the rainfall, the topography, land use, and soil type [25].
The slope classifications ranging from 30% in the town promote major flash floods to the lower slopes in the down catchment. Whereas pitch ranging from 0-2% areas usually face drainage problems, such regions are highly vulnerable to flooding [26]. The topography and landform of Hirna town are also undulating, comprising several ups and downs, river and swampy. The topographic nature of the Hirna town is analyzed by calculating the slope and classifying it into seven categories [27]. About 6.4% and 28.5% of area coverage lie between 0-2% & 2.1-5% slope percent, respectively, implying that areas in specific slope classification are considered swampy areas.
The town’s slope shows that most of the areas found are flat, considered major problems for drainage, swampy, and prone to flooding [27]. The specific study area kebele 01 slope lies mostly on 0-2%, and the south side of the site around the mountain has a percentage greater than 30%. This implies that the study area is prone to flash floods from steep floods and settles on the flat terrains. Topography also defines drainage patterns and flow accumulation [28]. Running water moves very quickly on steep slopes, thereby reducing the amount of water be penetrated the ground. Water accumulated at the gentle slope areas becomes difficult to flow rapidly, and if the permeability of the soil is weak and the intensity of the rainfall is high as well, then this can result in flooding [20].
Floods have various socio-economic impacts [29]. The effects of flooding are divided into primary, secondary and tertiary effects of long-term outcomes [30]. The poor society is the most of the flood victims [31]. As indicated in the analysis of the socio-economic impacts of flooding in the study area, the informants responded that most respondents chose more than one effect stated on the house to house questionnaire (Figure 2).
The flood destroyed around 35.5 % of respondents’ homes, and about 5 families (4.1 %) lost family members. The majority of the study’s households (35.5%) said that house damage was the most affected during the flood or affected the built-environment significantly destroyed their houses. Around (31.4%) of the respondents were exposed to different health problems caused by the flooding due to other kinds of waterborne health problems, and poor health can be associated with different types of waterborne health post-flood effects. In developing countries, the majority of flood deaths are caused by diarrhea and other waterborne diseases [32]. Around 93.4% of the respondents indicated having at least one family member of their household getting sick during the floods. The spread of the contaminated wastewater may lead to disease outbreaks such as mosquitos’ breeding ground, which can cause malaria outbreaks. The most disease among the sampled households were common cold 31.4%, malaria 35.5%, diarrhea 17.3%, pneumonia 9.1%, and merely 6.7%. Malaria was amongst the most significant diseases encountered in the sampled households. Therefore, flooding is the study area’s main issue or problem (Figure 3).
The effect of flood on education can encourage school dropouts, thus hindering this population from attaining the right information about flood preparedness and embracing sustainable development to reduce the impacts [28].
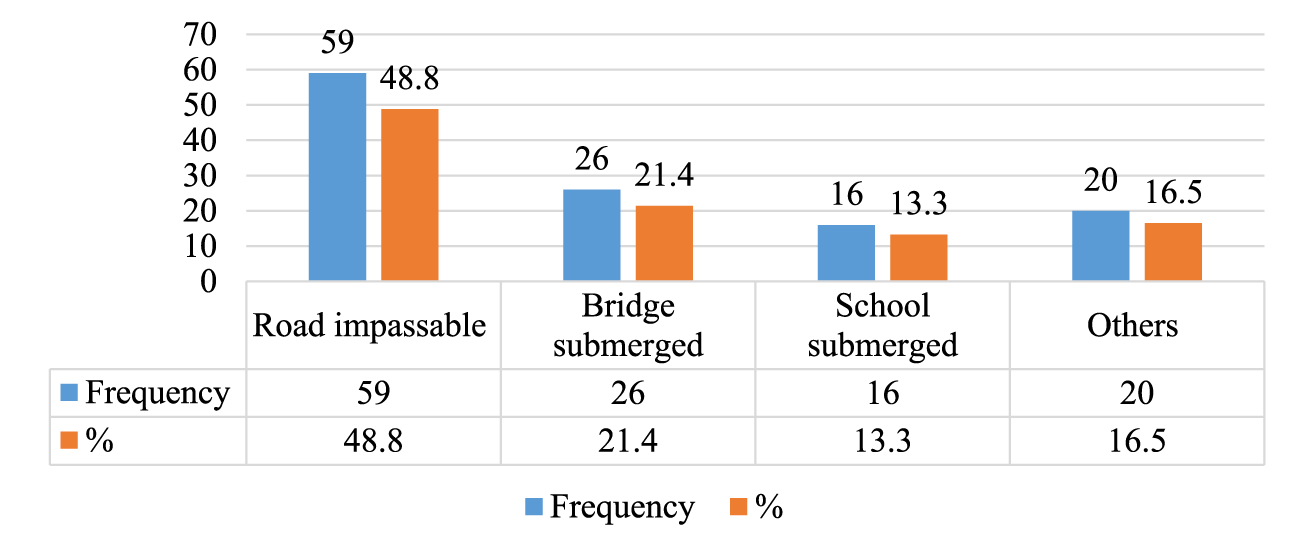
The majority of respondents (48.7%) said road impassability has a great role in student dropouts, as well as (21.4%) road submerged, (13.3%) schools were destroyed, and the remaining (16.5%) was because of illness, psychological stress, or frustrations that the students dropped out the school (Figure 4). Flood impacts the economic foundation due to cost expenditure for rehabilitation and reconstruction of the damaged infrastructures, a private institution, individual houses, and housing equipment and affects the amount of government revenue [33].
The awareness of flood hazards may raise the population’s attention on managing flood risks. The absence of an early warning system highly contributed to the increment of the flood impact. Therefore, a fast communication system with reliable and timely information which helps to circulate flood warning information is important in the area. Local strategies employed by households during flood events, those who believed their coping strategies on how to prevent flood impacts during flood events are, majority of respondents (34.7%) collected and threw out water after it entered their homes, about (18.2%) of respondents claimed they were evacuated from their house until the rainy season is over, about (12.4%) made efforts to safeguard their most valuable properties with the others or shifting properties to relatively drier areas during flooding, and the other (25.6%) diverging the direction of water to different ways (Figure 5).
Concussion
Flooding is the most prevalent natural disaster worldwide, affecting industrialized and developing countries. Flooding has various short- and long-term health implications, ranging from drowning and injuries to infectious diseases and mental health problems. The lack of flood drainage systems is the most significant cause of floods in the studied area. The flood destroyed around 35.5% of respondents’ homes, and roughly 5 families (4.1%) lost family members. The majority of the families in the study (35.5%) reported that house damage was the most affected by the flood or seriously damaged their built environment. Around (31.4%) of the respondents were exposed to different health problems caused by the flooding due to other kinds of waterborne health problems, and poor health can be associated with different types of waterborne health post-flood effects. The majority of respondents (34.7%) feel their coping techniques for reducing flood impacts are local tactics used by households during flood occurrences. So, the watershed area should be designated, and the streamline should be identified and managed effectively. The most prevalent diseases among the selected homes were the common cold (31.4%), malaria (35.5%), diarrhea (17.3%), pneumonia (9.1%), and a mere 6.7%. Malaria was one of the most common infections found in the households studied. As a result, flooding is the primary concern or problem in the studied region.
In the study area also, flood causes a disturbance of ecology and enormous impacts on the environment, destroy communities’ houses and household equipment, damage different physical infrastructures, promoted waterborne diseases, disturbed teaching-learning activities, and damage field crops. The main health impact resulting from flooding are injuries, vector-borne illnesses, malnutrition, psychological problems and damage to health infrastructure. Individual homes, communities, and organizations used various coping techniques to prevent floods or limit the effects of floods to maintain their lifestyles and recover their losses. Coping strategies examined in the study area before the flood happens, during the flood event and within the after flood impact is clear choked drains, construction of temporal drains and bridges, use of sand and stone bags, collecting and throwing out water, diverting the direction of water to other ways and sharing resources from the community, helping from government or non-governmental organizations.
Generally, even though a lot of research has been done on this topic, they could not address the flooding problem with different health issues in this area and all over the country. However, many areas of the country could suffer illnesses from drainage and flooding. So, the researchers should deeply research the health and economic effects of the flooding problem.
Acknowledgment
The authors would like to thank the interviewer for participating in the study.
Financial Support and Sponsorship
No.
Conflicts of Interest
There are no conflicts of interest.
References
- Fekede A. Causes and impacts of flooding in dire Dawa city, Eastern Ethiopia. ASTU. 2018. https://bit.ly/3vqXXd5
- Martinez GS, De’Donato F, KendrovskiV. Heat and health in the WHO European Region: Updated evidence for effective prevention. 2021.
- Tapsell SM, Penning-Rowsell EC, Tunstall SM, Wilson TL. Vulnerability to flooding: health and social dimensions. Philos Trans A Math Phys Eng Sci. 2002 Jul 15;360(1796):1511-25. doi: 10.1098/rsta.2002.1013. PMID: 12804263.
- Reacher M, McKenzie K, Lane C, Nichols T, Kedge I, Iversen A, Hepple P, Walter T, Laxton C, Simpson J; Lewes Flood Action Recovery Team. Health impacts of flooding in Lewes: a comparison of reported gastrointestinal and other illness and mental health in flooded and non-flooded households. Commun Dis Public Health. 2004 Mar;7(1):39-46. PMID: 15137280.
- Jha A, Lamond J, Bloch R, Bhattacharya N, Lopez A, Papachristodoulou N, Bird A, Proverbs D, Davies J, Barker R. Five feet high and rising: Cities and flooding in the 21st century. World Bank Policy Research Working Paper. 2011. doi: 10.1596/1813-9450-5648.
- Dasgupta A. Floods and poverty traps: Evidence from Bangladesh. Economic and Political Weekly. 2007; 42(30):3166-3171. https://bit.ly/3vtV7UA
- Brouwer R, Akter S, Brander L, Haque E. Socioeconomic vulnerability and adaptation to environmental risk: a case study of climate change and flooding in Bangladesh. Risk Anal. 2007 Apr;27(2):313-26. doi: 10.1111/j.1539-6924.2007.00884.x. PMID: 17511700.
- Verger P, Rotily M, Hunault C, Brenot J, Baruffol E, Bard D. Assessment of exposure to a flood disaster in a mental-health study. J Expo Anal Environ Epidemiol. 2003 Nov;13(6):436-42. doi: 10.1038/sj.jea.7500290. PMID: 14603344.
- Hallegatte S, Green C, Nicholls RJ, Corfee-Morlot J. Future flood losses in major coastal cities. Nature climate change. 2013;3(1):802-806. https://go.nature.com/38Sv81v
- Allaire M. Socio-economic impacts of flooding: A review of the empirical literature. Water Security. 2018;3(1):18-26. doi: 10.1016/j.wasec.2018.09.002
- Tahira Y, Kawasaki A. The impact of the Thai flood of 2011 on the rural poor population living on the flood plain. Journal of Disaster Research.2017;12(1):147-157. doi: 10.20965/jdr.2017.p0147
- Rentschler JE. Why resilience matters-the poverty impacts of disasters. World bank policy research working paper. 2013. https://bit.ly/37kNrME
- Nabangchang O, Allaire M, Leangcharoen P, Jarungrattanapong R, Whittington D. Economic costs incurred by households in the 2011 Greater B angkok flood. Water Resources Research. 2015;51(1):58-77. doi: 10.1002/2014WR015982
- De Silva M, Kawasaki A. Socioeconomic vulnerability to disaster risk: A case study of flood and drought impact in a rural Sri Lankan community. Ecological Economics. 2018;152(1):131-140. doi: 10.1016/j.ecolecon.2018.05.010
- Douglas I, Alam K, Maghenda M, Mcdonnell Y, McLean L, Campbell J. Unjust waters: Climate change, flooding and the urban poor in Africa. Environment and Urbanization. 2008;20(1):187-205. doi: 10.1177%2F0956247808089156
- Reddy R, Danssie MZ. Socioeconomic impacts of the 2006 seasonal flooding and coping strategies along flood prone areas: The Case of Dire Dawa Administration. Haramaya University. 2014.
- ABAYA SW. Floods and health in Gambella region, Ethiopia: An assessment of the strength and weakness of the coping mechanism. Lund, Sweden: Lund University. 2008. https://bit.ly/3xBIXvM
- Bishaw K. Application of GIS and remote sensing techniques for flood Hazard and risk assessment: The case of Dugeda bora Woreda of Oromiya regional state, Ethiopia. 2012.
- Billi P, Alemu YT, Ciampalini R. Increased frequency of flash floods in Dire Dawa, Ethiopia: Change in rainfall intensity or human impact? Natural Hazards. 2015;76(1):1373-1394. https://bit.ly/3rzk7sy
- Gebremeskel E. Coping strategies of displaced flood victims: The case of Dire Dawa. Addis Ababa University. 2011.
- Dinh TN, Xuan Y, Thai MT, Pardalos PM, Znati T. On new approaches of assessing network vulnerability: Hardness and approximation. IEEE/ACM Transactions on Networking. 2011;20(1):609-619. doi: 10.1109/TNET.2011.2170849
- Kitchen R, Tate N. Planning a research project. Conducting research in human geography: Theory, methodology and practice. 2000;2(1):28-44, 2000. doi: 10.4324/9781315841458
- Alhassan TH. The Impact of flooding on social services in the tamale metropolis of Ghana. 2015.
- Stephen A. River systems & causes of flooding. Tulane University, EENS. 2011.
- Yirgalem G. Suitability analysis for urban green space development using geospatial technology: A case of Adama Town, Ethiopia. ASTU. 2021.
- Bahr Dar E. BY: ABDETA LETA. 2020.
- Legese B, Gumi B, Bule Hora E. Flooding in Ethiopia: Causes, impact, and coping mechanism. A Review. 2020.
- Senbeto AA. Seasonal Flooding Vulnerability, Cause, Impact and Coping Strategies in Southern Ethiopia Urban Areas. The Case of Sawla Town: GRIN Verlag. 2018.
- Ouikotan R, Van der Kwast J, Mynett A, Afouda A. Gaps and challenges of flood risk management in West African coastal cities, in Proceedings of the XVI World Water Congress, Cancun Quintana Roo. 2017. https://bit.ly/3jPq1RQ
- Rabalao R. The social, psychological and economic impact of flooding in Ga-Motla and Ga-Moeka communities of Moretele district in North West Province, South Africa, University of Free State. 2010. https://bit.ly/3Ep2a5f
- Pavlova V. Strategies for city resilience to riverine floods. Case of Mzimbazi River, Dar es Salaam. 2016.
- Hafiz AT. The impact of flooding on social services in the Tamale metropolis of Ghana, Master of Science thesis submitted to Kwame Nkrumah University of Science and Technology. 2014. https://bit.ly/3OmxDt5
- Alemu Y. Socio-economic impact of flooding in Dire Dawa, Ethiopia, Unpublished MSc. Thesis, International Center for Water Hazard and Risk Management, Tsukuba, Japan. 2009. https://bit.ly/3vtvWl5
Content Alerts
SignUp to our
Content alerts.
 This work is licensed under a Creative Commons Attribution 4.0 International License.


