> Environmental Sciences. 2021 June 24;2(6):516-522. doi: 10.37871/jbres1268.
Faster Evaluation of Contaminated Surfaces for Mould Inspections by Tape Sampling
Judith Meider1* and Constanze Messal2
2MICOR Gesellschaft für mikrobielle Prozesse und Materialkunde mbH, Schutower Ringstrasse 6, 18069 Rostock, Germany
- Adhesive film
- Tape sampling
- Mold removal control
- Moist damage
- Assessment criteria/li>
- Target value
Abstract
Taking a tape-lift sample is one of the main practices used by indoor environmental quality investigators for detecting whether mould structures (for example, spores and hyphae) have either settled onto or colonized the surface. Despite the popularity of the method, there can be significant inconsistency in how tape lifts are collected and evaluated.
The common ASTM standard D7910-14: Practice for the Collection of Fungal Material from Surfaces by Tape Lift, describes the correct way to collect a tape-lift sample. Using ASTM D7658-17: Standard Test Method for Direct Microscopy of Fungal Structures from Tape, semi-quantitative results in percentage of infested area in a scale from 0 up to 5 are available only.
In case histories or for mould removal control, the total cell count is needed. This cannot be realized by the ASTM method. Therefore, an innovative method is asked to combine the quickness of taping and the precision of total cell count. Our research team developed two methods to quickly and fully quantify the tape samples. Regarding the assessment criteria, the user can decide to operate with the 3-LINE method to achieve the highest precision or use the faster 3-STEP method for even better results. Therefore, an innovative method is asked to combine the quickness of taping and the precision of total cell count. The aim of the work is to develop two strategies to quickly and comprehensive quantify the tape samples.
Introduction
In case of moist damage and for measuring the success of a mould remediation, a diagnosing method is needed for a fast, simple, and yet an accurate determination of the mycelia growth and contamination by spores, hyphae, and other fungal structures [1]. The method should determine the concentration of cells and cell structures to evaluate case histories or whether the biomass has been sufficiently reduced.
Cultivating samples can deliver results with sufficient precision concerning different species and genus. However, this process also has its limitations, as it requires a lengthy standard incubation and the only organisms that will grow are the ones that are ready to germinate. These factors are further influenced by the types of culture medium and the incubation environment.
The question is: how to analyze the mould biomass within a shorter timeframe and independently of cultivation and cell vitality?.
Section 3.2.1 of the draft of the WTA leaflet E-4-12 edition: 03.2020/D ‘Ziele und Kontrolle von Schimmelpilzschadensanierungen in Innenräumen’ (Aims and control of mould damage remediation of indoor spaces) [2] deals with the ‘material sample analysis as a method for controlling mould remediation’.
It is defined; for the direct determination of a successful mould remediation, the microscopic examination of surfaces in the form of adhesive tape contact samples or in the form of microscopic examination of material samples is preferable to complex and indirect methods.
Further, in Point 8, ‘Cleaning control of outsourced inventory’, is indicated. In the case of adhesive film contact samples due to the ratio of the sample surface to the total surface, however, has a very low statistical significance. The representation of the result increases with the number of samples taken. A smooth, closed surface should have a small number of mould components after cleaning. In practice, the following values of the evaluation from table 1 have proved their worth.
| Table 1: Suggestions for target values of purified inventory (according to [2]). | ||
| Hyphae/cm2 | Spores/cm2 | |
| Smooth surfaces | <50 | <150 |
Using the standard method, ASTM standard D7658-17, it is not possible to get a result conforming to the WTA or other guidelines demanding a total cell count value. Therefore, the quantifying microscopic analysis of surface tape samples is brought into a standardization process [3]. However, in order to obtain reproducible results for the evaluation according to table 1, an appropriate approach and standardization of the method is required. For the past two years, the team associated with this paper has been working on the validation of the adhesive film method. The results show several methods that allow a reliable assessment of adhesive films [4].
The starting point of the investigation was a definition of the task ahead that allows us to derive different procedures having the necessary quality [5]. In this paper we want to examine that this task can be carried out with a microscopy method using adhesive tape preparation. Hence the aim of the work is to develop two strategies to quickly and comprehensive quantify the tape samples.
Materials and Methods
Qualitative and quantitative detection of biomass
Basically, adhesive film analysis concerns the detection of biomass. The detection is differentiated into quantify and qualify the biomass. The first option means to determine an amount or a partial amount, using reference basis e.g. cm2. The second option is the detection of the composition, but also of the condition or properties (distinctions, infestation/contamination/ intact, defective). The two different types of analysis enabling equally wide-ranging grades of compatible measurement. The information from these methods can range from yes/no to type of species and number of species per cm2 (Figure 1).
To evaluate a new method of analysis, 37 commercial tape samples from case histories were counted completely in 24,000 fields of view, and later in 100, 300 and 900 fields of view by 3 analysts of two independent laboratories. In the end, up to 200 tape sample enumerations were used for a statistical analysis. To evaluate the quality of the method it was analysed first the deviation of cell counts by one analyst in 24,000 fields of view in comparison to 900, 300 and 100 at least. In a second evaluation the deviation of cell counts by all analysts were compared. As statistical method for evaluation the excellence the least squares linear regression was used.
In applying the quantifying adhesive tape analysis, the aim is to record the biomass per cm2. Therefore it was defined a procedure that yields to comparable results, using the same requirements regardless of the type of microscope. For evaluation and statistical analysis of this method first it had no relevance of counting mould growing or a contamination. The analysts had to count it as one hit without a qualifying comment. Further, the qualitative method was simplified, and the countable fractions were specified for counting typical spores and fractured hyphae.
In addition, a cancellation criterion was defined to avoid ‘meaningless counting’ especially when there are clearly interpretable results. One must always remember, especially in the case of ‘non-microscopic’ readers, that if a semi-quantitative adhesive tape is clearly evaluable, trying to achieve a full quantification is clearly a waste of time.
Microscopy techniques
Microscopes are used to map objects that are smaller than the resolution limit of the human eye. Being able to look at images of the smallest objects is no longer limited to light microscopes. All wavelengths, or electromagnetic fields of any kind, can be used as an imaging medium or lenses. As a result, electron beam microscopes are found in today’s laboratories, as well as tunnel, force, Raman, and even acoustic microscopes.
Light microscopes are limited in their resolution by the wavelength of the light. In addition, the image mode and the quality of the preparation (transparent, opaque) have an influence on the resulting image. Here, we distinguish between incident (also called reflected) and transmitted light microscopes. Usually, the resolution of a reflected light microscope is limited and barely reaches magnifications above 50 times. The reflected microscope uses the back scattered light of the illuminated surface. Thus, layers of mould can be identified as such, but spores or bacteria remain out of the range. The transmitted light microscope achieves a significantly higher resolution. Here, the light rays that radiate through the object are used for imaging, whereby the object either changes the phase or the amplitude of the light. In this way, magnifications of up to 1,000 times can be achieved, enabling images of incredibly small organisms like, for example, bacteria to be seen. With the magnification, the field depth decreases. Many spores and hyphae appear translucent, indicating that, in order to make even the smallest biological structures visible, one has to use special dyeing or contrast methods.
A disadvantage of translucent microscopy is that the resolution capacity required for the detection of microorganisms depends on the transmission capability of the affected substrate. However, plasters, wallpaper, wood or even EPS insulating materials only allow light to pass through up to 50 microns of layer thickness.
The problem could be solved with microtome sections, but this is rarely feasible in practice in case of a mould investigation.
The invention of the adhesive film preparations solved this problem, at least in part. In this context, examining an adhesive tape is not a ‘real’ direct microscopy [5].
The adhesive film covers the biomass when the tape is pressed onto the substrate and then removed again. In this way, the examined biomass can be assigned to a sampling location.
Limitations can arise due to the reproducibility of the biomass fixed to the film. When it is compared with the total biomass, which may also be present in deeper layers, this could lead to inaccurate conclusions. Depending on the task, a different biomass recording method may have to be used [6].
Adhesive tape samples (n = 37) were analysed by different test subjects under different microscopes. On the one hand a transmitted light microscope with a magnification of 1000 and a visual field number of 22 were used. Second the results were compared with magnification of 600 and a visual field number of 22. The samples were counted fully, partly, and minimally, and, in the end, up to 200 times. The test subjects could themselves choose to count either on the eyepiece measuring grid, camera window or the field of view. The only requirement was that they should count 3cm length of the entire adhesive tape. The width of the measuring field was determined by the lens and measuring field. The extrapolated results per cm² with the respective microscope factor were compared. The influencing factors, especially the magnification and the counting window, can also be evaluated with these values. For reliable results, the counted part of the tape sample must cover a statistically representative area. The error related to a complete count decreases with a larger area.
The aim of evaluating an adhesive tape sample is to show the biomass status of a surface. For this reason, it is not relevant which part of the adhesive tape is counted. It is important that the heterogeneity of the surface coverage is sufficiently recorded. The result should reflect the biomass status of a wall/surface, not that of a subarea of the sample (Figure 2).
The measuring field determines the result. The result varies according to the position of the ‘square centimetre’ as a closed measuring window. However, if the surface is smeared on the entire adhesive film, the heterogeneity of the surface allocation is sufficiently recorded.
The samples were evaluated by two methods: the 3-LINE process and the 3-STAGE method. In the 3-LINE process, the adhesive tape was counted in three horizontal rows, each having a length of over 3cm. In the 3-STAGE process, the adhesive film was also counted in three 3 rows. However, with this method, the 3cm was divided among the 3 rows (Figure 3).
A safe quantification of the biomass per cm2 in the sample is achieved through a 3-LINE process. Depending on the microscope and magnification, it shows 30-45% of the reference surface. The statistical evaluation of the adhesive film preparations evaluated in the laboratories showed a high degree of reliability and reproducibility. This was especially so for the evaluation of surfaces, where the target values were below 500 spores per cm2, for example, in the remediation control in sensitive areas or as described in the WTA leaflet on the evaluation of the cleaning of inventory.
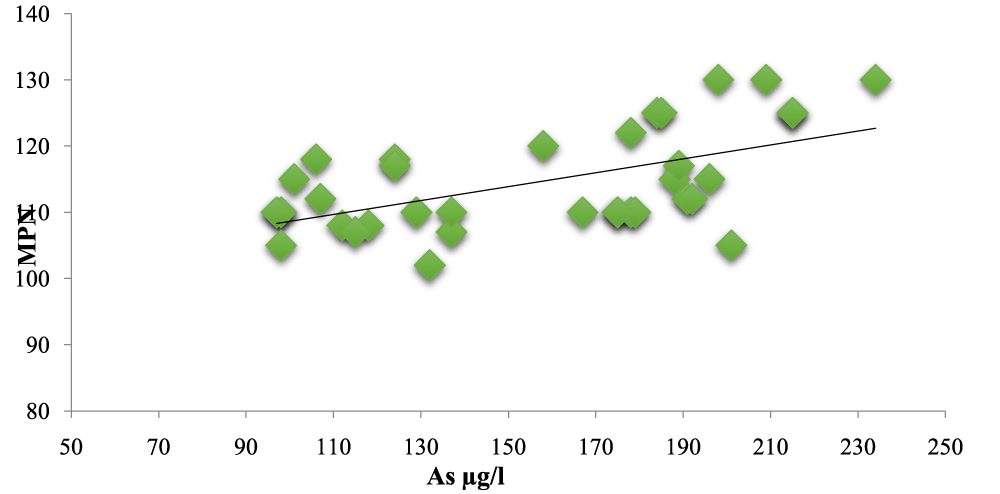
A safe quantification regarding the classification of biomass according to UBA [4] is possible with the 3-STAGE method. Depending on the microscope and magnification, it shows 11-5% of the reference surface. Especially, if higher cell counts were anticipated, the 3-STAGE method results in a good recovery rate in comparison to the fully count method or the 3-LINE method (Figures 4&5).
Cancellation criteria
For a fast analysis, especially in the 3-line process, cancellation criteria are defined. If the surface lines have a dense, equitable occupancy, the analysis can be cancelled after 2 lines. A third line improves the statistics but does not change the valuation of the sample.
It becomes difficult to define cancellation criteria for low and very low cell numbers. It can help to determine how much biomass can occur per measuring field, so that the target values are still achievable.
Samples with a very high cell count and/or a large number of other particles cannot be evaluated quantitatively. In this case, a semi-quantitative or qualitative analysis must be used, as described in table 3, for instance.
Results and Discussion
The evaluation of the analytical results has clearly shown how well the results of the individual test counters are consistent with each other and how well the values correspond with a fully counted sample (Figure 4). Furthermore, it was proved that even the simplified 3-stage method could achieve a high level of reproducibility. The statistics show that the methodology, as a whole, is more than 80% suitable. In the meantime, with the counting routines of the participating laboratories having been adjusted, it was possible to achieve a coefficient of determination R2 of 0.9.
It is important to have a high recovery rate when the adhesive tape samples have a low surface distribution, such as the remediation control of inventory or archaeological samples [7]. The recovery rate for cell numbers below 500 spores per cm2 is 70% in the LINE process. In the 3-STAGE method, the result is slightly lower at 65%.
The results will be comparable and highly accurate, if the same procedure is adopted for counting, regardless of the equipment used. Further, using a microscope of 100x magnitude or 600x is a matter of minor importance only. The most important factor is the reference basis of cm2. This is best achieved through looking at the linear extension of the sample. The measurement width depends on the device and determines, therefore, the calculation factor.
The 3-LINE method should be used for greater accuracy. Here, however, the user has the option of defining the termination criteria, if the result in the interpretation is unlikely to ensure any further accuracy. The 3-STEP method offers a fast and accurate analysis, especially for the determination of damages and the classification of the biomass according to the German Mould Guideline UBA [6].
The investigation has shown that that high precision correlates with the number of fields of view. This means that the desired accuracy of the evaluation must determine the number of fields of view. If the necessary quality cannot be achieved either by complete counting or by the methods presented, it might be necessary to choose a different analytical method.
Further the investigations have shown that the results are reliable and reproducible. The next aim would be to apply the LINE and STEP methods in practice. Therefore, a definition of the assessment criteria is required. The authors’ experience of the past years had shown the significance of the difference between case histories and removal control. Used in several research projects, the following assessment criteria were developed.
Removal control
Table 2 presents the recommended target value of mould contamination after a precision cleaning of indoor surfaces. As seen, the differentiation between porous surfaces like render or concrete and smooth surfaces like glass or metal yields two values regarding to the effect of the cleaning. There no need to differentiate between spores and hyphae, which are counting as one.
| Table 2: Assessment criteria of precision cleaning [7]. | ||
| Smooth surface Spores (hits) pro cm2 |
Porous surface Spores (hits) pro cm2 |
|
| Target value | 150 | 500 |
Case histories
The surface assessment in case histories differs to removal control by an accurate description of the microbial status to evaluate a damage and initiate counteractive measures. The recommended assessment standard is given in table 3.
| Table 3: Assessment criteria for indoor surfaces in case histories [6]. | ||
| Microbial Status | Spores/cm2 | Hyphae/cm2 |
| Normally contaminated surface (Background concentration) | <1,000 | <150 |
| Slightly increased contaminated (more than normally) |
> 1,000 - 10,000 | Single hyphae, no mycelia |
| Proliferation state Significantly contaminated, occurrence of colonization structures |
> 10,000 - 60,000 | Many, partly branched hyphae, small mycelia |
| Established Biomass Overgrown surface Heavily contaminated |
> 60,000 | Established fungal structures: mycelia, conidial heads, asci, secondary settlement |
Conclusion
This work showed the possibility to count cells, cell fragments or mycelia on tape lifts. It is a rapid, reproducible and cheap method instead of cultivation methods. It is an improvement regarding to ASTM standards in getting information about the investigated material. It can describe the biomass status as Biofilm, Contamination or destroyed cell fragments too. The only limitation of use is the material, which should be tested. This is described in [8,9] but not in the interest of this work. In practice the analyst needs to decide, what cell count is expected to choose the right method (more or less counting areas). The analyst can also start with the enhanced 3-LINE method and break up using the Cancelation criteria. If the Analyst needs information about the genius of the species this method will be not the right one at once. Therefore, the cultivation methods are the better choice. In lab practice of the authors booth methods are used as an inhouse standard.
Declarations
Ethics approval and consent to participate. We confirm that any aspect of the work covered in this manuscript has been conducted with the ethical approval of all relevant bodies and that such approvals are acknowledged within the manuscript.
No conflict of interest exists. We wish to confirm that there are no known conflicts of interest associated with this publication and there has been no significant financial support for this work that could have influenced its outcome.
Availability of data and materials
The datasets used and/or analysed during the current study are available from the corresponding author on reasonable request.
Authors’ contributions
We confirm that the manuscript has been read and approved by all named authors. We confirm that the order of authors listed in the manuscript has been approved by all named authors. Both authors were involved in the entire work.
References
- Jones CL. Mould in building disputes. J Bacteriol Mycol Open Access. 2018;264-272.
- WTA leaflet E-4-12 Edition. 03.2020/D. Ziele und Kontrolle von Schimmelpilzschadensanierungen in Innenräumen.
- ASTM D7658-17: Standard Test Method for Direct Microscopy of Fungal Structures from Tape. ASTM 2017. https://bit.ly/3gL7wNP
- Messal C. Semi-quantitative microscopic evaluation of material samples; Schützen & Erhalten. 2018.
- Messal C, Münzenberg U, Steringer M. To preserve our cultural treasures. B+B Bauen im Bestand. 2019.
- Leitfaden zur Vorbeugung, Erfassung und Sanierung von Schimmelbefall in Gebäuden: 2017, Umweltbundesamt Dessau-Roßlau. https://bit.ly/2TUzFcu
- Messal C. Quantifizierende Mikroskopie von Oberflächenkontaktproben; Schützen & Erhalten. 2019.
- ASTM standard D7910-14: Practice for the Collection of Fungal Material from Surfaces by Tape Lift. ASTM 2014. https://bit.ly/3d3JR94
- Meider J, Wagner A, Eickner S, Messal C. Happy Taping for Dummies - Microscopy of Surface Contact Samples - how comparable and meaningful are these samples at all? Deutscher Schimmelpilztag. Neuss. 2020.
Content Alerts
SignUp to our
Content alerts.
 This work is licensed under a Creative Commons Attribution 4.0 International License.


