> Medicine Group. 2020 Nov 30;2(1):363-371. doi: 10.37871/jbres1167.
Association of Serum Ferritin and Inflammatory Biomarkers with Insulin Resistance in Chinese Type 2 Diabetes Mellitus Patients
Pratiksha Paudel1,2#, Shitian Zhang1#, Bei Guo1, Alisha Pannu1,2, Gajarishiyan Rasalingam1,2, Ranjita Sah1,2, Bharvi Desai1,2, Aili Yin1, Chunmei Gu3, Yuhua Yuan3, Liming Chen1 and Wenyan Niu1#*
2International Medical School, Tianjin Medical University, Tianjin, China 300070
3Tianjin General Hospital, Tianjin, China 300052
#These authors contributed equally to the manuscript
- Ferritin
- Inflammation
- Insulin resistance
- Obesity
- Type 2 diabetes mellitus
Objective: Obesity-induced Insulin Resistance (IR) is one of the main causes of Type 2 Diabetes Mellitus (T2DM) and accompanies the progression of T2DM. Serum Ferritin has been shown to be associated with IR. Inflammation is also suggested to be involved in IR and pancreatic β-cell dysfunction. However, there is lack of enough evidence concerning the interrelationship between serum Ferritin, inflammation, and IR in the Chinese population with T2DM. In this study, the relationships between serum Ferritin and inflammatory biomarkers with IR in Chinese population were investigated.
Methods: This cross-sectional study was conducted with 207 Chinese participants, aged 40-60 years in Tianjin, China. Serum Ferritin, transferrin, and folate were measured by immuno-assay analyzer. The levels of TNF-α, IL-1β, and IL-6 were detected by ELISA. IR was evaluated by Homeostasis model assessment (HOMA) of IR. Correlations were examined by regression analyses.
Results: Serum Ferritin level was higher in non-diabetic obese and diabetic group than the non-diabetic lean group. The levels of TNF-α and CRP were significantly higher in the diabetic obese group than non-diabetic and diabetic lean subjects. Serum Ferritin, TNF-α, and CRP were all correlated with BMI. TNF-α correlated with IR and FPI. TNF-α, IL-6, IL-1β, and CRP were all correlated with FPG and HbA1c.
Conclusion: In Chinese population, IR had a significant association with TNF-α but not with serum Ferritin. Serum Ferritin, TNF-α, and CRP were all correlated with BMI. Inflammation and glucose metabolism factors (FPG, HbA1c) showed a strong correlation with each other as well as with adiposity.
IR: Insulin Resistance; T2DM: Type 2 Diabetes Mellitus; FPG: Fasting Plasma Glucose; HbA1c: Glycated Haemoglobin; FPI: Fasting Plasma Insulin; HOMA-IR: Homeostasis Model Assessment of Insulin Resistance; TNF-Α: Tumour Necrosis Factor-Α; IL-6: Interlukin-6; IL-1β: Interlukin-1β; CRP: C-Reactive Protein
Due to rapid economic growth and significant alterations in dietary habits, China now houses the largest population suffering from Type 2 Diabetes Mellitus (T2DM) [1]. WHO reported that around 110 million Chinese suffered from T2DM in 2016, which is projected to increase up to 150 million by 2040 [2]. Around half of the country’s population (i.e. 500 million) currently lives with pre-diabetes, placing them at a risk of developing T2DM and related chronic disorders such as cardiovascular diseases [2].
T2DM is a group of chronic metabolic disorders characterized by abnormally increased levels of blood glucose for a prolonged period due to impaired insulin secretion and/or action. One of the commonly observed complex and multi-factorial pathogenic features of T2DM is Insulin Resistance (IR). IR is a pathological condition in which the cells do not respond appropriately to the hormone insulin. Alleviated cell sensitivity to insulin leads to inadequate absorption and ineffective utilization of glucose, resulting in hyperglycaemia. Meanwhile, pancreatic β-cells secrete more insulin as a compensatory mechanism, leading to hyperinsulinemia. Eventually, the β-cells become exhausted and produce less insulin. Several studies suggested multiple possible links between obesity and IR, depicting obesity as one of the most common causes of IR. Hence, the obesity-induced IR is central to the development of T2DM. And in China, as much as in the rest of the world, the obesity epidemic is growing at an alarming rate.
It has been suggested that the body iron status influences IR and β-cell function. Serum Ferritin is an acute phase iron storage protein [3] which is elevated in acute or chronic inflammatory states such as T2DM [4]. Inflammatory cytokines such as TNF-α, IL-1β, and IL-6 induce Ferritin expression [5]. T2DM is associated with chronic low-grade inflammation, resulting partially from the release of pro-inflammatory biomarkers such as TNF-α, IL-1β, and IL-6 [6] which could potentially disrupt insulin homeostasis and action.
In Caucasian population, several studies have demonstrated a strong interplay among multiple factors such as increased serum Ferritin, obesity, inflammation, and IR that could lead to the development of T2DM. Albeit, there is limited evidence of such an association amongst the Chinese population. Owing to the significant difference in the genetic makeup, dietary habits, and ethnicity between the Chinese and Caucasian population, the current study aims to investigate the association between serum Ferritin, inflammatory status, and IR in Chinese T2DM population.
Study population
We enrolled 207 Chinese individuals, aged 40-60 years, of which 98 subjects were diabetic and 109 subjects were non-diabetic. Diabetic subjects were recruited from Tianjin Medical University Metabolic Disease Hospital who underwent routine medical examinations. T2DM was diagnosed using the World Health Organization’s criteria in 1999 i.e., Fasting Plasma Glucose (FPG) concentration ≥ 7.0mmol/L (126 mg/dl) or plasma glucose concentration ≥ 11.1mmol/L (200mg/dl) after a 75gm oral glucose load. Non-diabetic volunteers with no family history of diabetes mellitus were recruited from Tianjin Medical University General Hospital who underwent regular physical examinations. Both diabetic and non-diabetic subjects were further sub-grouped into lean and obese groups. Obesity was defined as BMI ≥ 24kg/m2. Subjects with impaired fasting glucose and impaired glucose tolerance were excluded from the non-diabetics based on FPG and Glycated Haemoglobin (HbA1c). Additionally, subjects with acute infections or any systematic inflammation were excluded from this study. All experimental procedures were performed in accordance with the principles of the Declaration of Helsinki and later amendments. The Ethics Committee of Tianjin Medical University approved the protocol of the current study. Informed consent was obtained from all volunteers taking part in the current study.
Anthropometric measurements
Anthropometric parameters, including height and weight, were recorded using a standard protocol. Body Mass Index (BMI) was calculated as weight in kilograms divided by squared height in meters. The Homeostasis Model Assessment (HOMA) index was calculated for each individual as HOMA-IR= (Fasting plasma insulin (mIU/L) x fasting plasma glucose (mmol/L))/22.5.
Visceral fat level, visceral fat area, visceral fat content and subcutaneous fat content were measured by a type-B ultrasonic instrument.
Laboratory measurements
All venous blood samples were collected after 8 h fasting period. FPG, Total Glyceride (TG), Total Cholesterol (TC), LOW-DENSITY LIPOPROTEIN (LDL), and High-Density Lipoprotein (HDL) were analyzed using colorimetric analysis on automated biochemical analyzer (Roche). HbA1c was assayed using high performance liquid phase ion exchange chromatography on automated glyco-hemoglobin analyzer (Tosoh). Fasting insulin was detected by electro chemiluminescence immunoassay on immunoassay analyser (Roche). Fasting plasma Ferritin, transferrin, and folate were measured by chemiluminescence immunoassay on immunoassay analyzer (Beckman).
Cytokine measurements
Serum TNF-α, IL-1β, and IL-6 were measured using ELISA kits (CUSABIO) following manufacturer’s instructions. CRP was measured by the immune assay with a Roche Cobas c701 automatic analyzer.
Statistical analysis
Analyses were performed using Prism 6.0 software (Graph Pad software, San Diego, CA) with statistical significance set at p < 0.05. All values were represented as mean ± SE. Two groups were compared using the Student’s t-test, and more than two groups were compared using ANOVA with Tukey’s post hoc analysis. Correlation analyses between two parameters were performed using linear regression.
The basic and clinical characteristics of the subjects are shown in table 1.
Glucose and lipid metabolism profiles
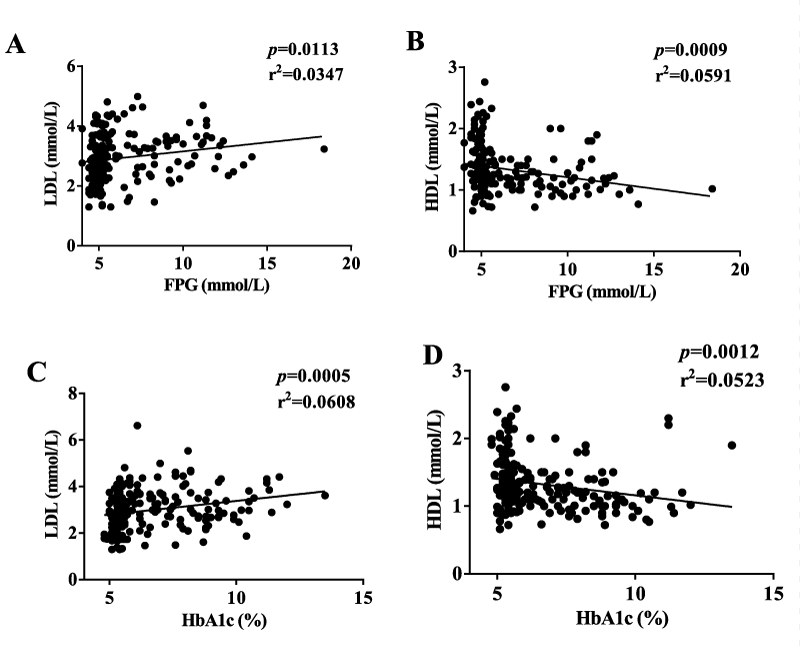
As expected, FPG and HbA1c were significantly higher in diabetic subjects than non-diabetic subjects. TG, TC, and LDL in lean group were significantly lower, whereas HDL was higher than that in obese and diabetic groups (Table 1). TG, TC, LDL, and HDL were all correlated with BMI. TG and HDL were correlated with adiposity in the diabetic group. LDL and HDL were correlated with FPG and HbA1c in all the groups (Supplementary figure 1). As anticipated, fat analysis data showed significant increment in diabetic obese group than diabetic lean group (Table 2). HbA1c had marked correlation with adiposity in the diabetic group (Data not shown).
| Table 1: Basic and clinical characteristics of the subjects. | ||||
| Variable | Non-diabetic | Diabetic | ||
| Lean | Obese | Lean | Obese | |
| Basic characteristics | ||||
| Sex (male/female) | 21/19 | 43/10 | 15/5 | 46/32 |
| Age(years) | 50.3 ± 0.72 | 50.5 ± 0.68**** | 52.9 ± 1.03* | 52.9 ± 0.67** |
| Weight(kg) | 59.6 ± 0.97 | 80.1 ± 1.46**** | 62.1 ± 1.64§** | 78.2 ± 1.29****‡‡ |
| Height(cm) | 168.0 ± 0.70 | 169.2 ± 1.09**** | 169.0 ± 1.51*** | 167.5 ± 0.91***‡*‡ |
| BMI(kg/m2) | 21.1 ± 0.26 | 28.0 ± 0.39**** | 21.7 ± 0.38§** | 27.8 ± 0.33****‡‡ |
| Glucose and lipid metabolism profiles | ||||
| FPG (mmol/L) | 4.9 ± 0.05 | 5.1 ± 0.05**** | 9.2 ± 0.79****§ | 8.2 ± 0.30****§‡ |
| FPI (mIU/L) | ND | ND | 9.1 ± 1.34****§ | 12.6 ± 1.33***§‡** |
| HOMA-IR | ND | ND | 3.3 ± 0.50****§ | 4.6 ± 0.70****§‡ |
| HbA1c (%) | 5.3 ± 0.03 | 5.5 ± 0.04**** | 9.0 ± 0.54****§ | 8.0 ± 0.16****§‡ |
| TG (mmol/L) | 0.9 ± 0.04 | 2.5 ± 0.18**** | 1.9 ± 0.26****§ | 2.3 ± 0.18****** |
| TC (mmol/L) | 4.5 ± 0.06 | 5.5 ± 0.11**** | 5.1 ± 0.24****§ | 5.1 ± 0.13****§‡ |
| LDL (mmol/L) | 2.4 ± 0.07 | 3.2 ± 0.11**** | 3.3 ± 0.17****§ | 3.2 ± 0.10**** |
| HDL (mmol/L) | 1.7 ± 0.05 | 1.2 ± 0.03**** | 1.4 ± 0.10****§ | 1.1 ± 0.03**** |
| Iron metabolism profile | ||||
| Ferritin (ng/ml) | 90.5 ± 10.11 | 171.1 ± 16.04** | 185.5 ± 32.72* | 145.7 ± 15.05* |
| Transferrin (gm/L) | 3.0 ± 0.09 | 2.8 ± 0.07 | 2.5 ± 0.08** | 2.6 ± 0.05*** |
| Folate (ng/ml) | 7.9 ± 0.55 | 7.5 ± 0.48 | 7.9 ± 0.79 | 8.1 ± 0.42* |
| Inflammatory biomarkers profile | ||||
| TNF-α (pg/ml) | 40.2 ± 5.22* | 43.3 ± 4.88* | 50.5 ± 5.24**** | 83.7 ± 6.49****§‡* |
| IL-6 (pg/ml) | -1.4 ± 0.23* | -0.5 ± 0.26* | 6.9 ± 2.29****§ | 6.5 ± 1.39****§* |
| IL-1β (pg/ml) | 256.5 ± 28.92 | 282.1 ± 39.06* | 1945.6 ± 311.60****§* | 1820.0 ± 208.04****§** |
| CRP (mg/L) | 0.8 ± 0.12 | 1.2 ± 0.16 | 1.6 ± 0.58*** | 2.9 ± 0.35***† † |
| Vs. Lean: *p < 0.05; **p < 0.01; ***p < 0.001; ****p < 0.0001 Vs. Obese: †p < 0.05; † † p < 0.01; † † † p < 0.001; §p < 0.0001 Vs. T2DM Lean: ‡ p < 0.01; ‡ ‡ p < 0.0001 Data are presented as means ± SE. |
||||
| Table 2: Body fat analysis of diabetic subjects. | ||
| Variable | Diabetic | |
| Lean | Obese | |
| Visceral fat level | 8.0 ± 0.65 | 12.1 ± 0.29‡‡ |
| Visceral fat area (cm2) | 71.6 ± 6.90 | 115.7 ± 4.51‡‡ |
| WHR | 0.8 ± 0.02 | 0.9 ± 0.01‡‡ |
| Visceral fat content (kg) | 1.5 ± 0.09 | 3.1 ± 0.14‡‡ |
| Subcutaneous fat content (kg) | 11.0 ± 0.54 | 18.9 ± 0.57‡‡ |
| Vs. T2DM Lean: ‡‡ p < 0.0001 Data are presented as means ± SE. WHR: Waist-Hip Ratio; ND: Not Detected |
||
Iron metabolism profile
Serum Ferritin levels were significantly higher in obese and diabetic groups than that in non-diabetic lean group. Transferrin level in non-diabetic lean group was significantly lower than that in diabetic groups. Folate concentration showed no significant difference among these groups (Table 1). Serum Ferritin correlated well with BMI, whereas transferrin was correlated with FPG and HbA1c (Figure 1).
Inflammatory biomarkers
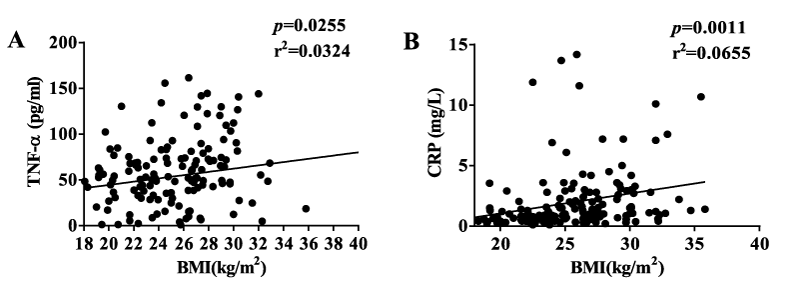
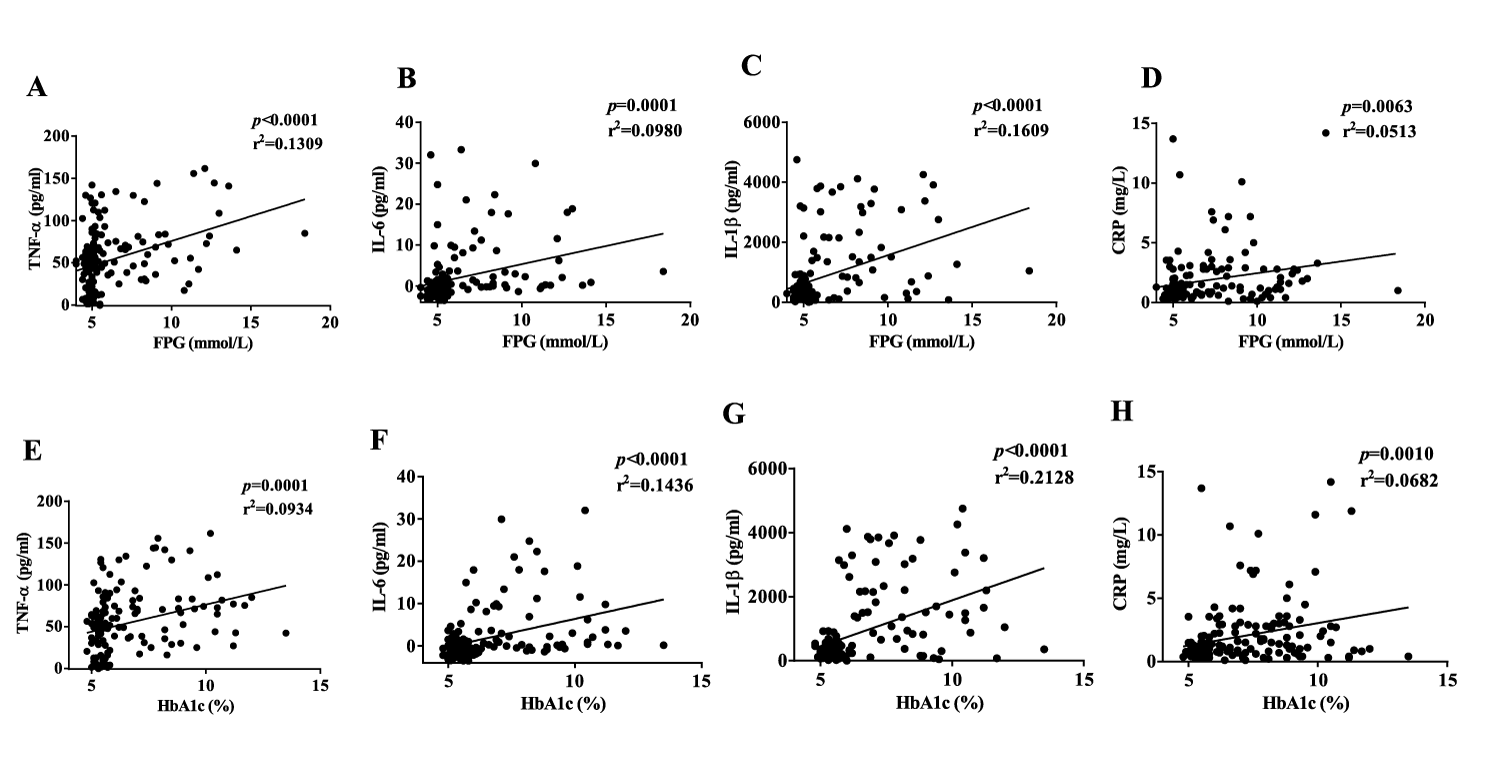
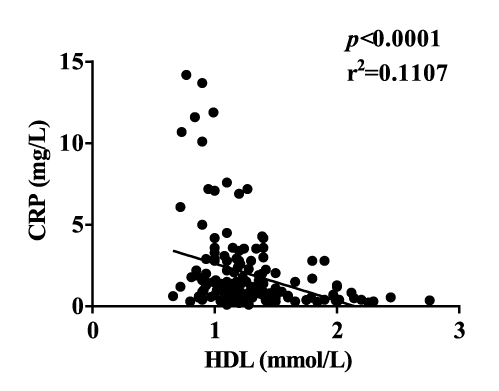
Diabetic obese subjects had significantly more TNF-α than diabetic lean and non-diabetic subjects. IL-6 and IL-1β showed a significant increase in the diabetic groups than in the non-diabetic groups. CRP increased significantly in diabetic obese group as compared to the non-diabetic groups (Table 1). TNF-α and CRP, but not IL-6 and IL-1β, were correlated with BMI (Figure 2). This may be because the mean BMI was less than 30 kg/m² in the obese groups. TNF-α, IL-6, IL-1β, and CRP were all correlated with FPG and HbA1c (Figure 3). IL-6 and IL-1β were strongly correlated with diabetes. These suggested that inflammation is one of the key findings in Chinese diabetic patients. Additionally, CRP showed a correlation with HDL (Supplementary figure 2). TNF-α correlated well with visceral fat level, and both TNF-α and CRP correlated well with subcutaneous fat content in the diabetic group (Supplementary figure 3). Taken together, our results showed that inflammation has a much stronger correlation with T2DM than with obesity in Chinese population.
Relationship with IR
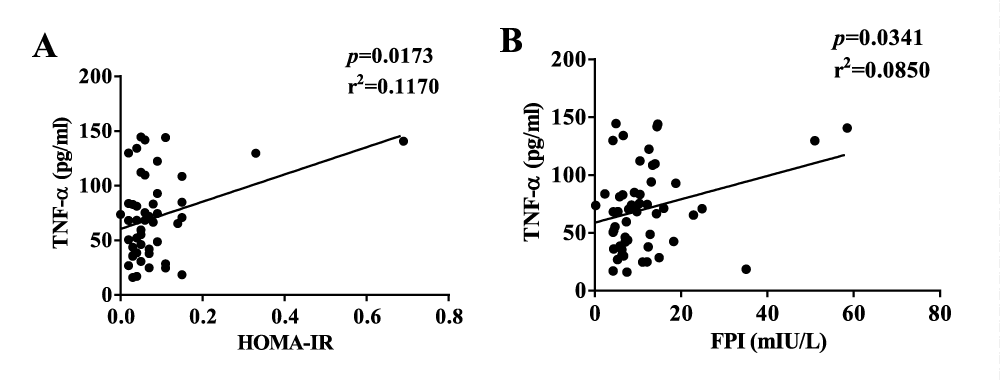
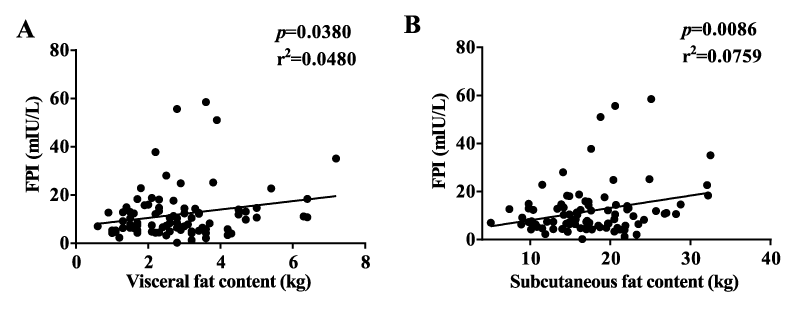
Our results showed no correlation between lipid profile, FPI, and HOMA-IR. TNF-α had a strong correlation with both FPI and HOMA-IR (Figure 4). However, IL-6, IL-1β, and CRP had no such correlation. Serum Ferritin and transferrin had no significant correlation with FPI and HOMA-IR. FPI correlated well with visceral and subcutaneous fat contents in the diabetic group. (Supplementary figure 4).
T2DM is one of the most common causes of mortality and its risk factors are the focus in the field of diabetes research. Serum Ferritin, an expression of body iron stores, is one such factor that is being studied extensively. Serum Ferritin is an acute phase reactant [3]. The level of Ferritin increases in acute and/or chronic inflammatory situations including T2DM, given that a low-grade inflammatory status is observed in T2DM patients [7,8]. Studies have also shown that iron overload generated dysfunction of insulin action, contributing to IR. In recent days, several studies have found a significant relationship among increased serum Ferritin, T2DM, IR as well as other metabolic syndromes [9-14].
In our study, serum Ferritin was significantly lower in lean subjects than obese and diabetic subjects, and a strong correlation between serum Ferritin and BMI was observed. These findings are consistent with previous research [15,16]. Likewise, serum transferrin had a marked correlation with FPG and HbA1c that reflects the existent role of body iron in glucose metabolism. However, we did not find any significant correlation between serum Ferritin, glucose metabolism, and IR. This is in contrast with the studies in the western countries [12,17,18], which showed significant association. This distinctness might be attributable to the existing differences in genetic makeup, dietary habits, lifestyles, and ethnicities between the Western and Chinese population. Moreover, the average BMI of the obese participants in our study was low (< 30 kg/m2) compared to the western population. On the other hand, several studies conducted in mainland China and neighboring Asian countries have also shown a significant relationship between increased serum Ferritin, IR and T2DM [19-23]. The study conducted by Chen, et al. concluded an independent association of serum Ferritin with IR and Metabolic syndromes [19] and the study by Ma et al showed that serum Ferritin levels are associated with insulin resistance in Chinese men and post-menopausal women [23]. Likewise, a recent Korean study also found a significant correlation between iron stores, IR and abdominal obesity [16]. It must be noted that most of these studies were conducted with a large sample size [9,11,12,16,19], while the studies with no significant correlation had a smaller sample size [24,25]. Therefore, a small sample size could have instilled a lesser statistical power while investigating the relationship between serum Ferritin and IR in our study. In addition, none of our participants were newly diagnosed with T2DM and were being treated with anti-hyperglycemic drugs. This might also have confounded the results of our study, as these drugs were found to affect IR and influence the absorption as well as metabolism of iron at the level of hepatocytes [26]. However, notwithstanding the small sample size, some of these previous studies have found a significant correlation [20,27]. So, further research is needed to illustrate the effects of sample size, diabetic disease course, and anti-hyperglycemic medications while demonstrating this relationship.
Even though the exact mechanisms behind the associations of serum Ferritin, IR and T2DM are not known yet, various possible pathways have been postulated. Firstly, the pro-oxidation potency of iron enables it to catalyze multiple reactions, giving rise to reactive oxygen species and elevated oxidative stress [28]. The latter may interfere in the cellular insulin-signalling [29]. Likewise, elevated oxidative stress may cause tissue damage and might contribute to hyperglycaemia as well [30,31]. Secondly, increased iron stores in pancreatic β-cells and liver may result in IR, which leads to the impediment of hepatic and muscle insulin extraction, resulting in hyperinsulinemia [32,33]. The latter results in impaired suppression of hepatic glucose production and impaired peripheral glucose disposition. Therefore, serum Ferritin, hyperinsulinemia and IR are suggested to be biologically interwoven [34]. Finally, elevated serum Ferritin concentration may act as a positive marker of inflammation, which plays a major role in the development of IR and T2DM [12]. Alternatively, serum Ferritin elevation in T2DM has also been accredited to inflammatory mechanisms rather than iron overload [35]. Moreover, obesity-related inflammation plays an important role in the incidence of IR as well as the development, progression, and complications of T2DM. The potential biochemical mechanism inherent to this affiliation includes two transcription factor signal pathways: The NF-κB pathway and the c-Jun NH2-Terminal Kinase (JNK) pathway. Both of these pathways are activated by 1) several pro-inflammatory cytokines, for e.g., TNF-α, which not only are the activators of NF-κB, but also are its regulated products, and 2) by pattern recognition receptors, for instance, the receptor for AGEs and the Toll-like receptors. Endoplasmic reticulum stress, ceramides, and reactive oxygen species are elevated by adiposity, and all have, likewise, been appeared to activate both JNK and NF-κB [36-38]. Multiple studies have discovered a significant correlation among IR, T2DM and pro-inflammatory biomarkers such as TNF-α [26,38], CRP, IL-6, and IL-1β [39-41]. Consistent with previous studies, we observed a significant correlation between TNF-α and IR. While CRP and TNF-α correlated well with BMI and obesity, no such correlation was observed in the case of IL-1β and IL-6. All of these inflammation markers increased in the case of diabetic populations and showed a significant correlation with glucose homeostasis factors (FPG, HbA1c), indicating a significantly strong association of inflammation with T2DM. However, we found no significant relationship of IR with CRP, IL-1β and IL-6. Likewise, no significant association was seen between serum Ferritin and above-mentioned inflammatory markers. The number of our participants, diet, lifestyle, and other potential confounding factors could be accountable for this inability to detect the significance in the association among the above-mentioned variables. Among other findings, we found a significant correlation between lipid profile data and BMI, while TG and HDL also correlated with adiposity in diabetic subjects. Additionally, LDL and HDL correlated well with FPG and HbA1c, and HbA1c showed a correlation with adiposity. These results indicated the strong affiliation between lipid profile, adiposity, and glucose homeostasis.
The strength of our study is that the study design included both non-diabetic and diabetic subjects, which were further divided into lean and obese based on their BMI and lipid profile. This helped us to compare and analyze the similarities and differences among them even more specifically. Readily accessible fasting serum was another advantage for us. The adjustment of analyses for a wide range of conventional as well as newer diabetes risk factors and iron marker related factors was another benefit. Furthermore, the efficacy of our results was assessed by several sensitivity analyses. Conversely, the cross-sectional nature of this study limited our ability to investigate causalities. In addition, as mentioned earlier, a rather small sample size could have hindered the possible outcome. The patterns of dietary intake of micronutrients, especially iron, were not taken into consideration. Furthermore, the effects of lifestyle changes and/or the anti-diabetic drugs, as a part of the treatment regimen, on iron concentrations cannot be ignored, as these actions were seen to be beneficial in the improvement of IR and prevention of T2DM [36].
In summary, our findings of a strong presence of inflammatory biomarkers in T2DM and the correlation between TNF-α and HOMA-IR further strengthened the proposed association of inflammation and T2DM. Likewise, the association of inflammatory cytokines and increased serum Ferritin with obesity observed in our study has important public health implications, as the global community battles obesity which has given rise to the array of debilitating health hazards. As our results don’t favor a correlation between increased serum Ferritin and IR in T2DM, this observation is in line with few small-scale studies, whereas, it contradicts with the results of other large population-based studies. Further research, preferably large community based prospective studies, must be carried out to illustrate the mechanism and confirm the significance of these findings while taking the limitations of this study into consideration. Additionally, population-based longitudinal studies are warranted to infer the causalities involved in the association of serum Ferritin, inflammation, and IR in the case of the Chinese population.
We would like to thank Mr. Paulos N Alemu for the help with the project design and Mr. Kunal Kaushik for editorial assistance. This work was supported by grants from National Natural Science Foundation of China (Grant No. 81670731, 81170740 and 81161120545), the Tianjin Municipal Science and Technology Commission (Grant No. 15JCZDJC35500) and the Tianjin Health and Family Planning Commission (Grant No. 15KG102) to Niu W, Chen L was supported by the Tianjin Municipal Science and Technology Commission (#15ZXHLSY00460). Zhang S, was supported by the Science & Technology Development Fund of Tianjin Education Commission for Higher Education (Grant No. 2017KJ212).
- Saeedi P, Petersohn I, Salpea P, Malanda B, Karuranga S, Unwin N, Colagiuri S, Guariguata L, Motala AA, Ogurtsova K, Shaw JE, Bright D, Williams R; IDF Diabetes Atlas Committee. Global and regional diabetes prevalence estimates for 2019 and projections for 2030 and 2045: Results from the International Diabetes Federation Diabetes Atlas, 9th edition. Diabetes Res Clin Pract. 2019 Nov;157:107843. doi: 10.1016/j.diabres.2019.107843. Epub 2019 Sep 10. PMID: 31518657.
- Rate of diabetes in China “explosive”. https://bit.ly/3of9WFr
- Gabay C, Kushner I. Acute-phase proteins and other systemic responses to inflammation. N Engl J Med. 1999 Feb 11;340(6):448-54. doi: 10.1056/NEJM199902113400607. Erratum in: N Engl J Med 1999 Apr 29;340(17):1376. PMID: 9971870.
- Yeap BB, Divitini ML, Gunton JE, Olynyk JK, Beilby JP, McQuillan B, Hung J, Knuiman MW. Higher ferritin levels, but not serum iron or transferrin saturation, are associated with Type 2 diabetes mellitus in adult men and women free of genetic haemochromatosis. Clin Endocrinol (Oxf). 2015 Apr;82(4):525-32. doi: 10.1111/cen.12529. Epub 2014 Jul 23. PMID: 24953981.
- You SA, Wang Q. Ferritin in atherosclerosis. Clin Chim Acta. 2005 Jul 1;357(1):1-16. doi: 10.1016/j.cccn.2005.02.001. Epub 2005 Mar 23. PMID: 15963791.
- Pickup JC. Inflammation and activated innate immunity in the pathogenesis of type 2 diabetes. Diabetes Care. 2004 Mar;27(3):813-23. doi: 10.2337/diacare.27.3.813. PMID: 14988310.
- Visser M, Bouter LM, McQuillan GM, Wener MH, Harris TB. Elevated C-reactive protein levels in overweight and obese adults. JAMA. 1999 Dec 8;282(22):2131-5. doi: 10.1001/jama.282.22.2131. PMID: 10591334.
- Fernández-Real JM, Ricart W. Insulin resistance and chronic cardiovascular inflammatory syndrome. Endocr Rev. 2003 Jun;24(3):278-301. doi: 10.1210/er.2002-0010. PMID: 12788800.
- Akter S, Nanri A, Kuwahara K, Matsushita Y, Nakagawa T, Konishi M, Honda T, Yamamoto S, Hayashi T, Noda M, Mizoue T. Circulating ferritin concentrations and risk of type 2 diabetes in Japanese individuals. J Diabetes Investig. 2017 Jul;8(4):462-470. doi: 10.1111/jdi.12617. Epub 2017 Mar 6. PMID: 28060459; PMCID: PMC5497053.
- Wlazlo N, van Greevenbroek MM, Ferreira I, Jansen EH, Feskens EJ, van der Kallen CJ, Schalkwijk CG, Bravenboer B, Stehouwer CD. Iron metabolism is prospectively associated with insulin resistance and glucose intolerance over a 7-year follow-up period: the CODAM study. Acta Diabetol. 2015 Apr;52(2):337-48. doi: 10.1007/s00592-014-0646-3. Epub 2014 Oct 1. PMID: 25267079.
- Arija V, Fernández-Cao JC, Basora J, Bulló M, Aranda N, Estruch R, Martínez-González MA, Salas-Salvadó J. Excess body iron and the risk of type 2 diabetes mellitus: a nested case-control in the PREDIMED (PREvention with MEDiterranean Diet) study. Br J Nutr. 2014 Dec 14;112(11):1896-904. doi: 10.1017/S0007114514002852. Epub 2014 Oct 17. PMID: 25322842.
- Huth C, Beuerle S, Zierer A, Heier M, Herder C, Kaiser T, Koenig W, Kronenberg F, Oexle K, Rathmann W, Roden M, Schwab S, Seissler J, Stöckl D, Meisinger C, Peters A, Thorand B. Biomarkers of iron metabolism are independently associated with impaired glucose metabolism and type 2 diabetes: the KORA F4 study. Eur J Endocrinol. 2015 Nov;173(5):643-53. doi: 10.1530/EJE-15-0631. Epub 2015 Aug 20. PMID: 26294793.
- Wang YL, Koh WP, Yuan JM, Pan A. Plasma ferritin, C-reactive protein, and risk of incident type 2 diabetes in Singapore Chinese men and women. Diabetes Res Clin Pract. 2017 Jun;128:109-118. doi: 10.1016/j.diabres.2017.04.012. Epub 2017 Apr 13. PMID: 28448891.
- El Ebrashy I, Shaker O, Abdelgalil S, et al. Investigation of association of biomarkers of iron metabolism and insulin resistance in Egyptian patients with impaired glucose metabolism and type 2 diabetes[J]. The Egyptian Journal of Internal Medicine, 2019, 31(4):874-883. https://bit.ly/37spNK4
- Wrede CE, Buettner R, Bollheimer LC, Schölmerich J, Palitzsch KD, Hellerbrand C. Association between serum ferritin and the insulin resistance syndrome in a representative population. Eur J Endocrinol. 2006 Feb;154(2):333-40. doi: 10.1530/eje.1.02083. PMID: 16452549.
- Shim YS, Kang MJ, Oh YJ, Baek JW, Yang S, Hwang IT. Association of serum ferritin with insulin resistance, abdominal obesity, and metabolic syndrome in Korean adolescent and adults: The Korean National Health and Nutrition Examination Survey, 2008 to 2011. Medicine (Baltimore). 2017 Feb;96(8):e6179. doi: 10.1097/MD.0000000000006179. PMID: 28225503; PMCID: PMC5569419.
- Kim CH, Kim HK, Bae SJ, Park JY, Lee KU. Association of elevated serum ferritin concentration with insulin resistance and impaired glucose metabolism in Korean men and women. Metabolism. 2011 Mar;60(3):414-20. doi: 10.1016/j.metabol.2010.03.007. Epub 2010 Apr 27. PMID: 20423745.
- Juanola-Falgarona M, Cándido-Fernández J, Salas-Salvadó J, Martínez-González MA, Estruch R, Fiol M, Arija-Val V; Mònica Bulló; PREDIMED Study Investigators. Association between serum ferritin and osteocalcin as a potential mechanism explaining the iron-induced insulin resistance. PLoS One. 2013 Oct 22;8(10):e76433. doi: 10.1371/journal.pone.0076433. PMID: 24167545; PMCID: PMC3805539.
- Chen L, Li Y, Zhang F, Zhang S, Zhou X, Ji L. Association of serum ferritin levels with metabolic syndrome and insulin resistance in a Chinese population. J Diabetes Complications. 2017 Feb;31(2):364-368. doi: 10.1016/j.jdiacomp.2016.06.018. Epub 2016 Jun 23. PMID: 27426616.
- Liu BW, Xuan XM, Liu JR, Li FN, Yin FZ. The Relationship between Serum Ferritin and Insulin Resistance in Different Glucose Metabolism in Nonobese Han Adults. Int J Endocrinol. 2015;2015:642194. doi: 10.1155/2015/642194. Epub 2015 Aug 19. PMID: 26357514; PMCID: PMC4556820.
- Li J, Wang R, Luo D, Li S, Xiao C. Association between serum ferritin levels and risk of the metabolic syndrome in Chinese adults: a population study. PLoS One. 2013 Sep 16;8(9):e74168. doi: 10.1371/journal.pone.0074168. PMID: 24066115; PMCID: PMC3774625.
- Sun L, Franco OH, Hu FB, Cai L, Yu Z, Li H, Ye X, Qi Q, Wang J, Pan A, Liu Y, Lin X. Ferritin concentrations, metabolic syndrome, and type 2 diabetes in middle-aged and elderly chinese. J Clin Endocrinol Metab. 2008 Dec;93(12):4690-6. doi: 10.1210/jc.2008-1159. Epub 2008 Sep 16. PMID: 18796516.
- Ma H, Lin H, Hu Y, Li X, He W, Jin X, Gao J, Zhao N, Pan B, Gao X. Serum ferritin levels are associated with insulin resistance in Chinese men and post-menopausal women: the Shanghai Changfeng study. Br J Nutr. 2018 Oct;120(8):863-871. doi: 10.1017/S0007114518002167. Epub 2018 Sep 7. PMID: 30189905.
- Gupta M, Palta A, Singh R, Lehl SS. Body iron stores in middle-aged North Indian patients with type 2 diabetes and obesity. J Midlife Health. 2014 Apr;5(2):72-7. doi: 10.4103/0976-7800.133991. PMID: 24970985; PMCID: PMC4071648.
- Zafar U, Qureshi HJ, Imran M. COMPARISON OF IRON STATUS AND INSULIN RESISTANCE BETWEEN NON-DIABETIC OFFSPRINGS OF TYPE 2 DIABETICS AND NON-DIABETICS. J Ayub Med Coll Abbottabad. 2015 Apr-Jun;27(2):307-11. PMID: 26411103.
- Hajiaghamohammadi AA, Ziaee A, Oveisi S, Masroor H. Effects of metformin, pioglitazone, and silymarin treatment on non-alcoholic Fatty liver disease: a randomized controlled pilot study. Hepat Mon. 2012 Aug;12(8):e6099. doi: 10.5812/hepatmon.6099. Epub 2012 Aug 3. PMID: 23087748; PMCID: PMC3475019.
- Ashourpour M, Djalali M, Djazayery A, Eshraghian MR, Taghdir M, Saedisomeolia A. Relationship between serum ferritin and inflammatory biomarkers with insulin resistance in a Persian population with type 2 diabetes and healthy people. Int J Food Sci Nutr. 2010 May;61(3):316-23. doi: 10.3109/09637480903555150. PMID: 20113186.
- Wolff SP. Diabetes mellitus and free radicals. Free radicals, transition metals and oxidative stress in the aetiology of diabetes mellitus and complications. Br Med Bull. 1993 Jul;49(3):642-52. doi: 10.1093/oxfordjournals.bmb.a072637. PMID: 8221029.
- Messner DJ, Rhieu BH, Kowdley KV. Iron overload causes oxidative stress and impaired insulin signaling in AML-12 hepatocytes. Dig Dis Sci. 2013 Jul;58(7):1899-908. doi: 10.1007/s10620-013-2648-3. Epub 2013 Apr 5. PMID: 23558563; PMCID: PMC3700657.
- Choi SW, Benzie IF, Ma SW, Strain JJ, Hannigan BM. Acute hyperglycemia and oxidative stress: direct cause and effect? Free Radic Biol Med. 2008 Apr 1;44(7):1217-31. doi: 10.1016/j.freeradbiomed.2007.12.005. Epub 2007 Dec 15. PMID: 18226604.
- Emerit J, Beaumont C, Trivin F. Iron metabolism, free radicals, and oxidative injury. Biomed Pharmacother. 2001 Jul;55(6):333-9. doi: 10.1016/s0753-3322(01)00068-3. PMID: 11478586.
- Ferrannini E. Insulin resistance, iron, and the liver. Lancet. 2000 Jun 24;355(9222):2181-2. doi: 10.1016/S0140-6736(00)02397-7. PMID: 10881887.
- Niederau C, Berger M, Stremmel W, Starke A, Strohmeyer G, Ebert R, Siegel E, Creutzfeldt W. Hyperinsulinaemia in non-cirrhotic haemochromatosis: impaired hepatic insulin degradation? Diabetologia. 1984 Jun;26(6):441-4. doi: 10.1007/BF00262217. PMID: 6381191.
- Mascitelli L, Pezzetta F, Goldstein MR. Hyperinsulinaemia and iron perturbation in patients with type 2 diabetes. Int J Clin Pract. 2009 Apr;63(4):672. doi: 10.1111/j.1742-1241.2008.01983.x. PMID: 19335710.
- Lecube A, Hernández C, Pelegrí D, Simó R. Factors accounting for high ferritin levels in obesity. Int J Obes (Lond). 2008 Nov;32(11):1665-9. doi: 10.1038/ijo.2008.154. Epub 2008 Sep 9. PMID: 18779821.
- Furukawa S, Fujita T, Shimabukuro M, Iwaki M, Yamada Y, Nakajima Y, Nakayama O, Makishima M, Matsuda M, Shimomura I. Increased oxidative stress in obesity and its impact on metabolic syndrome. J Clin Invest. 2004 Dec;114(12):1752-61. doi: 10.1172/JCI21625. PMID: 15599400; PMCID: PMC535065.
- Ozcan U, Cao Q, Yilmaz E, Lee AH, Iwakoshi NN, Ozdelen E, Tuncman G, Görgün C, Glimcher LH, Hotamisligil GS. Endoplasmic reticulum stress links obesity, insulin action, and type 2 diabetes. Science. 2004 Oct 15;306(5695):457-61. doi: 10.1126/science.1103160. PMID: 15486293.
- Summers SA. Ceramides in insulin resistance and lipotoxicity. Prog Lipid Res. 2006 Jan;45(1):42-72. doi: 10.1016/j.plipres.2005.11.002. Epub 2005 Dec 19. PMID: 16445986.
- Hotamisligil GS, Peraldi P, Budavari A, Ellis R, White MF, Spiegelman BM. IRS-1-mediated inhibition of insulin receptor tyrosine kinase activity in TNF-alpha- and obesity-induced insulin resistance. Science. 1996 Feb 2;271(5249):665-8. doi: 10.1126/science.271.5249.665. PMID: 8571133.
- Fumeron F, Péan F, Driss F, Balkau B, Tichet J, Marre M, Grandchamp B; Insulin Resistance Syndrome (DESIR) Study Group. Ferritin and transferrin are both predictive of the onset of hyperglycemia in men and women over 3 years: the data from an epidemiological study on the Insulin Resistance Syndrome (DESIR) study. Diabetes Care. 2006 Sep;29(9):2090-4. doi: 10.2337/dc06-0093. PMID: 16936158.
- Bertoni AG, Burke GL, Owusu JA, Carnethon MR, Vaidya D, Barr RG, Jenny NS, Ouyang P, Rotter JI. Inflammation and the incidence of type 2 diabetes: the Multi-Ethnic Study of Atherosclerosis (MESA). Diabetes Care. 2010 Apr;33(4):804-10. doi: 10.2337/dc09-1679. Epub 2010 Jan 22. PMID: 20097779; PMCID: PMC2845031.
Content Alerts
SignUp to our
Content alerts.
 This work is licensed under a Creative Commons Attribution 4.0 International License.


