> Biology Group. 2020 Nov 19;1(7):320-329. doi: 10.37871/jbres1162.
The Assembly of Bacteriophage Functional Enzymatic Models in Association with E. coli Proteins' Profiles
Ayman A Elshayeb1*, Amna Elfatih2, Karimeldin MA Salih3 and Nada SE Mustafa4
2University of Khartoum, Faculty of Science. Khartoum-Sudan
3Department of Paediatrics', Department of Medical Education, College of Medicine, University of Bisha, KSA
4Regional Directorate of Forensic Evidences, General Administration of Criminal Investigation, Khartoum-Sudan
- Bacteriophage
- Bioinformatics
- Enzymes
- Escherichia coli>
- Molecular weight
- Protein profile
Introduction: The invasion of bacteriophage on the associated host bacterium depends on their receptors' orientation that adsorb them to cell surface. During phage replication a valuable number of proteins acts as lytic enzymes for host puncher at the beginning of the infection and other for burst after lytic cycle compilation. Accordingly, the proteomic relationship among phage and bacterium proteins could easily be studied by their protein profiles analysis.
Objective: To detect bacteriophages functional enzymes during lytic cycle.
Methods: The isolation and identification of Escherichia coli and their parasitic T7 phage group was done using bacterial culture and common plaque assay techniques. The investigations and protein-protein interactions' assays were inveterate by proteins profile of phage and bacterium using Sodium Dodecyl Sulphate Poly Acrylamide Gel Electrophoresis (SDS-PAGE) to find out their molecular weights, where the scaled location of each mobile band was compared to the standards of identified proteins weights in the molecular ladder. Thereafter, Protein model's assembly and bands migration was done by computer analytical software.
Results: Mobilization of the phage' proteins inside the Two Dimensions (2D) gel ranged between 60 and 12 kDa where a model of 4 main bands with molecular weights of (46, 35, 24 and 14 kDa) is corresponded to the host ones, where pure 9 bands with molecular weight ranged between 96-24 kDa. The computational model analysis showed common shared molecular masses of 47, 34 and 16 kDa on plot area of the phage and the bacterium. Model interpretation confirmed that proteins ranged from 47.7 to 34.3 kDa resembles 43.3% of whole phage's proteins that assembled the capsid head and the coil, while the molecular weight mass of 22.5 formed the tail's proteins. The lytic enzymes' molecular weight was ranged between 18-14 kDa according to the function of the enzyme. The study revealed that the 34 kDa band has the common shared peak between T7 phage group and associated Escherichia coli host.
Conclusion: Functional models of analysed proteins during phage assembly, ensures lytic enzymes are built in the capsid head and the lysozyme in the tail, they facilitate the enzymatic decay for bacterial host. This enzymatic function is related to the lytic cycle of the bacteriophages and their phenomenon in employing the bacterial DNA in proteins manufacturing during their replication inside host.
Bioinformatics has provided valuable information in a variety of biological fields that enabled identification of novel components of biological macromolecules via the application of computational techniques to understand and organize the information associated with genomics and its translation into molecules of life-proteins [1-3]. Modern proteomics needs immense powers of resolution, sensitivity, and speed of identification, which so far can be reached through One and/or Two Dimension (1D, 2D) gels in combination with advanced analysis of complex protein distributions in automated fashions considering the large number of different protein interaction domains to provide important data sets [4,5]. Usually, the common technique used to investigate cell protein profiles is Sodium Dodecyl Sulphate-Polyacrylamide Gel Electrophoresis (SDS-PAGE), which contains separating proteins by isoelectric charge or molecular weight [6-9]. For a deep understanding of the relevant bacteriophages' proteins biology, this information must be integrated with analytical data from various ‘ bioinformatics levels' including DNA sequence, mRNA profiles, protein expression and metabolite concentrations as well as information about dynamic spatio-temporal changes in these molecules [10]. The generation of protein profiles to get the maximum possible distant gave biological information from related sequences by using alignment analytical and computational programs for the preparation of structural protein profiles of bacteriophages [11]. A protein profile of the phages provides additional information regarding the differences among the bacteriophages isolated and characterized [12,13]. Phages breaks down the bacterial DNA to recycle bacterial host genome for their own DNA synthesis during lytic cycle and hamper coexistence between phage and host. Such phages usually encode enzymes involved in nucleotide metabolism and the corresponding genes can be identified through sequence analysis [14]. The phage's tail allows its genome to be translocated into the host cell through internal head proteins that are ejected at the initiation of infection with transport of the leading end of the genome functioning lytic enzymes used by phages (Endolysins) at the end of the replication cycle to degrade bacterial peptidoglycan resulting in a rapid host lysis and the release of phage progeny [15-17]. Phage-associated lytic enzymes have been confirmed in many other bacterial phage-host systems and has been employed to control pathogenic bacteria [18-20]. The P5 protein from bacteriophage phi-6 has been revealed to be a lytic enzyme that cleaves the bacterial peptidoglycan (Murein) layer to facilitate membrane fusion during infection and is also responsible for cell lysis in late infection and was shown to be active against cell walls of various Gram-negative species [21-23]. Depending on the molecular marker which was used for the protein separation process, the molecular weight of lytic enzymes was varied; 14-13 kDa for lysozyme, 16 kDa for the E. coli phage and the estimation of the molecular weight of the lysin was in excess of 100 kDa [24,25]. Two structural proteins were detected in phages, ranging from 41 to 44 kDa and from 48 to 51 kDa, as well as several major and minor proteins were also detected (66 and 14 kDa) and Av-05 (73, 60, 53, 34, 25, and 14 kDa). Bacteriophages of the Myoviridae family commonly show two major structural proteins ranging from 50 to 55 kDa, which are related to the major tail sheath proteins, whereas proteins with a molecular mass around 23-25 kDa are related to the capsid protein [26]. Proteins with a minor molecular mass (6-15 kDa) in phages from the Myoviridae family have been previously reported; however, no specific function has been determined [27-29]. Enzymatic functional reactions usually. Depend on the enzyme targeted substrate. Moreover, reactions are rapid and sensitive. Therefore, the opportunity of detecting and computing bacteria species through specific enzymatic functional model activities has been under study for many years now [30-32].
General objective
To detect bacteriophages functional enzymes during lytic cycle.
Specific objectives
Isolation and identifications of bacteriophages and E. coli (host) enzymes and proteins.
Build computational model of phage functional enzymes using analytical software.
Phages and bacteria isolation and purification
Bacteriophages and their allied bacteria samples were harvested by using common plaque assay and bacterial loan cultures purification techniques for Escherichia coli.
Samples processed by SDS-PAGE for protein separation
Bacteriophage T7 and corresponding Escherichia coli, cells were. Centrifugated for 3-5 minutes at 15,000 rpm, supernatants were removed and the precipitations were filtered through Millipore filter with a pore size of 0.45 µm (HiMedia Laboratories) and stored at -50°C. Afterward, microorganisms' proteins were crushed by glass rod and homogenized in sterilized distilled water in volume 15 times less than their original volume. To find out the presence of the proteins in selected samples, same volumes of the resulted precipitation was dry freeze to absorb all moister and avoid contamination, kill all microorganisms and keep samples in room temperature in with silica gel granules. The final samples' weight resolved by electrophoresis through SDS-polyacrylamide (12 ± 5% protein assay by HiMedia Laboratories), using methods modified from Laemmli [33]. In this protocol, proteins were denatured and covered with detergent by boiling in the presence of SDS and a reducing agent. Finally, samples were stained with Coomassie blue for visualization. Molecular weight markers (ladders) were included in all gels for interpretation and quality control.
In silico analysis for proteins molecular weight and functions
For the estimation of the molecular weights of the proteins of the bacteriophages T7 and corresponding Escherichia hosts in the samples, the molecular weight mass of the resulted gels were analyzed In silico by the bioinformatics programs [(Lab-Image Platform v. LD300 by Kapelan Bio-Imaging GmbH), (UN – SCAN – IT v6 by Silk Scientific, Inc.) and (ImageJ 136b by Wayne Rasband, USA, National Institute of Health)] for image digitizing. For structural proteins formation, the data mining web page of BLAST – NCBI (National Center for Bioinformatics site) was used for Open Reading Frames (ORFs) identification, peptides and nucleotide sequences and compared with those of other genes.
Functional enzymatic profiles
Detection of functional enzymic activities was done by the molecular analysis of conserved domains of bacteriophage's assembly during their lytic cycle and within the predicted models directly downstream of the proteins' profiles encoded for the lytic enzymes according to their molecular weight for detecting Open Reading Frame (ORF) of the functional enzymes' profiles using the CDD search system at NCBI [34].
SDS-PAGE protein separation
The capability to detect proteins by the Two Dimensions (2D) gel electrophoresis is crucial to its application in proteomics for separating and visualizing protein mixtures. Merging this analysis with computational programs (in silico) for protein identification makes it a very controlling implement technique for characterization of protein mixtures (Table 1).
| Table 1: Proteins of standard molecular ladder. | ||
| Protein | Source | MW (Da) |
| Myosin | Pig | 200,000 |
| β-galactosidase | E. coli> | 116,000 |
| Phosphorylase B | Rabbit muscle | 97,200 |
| Serum Albumin | Bovine | 66,409 |
| Ovalbumin | Hen egg White | 44,287 |
| Carbonic anhydrase | Bovine | 29,000 |
| Trypsin inhibitor | Soybean | 20,100 |
| Lysozyme | Hen egg white | 14,300 |
| Aprotinin | Bovine pancreas | 6,500 |
| *Produced by TAKARA BIOTECHNOLOGY (DALIAN) CO., LTD | ||
The protein marker consists of unstained natural protein standards that allow accurate MW determination with uniform band intensities on SDS-PAGE gels stained with Coomassie. The marker was applied for all SDS-PAGE to determine the phage and bacteria proteins molecular weight mass, bands distance migration on gel and plotting graphs (Figure 1).
Detection of proteins' molecular weight
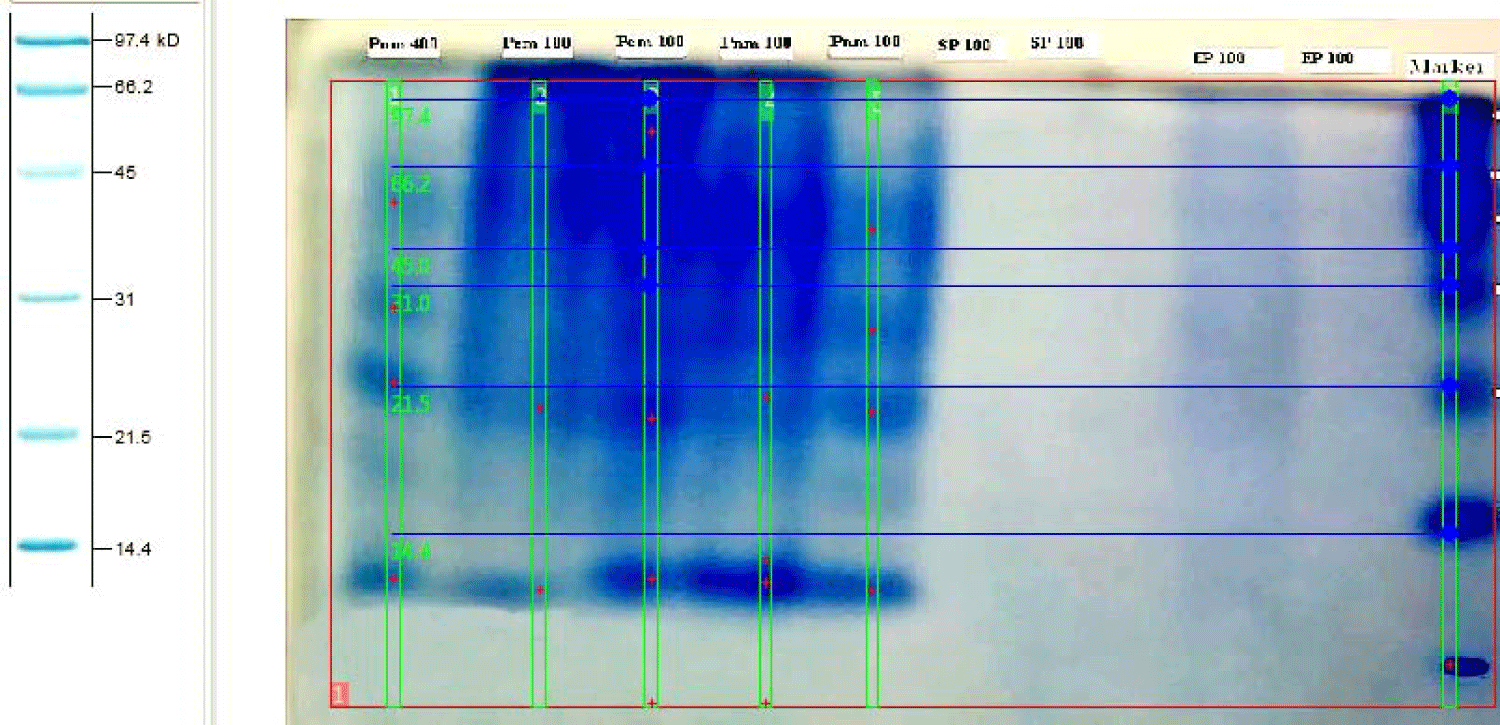
Sodium Dodecyl Sulphate-Polyacryamide Gel Electrophoresis (SDS-PAGE) profiles indicated that bacteriophage contains four structural proteins. It is necessary to determine how many kilo-Daltons (kDa) make up the protein. This can be done by comparing the results of SDS-PAGE to standard molecular ladder (marker), proteins revealed that four major proteins were observed on the gel, with molecular weight ranging from 46 to 14 kDa (Figure 2).
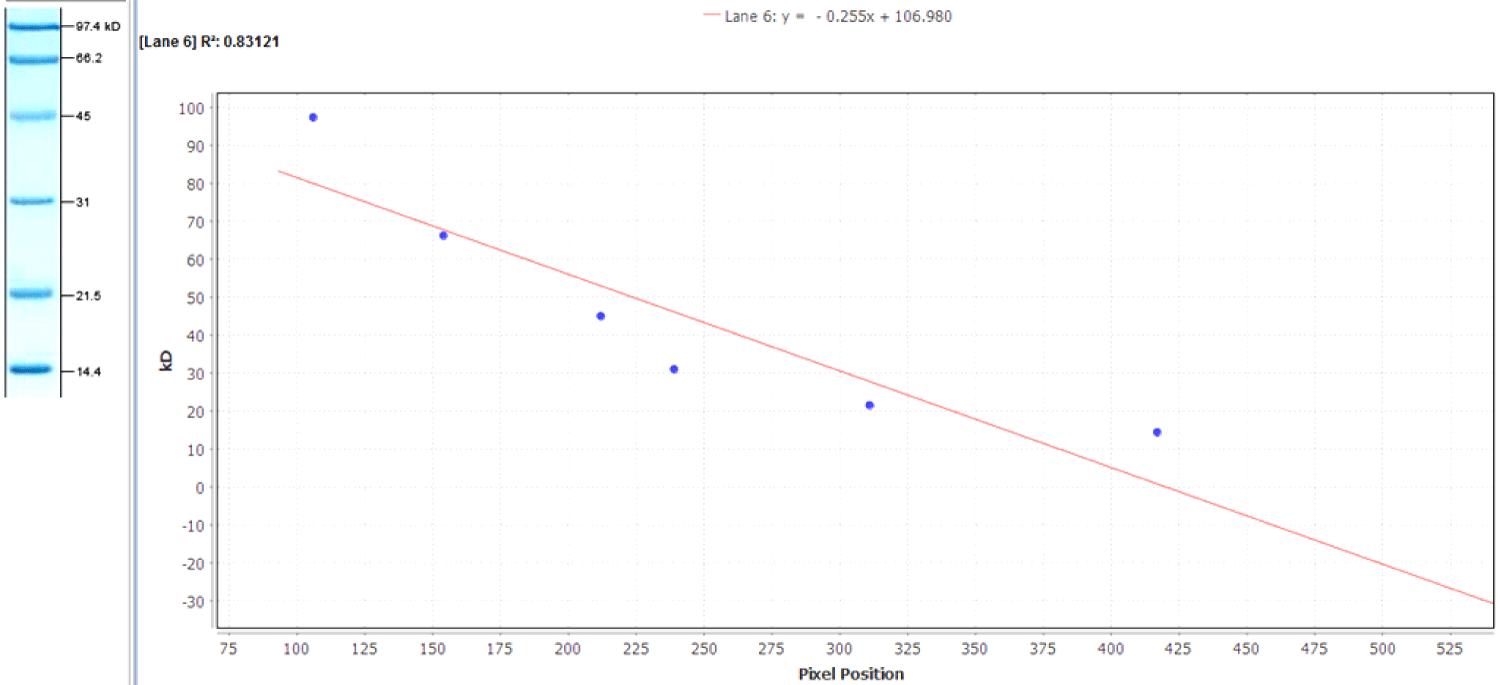
A standard curve can was constructed from the distances migrated by each marker protein. Then the distance migrated by the sample proteins was plotted and their molecular weights calculated by interpolation. The molecular weight of the protein of interest were plotted to estimate their values from the curve by linear regression analysis and also determine the band migration and position on the gel by interpolation. The data are fit with a linear regression by the line y = 0.255x + 106.980 with an R2 value of 0.83121. Note that to use the equation to return protein concentration (Figure 3).
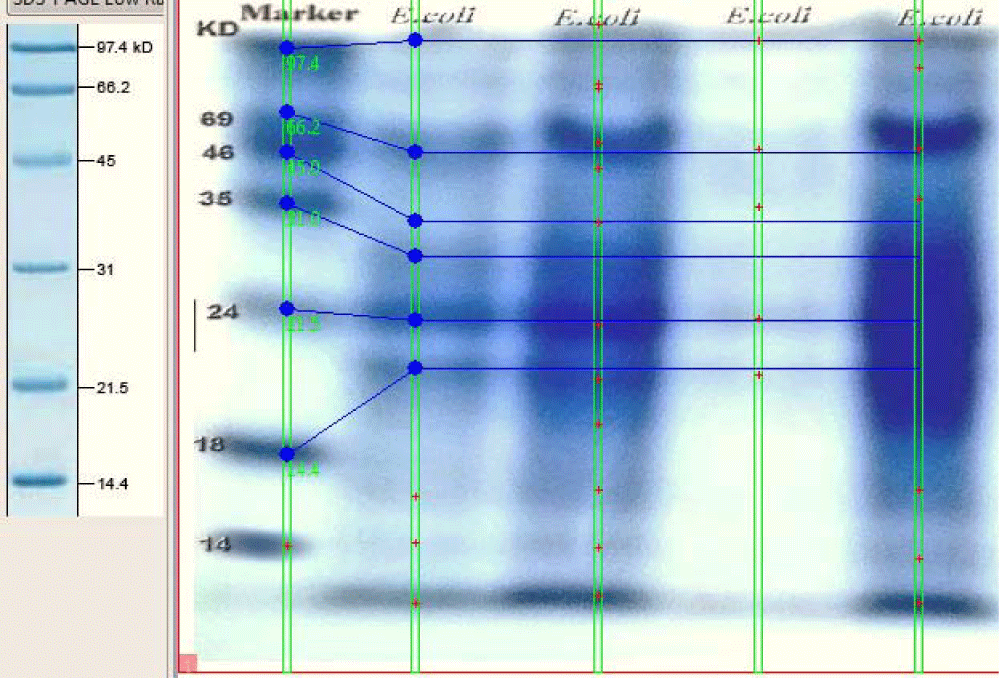
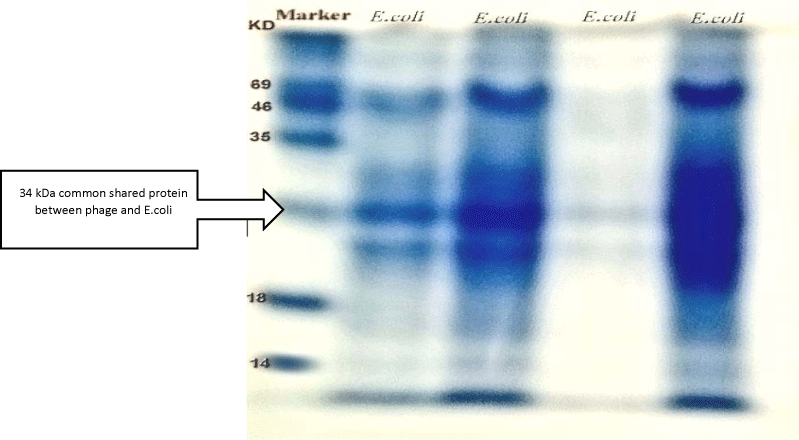
SDS-PAGE separation of whole cell extracts from E. coli, resolved on 10% acrylamide, the molecular mass of each protein marker is shown on the left. The migrant bands were lied between 97-18 kDa for each sample (Figure 4).
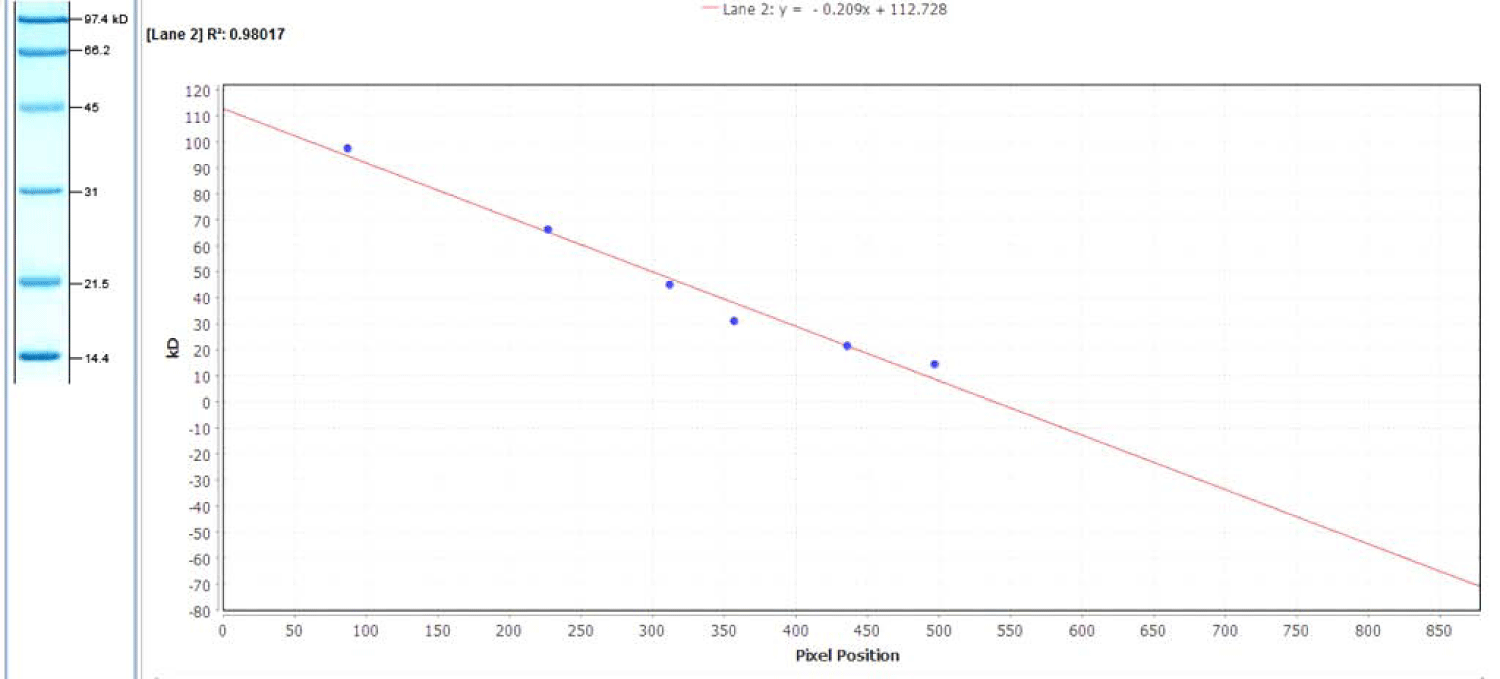
The molecular weight of the protein was calculated by measuring its relative mobility (R2) and matching that to a calibration curve created from the standards. The relative mobility is calculated by measuring the amount of movement of the protein from the origin and dividing that by the distance of the tracking dye from the origin. A linear plot (y = -0.209x + 112.728) is then constructed from the molecular weights of the protein standards graphed as a function of their R2 values = 0.98017).
Comparing protein profiles of E. coli bacteriophages
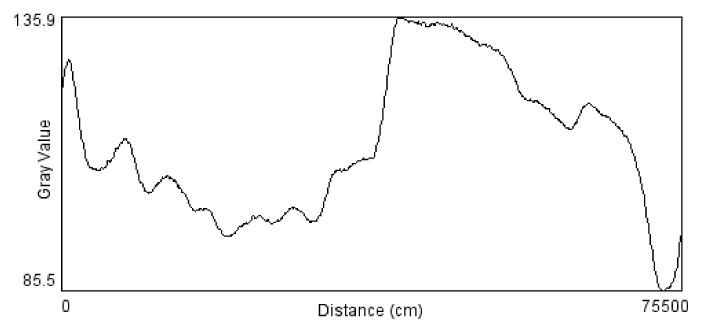
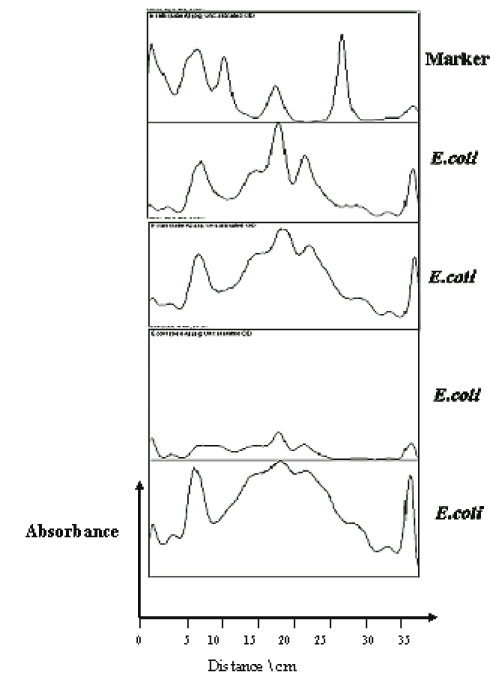
In silico analysis was done to determine expressed proteins in E. coli based on the MW of detected peaks in the SDS-PAGE plate. The analysis of the SDS-PAGE image by (UN – SCAN – IT and ImageJ) revealed the bands position on histogram according to their molecular weight (Figure 5).
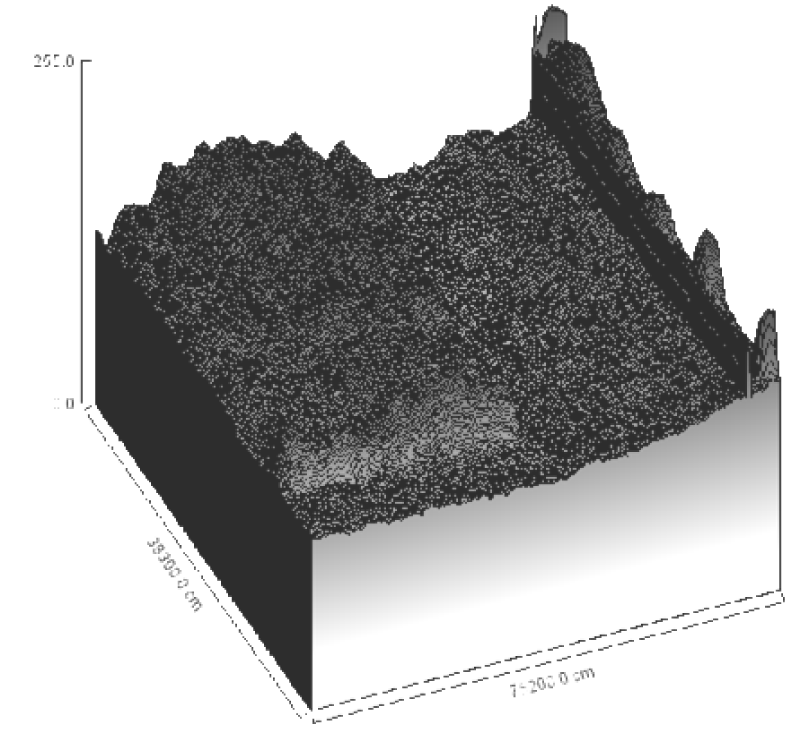
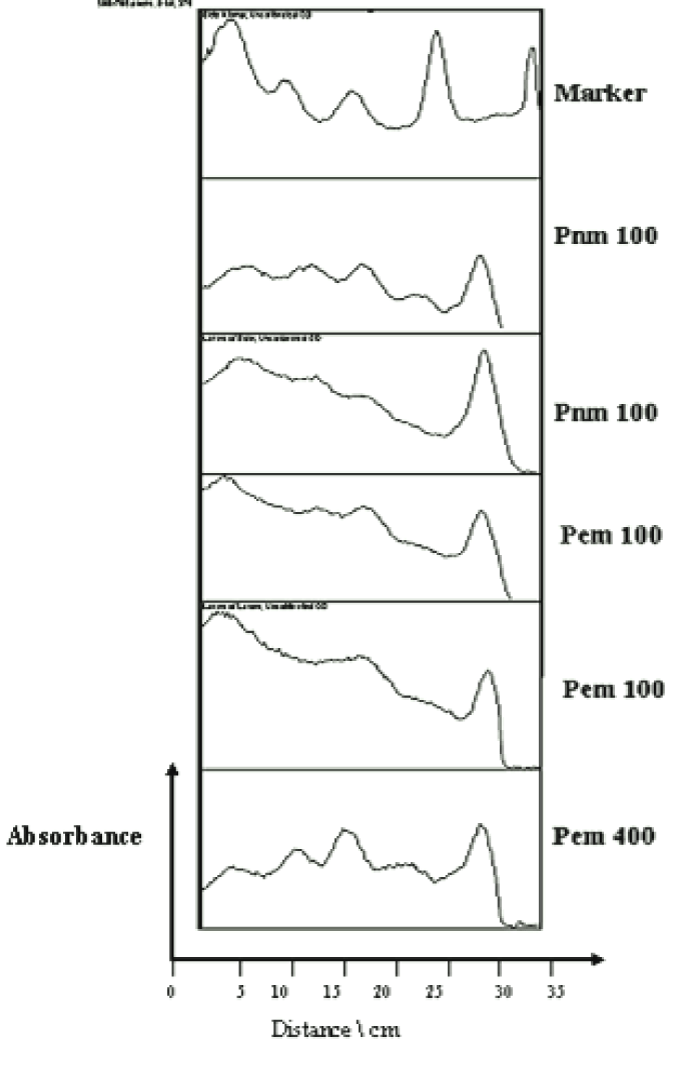
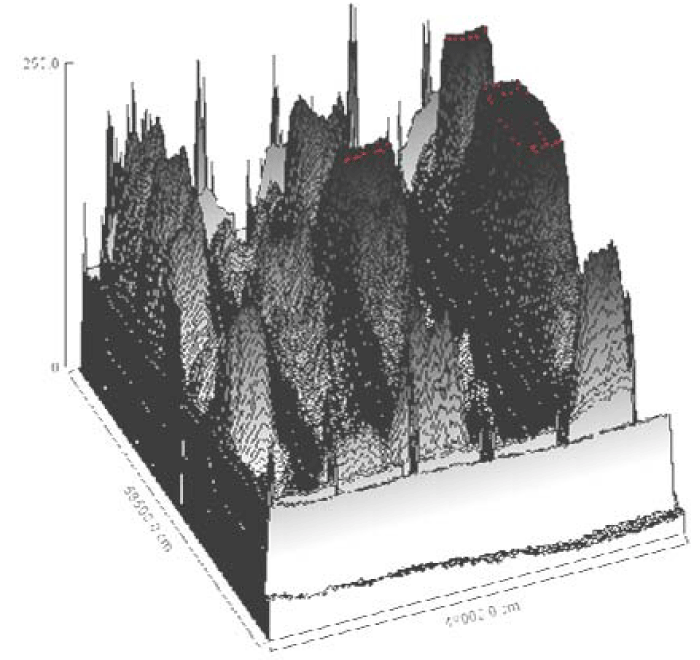
The reference markers used were ranged from 97 to 14 kDa, corresponded to standard migration distances of 5, 10, 15,20, 25, 30, 35 cm on the 2D histograms for the bands 46, 34, 24 and 14 kDa, (Figure 7). The 3D plot showed the density of mobilized proteins of the E. coli phage were density and mass of the bands observed (Figure 6). The peaks were compared in all samples and found to be similar.
Protein profiles of the bacteria analysis
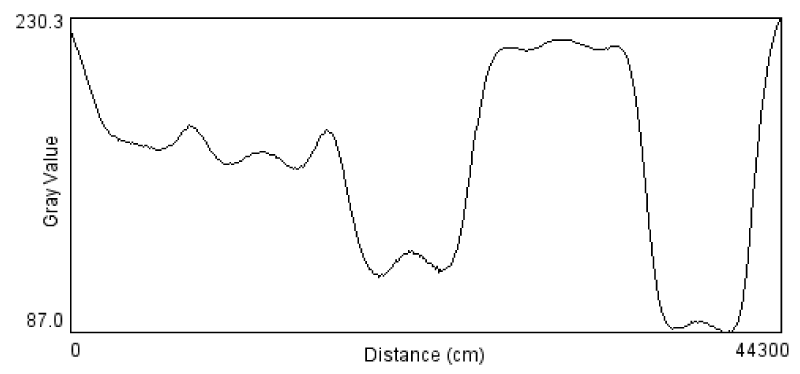
The protein profile of E. coli bacteria showed clear nine bands with molecular weight ranged between 96 and 14 figures. The obtained bands of the E. coli phage and the E. coli bacteria were compared, one band of 34 KDa showed typical similarity in both E. coli page and E. coli bacteria (Figure 8).
Multimodal frequency distribution of protein sizes for E. coli molecular masses were estimated from migration distance in 2D by bacteriophage reference markers, since migration distance is related to the protein molecular mass (Figures 7,10). The bands were plotted on 3D for density comparison (Figures 6,9) the bacterial 3D bands look thicker and higher than the phage's ones.
Assembly of structural proteins of E. coli bacteriophages
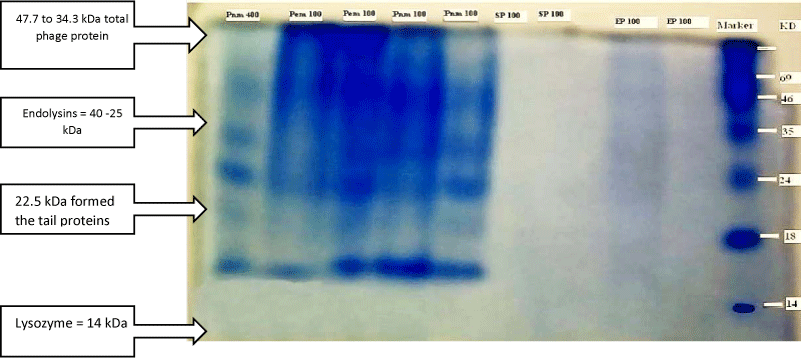
The structural proteins of the bacteriophages were identified by using BLAST online proteins' data mining tools and found to be related to the capsid and tail proteins, as well as several major and minor proteins related to the lytic enzymes group (Figure 11).
Structural proteins building up the bacteriophage produced by N-terminal sequences are resulted in size from 47.7 to 34.3 kDa formed the capsid head and the coil, 27 to 22.5 kDa formed the tail proteins and genomic proteins were: Lytic enzymes: Endolysins = 40 -25 kDa, Lysozyme =14,3 kDa (Figure 12).
The SDS-PAGE revealed a 34- kDa band corresponding to this peak, which matched the predicted size of nuclease enzyme.
The detection of bacteriophage lytic enzymes was done after equilibration of the proteins where the resulting focused bands were separated according to size using modified classical methods (SDS-PAGE) and other reducing agents discovered by [33,35,36]. The proteins' bands migration were plotted on 2D and 3D graphs for distance and density properties to predict the size of the proteins and similarity in the phage and bacterium, [37] reported that the calibration curve of SDS-MW size standards plotting the molecular weight towards mobility values estimated from migration distance in gels. The gels' digital images were acquired into computer programs and other device using imaging technology for advance analysis [38]. The in silico simulation of protein profiles analysed data by the ImageJ programme showed the protein migration plot area of the bacteriophage and their bacterial host, while similar peaks of bacteriophage's bands, in the meantime, the bacterial host E. coli protein profile showed more bands and more peaks than the bacteriophages ones, this is related to the lytic cycle of the bacteriophages and their phenomenon in utilising the bacterial proteins during their multiplication inside the host, the revealed agreed [39] who reported that the SDS-PAGE of whole-cell protein extracts of E. coli strains produced patterns containing 26 to 35 discrete bands with molecular weights of 65- 20 kDa. The molecular mass of the protein was estimated by comparing the mobility of a band with protein standards [40] reported that; Natural gel electrophoresis (mobility shift) assays might be applied to obtain quantitative information about the bands'location, distribution, equilibria and kinetics of protein-DNA interactions. The calibration curve of electrophoretic mobility against the molecular weight of known protein size was established and the relative MW of unknown protein was calculated based on the calibration curve for bacteriophage coefficient (R2 = 0.83121) and corresponding bacterial host (R2 = 0.98017), this was in agreement with [41] and their coefficient of determination (R2 = 0.998) was nearly to the findings of this study. However in the present study, the molecular analysis of SDS PAGE purified bacteriophages showed four major bands with molecular masses of 46, 34, 24 and 14 kDa this range nearly to findings of [42] who revealed 15 protein bands of lytic phage SboM-AG3 virions ranging from approximately 12 to 126 kDa based on comparison to size markers ranged from 200-15 kDa. The molecular and computational analysis of enzymes activities indicates that the encoded proteins are associated to different assigned functions according to their molecular weight scaling [43]. During their lytic cycle and assembly structural proteins building up the bacteriophage produced by N-terminal sequences are resulted in size from 47.7 to 34.3 kDa resembles 43.3% of total phage and formed the capsid head and the coil Cps (NH2-DIMSSTNNGA, encoded by ORF6). While the molecular weight mass of 27 to 22.5 kDa formed the tail proteins Tsh (NH2-PEVVNTRRXG, encoded by ORF11) corresponds to 12.7% of the total protein. The amino acid sequence minor structural protein gp16, 2.1% total phage's protein content (NH2- MKYIQTKVVY ORF16) size of 55.1 kDa. The results also agreed [44] who found the major capsid component results in size from 47.7 to 34.3 KDa resembles 43.3% of total phage protein and the tail protein corresponds to 12.7% with an apparent size of 27 kDa. The length of the phage tail is thought to be determined by a ruler mechanism, dependent on the size of the so-called tape measure protein [40]. During phage assembly phage genomic proteins were: Lytic enzymes: endolysins = 40 -25 kDa, Lysozyme =14, 3 kDa, (lysine –amino acid- = 146 kDa) [45-49]. The common shared peak 34 kDa of phage and hosted bacterium was found to be nuclease enzyme of the gp32, which is a typical model assembled for capsid protein genes of T7 and T3 phages, also the calculated molecular masses of polypeptide fragments 35 and 34 kDa, assuming that they extend to the C terminus of Escherichia coli Protein RecE [50,51]. The predicted models of lytic enzymes were assumed to have different sizes ranged between 35-12.5 KDa, [52-54]. Lytic phages manipulate the bacterial synthetic machinery to produce viral rather than bacterial nucleic acids and proteins, leading to phage assembly [55]. These phages developed a complicated lysis mechanism with many lytic enzymes in approaching and attacking bacteria, during their lytic cycle when bursting the host and release new phage progeny. This natural phenomenon makes them the best alternative solution for antibiotics resistant bacteria [56-59].
Protein separation by SDS-PAGE is a valuable system for detecting proteins, their molecular weights, and functions by the assessment of bioinformatics tools and data-mining. During the phage protein assembly, the lytic enzymes are constructed in the capsid head and the lysozyme in the tail, the lytic enzymes mediate the enzymatic cleavage for bacterial host lysing.
We would like to acknowledge with gratitude the assistance received from Dr. Mubarak Karsany (Karary University), Dr. Abdelazim Ali and Dr. Jehan Elhaboub (University of Khartoum) and their cooperative laboratories staff.
Funding: This work was supported by Elbarkal Multi Activities, Dept. Research & Consultancy [Local fund sources No; 4]; Khartoum- Sudan.
- Cai R, Wang Z, Wang G, Zhang H, Cheng M, Guo Z, Ji Y, Xi H, Wang X, Xue Y, Ur Rahman S, Sun C, Feng X, Lei L, Tong Y, Han W, Gu J. Biological properties and genomics analysis of vB_KpnS_GH-K3, a Klebsiella phage with a putative depolymerase-like protein. Virus Genes. 2019 Oct;55(5):696-706. doi: 10.1007/s11262-019-01681-z. Epub 2019 Jun 28. PMID: 31254238.
- Bukovska G, Ugorcakova J, Halgasova N, Bocanova L, Tkacova A. The BFK20 phage replication origin confers a phage-encoded resistance phenotype to the industrial strain Brevibacterium flavum. FEMS Microbiol Lett. 2019 Apr 1;366(8):fnz090. doi: 10.1093/femsle/fnz090. PMID: 31089703.
- Suarez CA, Franceschelli JJ, Morbidoni HR. Mycobacteriophage CRB2 defines a new subcluster in mycobacteriophage classification. PLoS One. 2019 Feb 27;14(2):e0212365. doi: 10.1371/journal.pone.0212365. PMID: 30811481; PMCID: PMC6392294.
- Staquicini FI, Sidman RL, Arap W, Pasqualini R. Phage display technology for stem cell delivery and systemic therapy. Adv Drug Deliv Rev. 2010 Sep 30;62(12):1213-6. doi: 10.1016/j.addr.2010.09.014. Epub 2010 Oct 4. PMID: 20932865.
- Kleiner M, Thorson E, Sharp CE, Dong X, Liu D, Li C, Strous M. Assessing species biomass contributions in microbial communities via metaproteomics. Nat Commun. 2017 Nov 16;8(1):1558. doi: 10.1038/s41467-017-01544-x. PMID: 29146960; PMCID: PMC5691128.
- Lu Z, Breidt F Jr, Fleming HP, Altermann E, Klaenhammer TR. Isolation and characterization of a Lactobacillus plantarum bacteriophage, phiJL-1, from a cucumber fermentation. Int J Food Microbiol. 2003 Jul 25;84(2):225-35. doi: 10.1016/s0168-1605(03)00111-9. PMID: 12781945.
- Yildirim Z, Sakin T, Akçelik M, Akçelik N. Characterization of SE-P3, P16, P37, and P47 bacteriophages infecting Salmonella Enteritidis. J Basic Microbiol. 2019 Oct;59(10):1049-1062. doi: 10.1002/jobm.201900102. Epub 2019 Jul 25. PMID: 31347183.
- Urban-Chmiel R, Wernicki A, Wawrzykowski J, Puchalski A, Nowaczek A, Dec M, Stęgierska D, Alomari MMM. Protein profiles of bacteriophages of the family Myoviridae-like induced on M. haemolytica. AMB Express. 2018 Jun 19;8(1):102. doi: 10.1186/s13568-018-0630-3. PMID: 29923151; PMCID: PMC6008273.
- Bergeron N, Corriveau J, Letellier A, Daigle F, Quessy S. Characterization of Salmonella Typhimurium isolates associated with septicemia in swine. Can J Vet Res. 2010 Jan;74(1):11-7. PMID: 20357952; PMCID: PMC2801305.
- Morris J, Singh JM, Eberwine JH. Transcriptome analysis of single cells. J Vis Exp. 2011 Apr 25;(50):2634. doi: 10.3791/2634. Erratum in: J Vis Exp. 2011;57. doi: 10.3791/4082. PMID: 21540826; PMCID: PMC3376915.
- Millen AM, Samson JE, Tremblay DM, Magadán AH, Rousseau GM, Moineau S, Romero DA. Lactococcus lactis type III-A CRISPR-Cas system cleaves bacteriophage RNA. RNA Biol. 2019 Apr;16(4):461-468. doi: 10.1080/15476286.2018.1502589. Epub 2018 Oct 2. PMID: 30081743; PMCID: PMC6546414.
- Alves JM, de Oliveira AL, Sandberg TO, Moreno-Gallego JL, de Toledo MA, de Moura EM, Oliveira LS, Durham AM, Mehnert DU, Zanotto PM, Reyes A, Gruber A. GenSeed-HMM: A Tool for Progressive Assembly Using Profile HMMs as Seeds and its Application in Alpavirinae Viral Discovery from Metagenomic Data. Front Microbiol. 2016 Mar 4;7:269. doi: 10.3389/fmicb.2016.00269. PMID: 26973638; PMCID: PMC4777721.
- Iyer LM, Koonin EV, Aravind L. Evolutionary connection between the catalytic subunits of DNA-dependent RNA polymerases and eukaryotic RNA-dependent RNA polymerases and the origin of RNA polymerases. BMC Struct Biol. 2003 Jan 28;3:1. doi: 10.1186/1472-6807-3-1. Epub 2003 Jan 28. PMID: 12553882; PMCID: PMC151600.
- Zhang W, Mi Z, Yin X, Fan H, An X, Zhang Z, Chen J, Tong Y. Characterization of Enterococcus faecalis phage IME-EF1 and its endolysin. PLoS One. 2013 Nov 13;8(11):e80435. doi: 10.1371/journal.pone.0080435. PMID: 24236180; PMCID: PMC3827423.
- Aleshkin GI, Smelkova OI, Timakova NV, Dobrynina OIu, Umiarov AM, Rusina OIu, Markov AP, Bol'shakova TN. [Role of phage LØ7 lysogeny in genetic variability of Escherichia coli]. Zh Mikrobiol Epidemiol Immunobiol. 2014 Nov-Dec;(6):14-20. Russian. PMID: 25816508.
- Ziedaite G, Daugelavicius R, Bamford JK, Bamford DH. The Holin protein of bacteriophage PRD1 forms a pore for small-molecule and endolysin translocation. J Bacteriol. 2005 Aug;187(15):5397-405. doi: 10.1128/JB.187.15.5397-5405.2005. PMID: 16030234; PMCID: PMC1196050.
- Kakikawa M, Yokoi KJ, Kimoto H, Nakano M, Kawasaki K, Taketo A, Kodaira K. Molecular analysis of the lysis protein Lys encoded by Lactobacillus plantarum phage phig1e. Gene. 2002 Oct 16;299(1-2):227-34. doi: 10.1016/s0378-1119(02)01076-4. PMID: 12459270.
- Chan BK, Abedon ST. Bacteriophages and their enzymes in biofilm control. Curr Pharm Des. 2015;21(1):85-99. doi: 10.2174/1381612820666140905112311. PMID: 25189866.
- O'Flaherty S, Ross RP, Flynn J, Meaney WJ, Fitzgerald GF, Coffey A. Isolation and characterization of two anti-staphylococcal bacteriophages specific for pathogenic Staphylococcus aureus associated with bovine infections. Lett Appl Microbiol. 2005;41(6):482-6. doi: 10.1111/j.1472-765X.2005.01781.x. PMID: 16305674.
- Nelson D, Loomis L, Fischetti VA. Prevention and elimination of upper respiratory colonization of mice by group A streptococci by using a bacteriophage lytic enzyme. Proc Natl Acad Sci U S A. 2001 Mar 27;98(7):4107-12. doi: 10.1073/pnas.061038398. Epub 2001 Mar 20. PMID: 11259652; PMCID: PMC31187.
- Bhardwaj A, Molineux IJ, Casjens SR, Cingolani G. Atomic structure of bacteriophage Sf6 tail needle knob. J Biol Chem. 2011 Sep 2;286(35):30867-77. doi: 10.1074/jbc.M111.260877. Epub 2011 Jun 25. PMID: 21705802; PMCID: PMC3162447.
- Pei J, Grishin NV. COG3926 and COG5526: a tale of two new lysozyme-like protein families. Protein Sci. 2005 Oct;14(10):2574-81. doi: 10.1110/ps.051656805. Epub 2005 Sep 9. PMID: 16155206; PMCID: PMC2253296.
- Pei J, Grishin NV. The P5 protein from bacteriophage phi-6 is a distant homolog of lytic transglycosylases. Protein Sci. 2005 May;14(5):1370-4. doi: 10.1110/ps.041250005. Epub 2005 Mar 31. PMID: 15802648; PMCID: PMC2253257.
- Jing R, Cao K, Liu J, Liu J, Jin J, Liu X, Wang G. [Genetic diversity of psbA of cyanophage from paddy floodwater in northeast China]. Wei Sheng Wu Xue Bao. 2017 Jan 4;57(1):131-9. Chinese. PMID: 29746767.
- Hunt DM, Sahota VK, Taylor K, Simrak D, Hornigold N, Arnemann J, Wolfe J, Buxton RS. Clustered cadherin genes: a sequence-ready contig for the desmosomal cadherin locus on human chromosome 18. Genomics. 1999 Dec 15;62(3):445-55. doi: 10.1006/geno.1999.6036. PMID: 10644442.
- Comeau AM, Krisch HM. The capsid of the T4 phage superfamily: the evolution, diversity, and structure of some of the most prevalent proteins in the biosphere. Mol Biol Evol. 2008 Jul;25(7):1321-32. doi: 10.1093/molbev/msn080. Epub 2008 Apr 7. PMID: 18391067.
- Menéndez-Conejero R, Nguyen TH, Singh AK, Condezo GN, Marschang RE, van Raaij MJ, San Martín C. Structure of a Reptilian Adenovirus Reveals a Phage Tailspike Fold Stabilizing a Vertebrate Virus Capsid. Structure. 2017 Oct 3;25(10):1562-1573.e5. doi: 10.1016/j.str.2017.08.007. Epub 2017 Sep 21. PMID: 28943338.
- Chaudhry WN, Haq IU, Andleeb S, Qadri I. Characterization of a virulent bacteriophage LK1 specific for Citrobacter freundii isolated from sewage water. J Basic Microbiol. 2014 Jun;54(6):531-41. doi: 10.1002/jobm.201200710. Epub 2013 May 20. PMID: 23686910.
- Thomas JA, Weintraub ST, Hakala K, Serwer P, Hardies SC. Proteome of the large Pseudomonas myovirus 201 phi 2-1: delineation of proteolytically processed virion proteins. Mol Cell Proteomics. 2010 May;9(5):940-51. doi: 10.1074/mcp.M900488-MCP200. Epub 2010 Mar 16. PMID: 20233846; PMCID: PMC2871425.
- Halgasova N, Matuskova R, Kraus D, Tkacova A, Balusikova L, Bukovska G. Gp41, a superfamily SF2 helicase from bacteriophage BFK20. Virus Res. 2018 Feb 2;245:7-16. doi: 10.1016/j.virusres.2017.12.005. Epub 2017 Dec 14. PMID: 29248499.
- Yoo J, Lee G. Allosteric ring assembly and chemo-mechanical melting by the interaction between 5'-phosphate and λ exonuclease. Nucleic Acids Res. 2015 Dec 15;43(22):10861-9. doi: 10.1093/nar/gkv1150. Epub 2015 Nov 2. PMID: 26527731; PMCID: PMC4678818.
- Martins A, Shuman S. Characterization of a baculovirus enzyme with RNA ligase, polynucleotide 5'-kinase, and polynucleotide 3'-phosphatase activities. J Biol Chem. 2004 Apr 30;279(18):18220-31. doi: 10.1074/jbc.M313386200. Epub 2004 Jan 26. PMID: 14747466.
- Laemmli UK. Cleavage of structural proteins during the assembly of the head of bacteriophage T4. Nature. 1970 Aug 15;227(5259):680-5. doi: 10.1038/227680a0. PMID: 5432063.
- Jakobsson E, Jokilammi A, Aalto J, Ollikka P, Lehtonen JV, Hirvonen H, Finne J. Identification of amino acid residues at the active site of endosialidase that dissociate the polysialic acid binding and cleaving activities in Escherichia coli K1 bacteriophages. Biochem J. 2007 Aug 1;405(3):465-72. doi: 10.1042/BJ20070177. PMID: 17394421; PMCID: PMC2267309.
- Laemmli UK, Beguin F, Gujer-Kellenberger G. A factor preventing the major head protein of bacteriophage T4 from random aggregation. J Mol Biol. 1970 Jan 14;47(1):69-85. doi: 10.1016/0022-2836(70)90402-x. PMID: 5413343.
- Laemmli UK, Mölbert E, Showe M, Kellenberger E. Form-determining function of the genes required for the assembly of the head of bacteriophage T4. J Mol Biol. 1970 Apr 14;49(1):99-113. doi: 10.1016/0022-2836(70)90379-7. PMID: 5450520.
- Desharnais P, Naud JF, Ayotte C. Desialylation improves the detection of recombinant erythropoietins in urine samples analyzed by SDS-PAGE. Drug Test Anal. 2013 Nov-Dec;5(11-12):870-6. doi: 10.1002/dta.1494. Epub 2013 May 29. PMID: 23720238.
- Nishidate I, Maeda T, Niizeki K, Aizu Y. Estimation of melanin and hemoglobin using spectral reflectance images reconstructed from a digital RGB image by the Wiener estimation method. Sensors (Basel). 2013 Jun 19;13(6):7902-15. doi: 10.3390/s130607902. PMID: 23783740; PMCID: PMC3715247.
- Jiang R, Yang H, Sun F, Chen T. Searching for interpretable rules for disease mutations: a simulated annealing bump hunting strategy. BMC Bioinformatics. 2006 Sep 19;7:417. doi: 10.1186/1471-2105-7-417. PMID: 16984653; PMCID: PMC1618409.
- Fried MG. Measurement of protein-DNA interaction parameters by electrophoresis mobility shift assay. Electrophoresis. 1989 May-Jun;10(5-6):366-76. doi: 10.1002/elps.1150100515. PMID: 2670548.
- Duggleby RG. Calculation of the molecular weight of proteins from electrophoretic and gel exclusion chromatographic experiments. Comput Appl Biosci. 1994 Apr;10(2):133-5. doi: 10.1093/bioinformatics/10.2.133. PMID: 8019860.
- Anany H, Lingohr EJ, Villegas A, Ackermann HW, She YM, Griffiths MW, Kropinski AM. A Shigella boydii bacteriophage which resembles Salmonella phage ViI. Virol J. 2011 May 19;8:242. doi: 10.1186/1743-422X-8-242. PMID: 21595934; PMCID: PMC3121705.
- Zuther E, Schubert H, Hagemann M. Mutation of a gene encoding a putative glycoprotease leads to reduced salt tolerance, altered pigmentation, and cyanophycin accumulation in the cyanobacterium Synechocystis sp. strain PCC 6803. J Bacteriol. 1998 Apr;180(7):1715-22. doi: 10.1128/JB.180.7.1715-1722.1998. PMID: 9537367; PMCID: PMC107082.
- Black LW, Rao VB. Structure, assembly, and DNA packaging of the bacteriophage T4 head. Adv Virus Res. 2012;82:119-53. doi: 10.1016/B978-0-12-394621-8.00018-2. PMID: 22420853; PMCID: PMC4365992.
- North OI, Sakai K, Yamashita E, Nakagawa A, Iwazaki T, Büttner CR, Takeda S, Davidson AR. Phage tail fibre assembly proteins employ a modular structure to drive the correct folding of diverse fibres. Nat Microbiol. 2019 Oct;4(10):1645-1653. doi: 10.1038/s41564-019-0477-7. Epub 2019 Jun 17. PMID: 31209305.
- Kizziah JL, Manning KA, Dearborn AD, Wall EA, Klenow L, Hill RLL, Spilman MS, Stagg SM, Christie GE, Dokland T. Cleavage and Structural Transitions during Maturation of Staphylococcus aureus Bacteriophage 80α and SaPI1 Capsids. Viruses. 2017 Dec 16;9(12):384. doi: 10.3390/v9120384. PMID: 29258203; PMCID: PMC5744158.
- Xu RG, Jenkins HT, Antson AA, Greive SJ. Structure of the large terminase from a hyperthermophilic virus reveals a unique mechanism for oligomerization and ATP hydrolysis. Nucleic Acids Res. 2017 Dec 15;45(22):13029-13042. doi: 10.1093/nar/gkx947. PMID: 29069443; PMCID: PMC5727402.
- Mahony J, Alqarni M, Stockdale S, Spinelli S, Feyereisen M, Cambillau C, Sinderen DV. Functional and structural dissection of the tape measure protein of lactococcal phage TP901-1. Sci Rep. 2016 Nov 8;6:36667. doi: 10.1038/srep36667. PMID: 27824135; PMCID: PMC5099701.
- Fokine A, Rossmann MG. Common Evolutionary Origin of Procapsid Proteases, Phage Tail Tubes, and Tubes of Bacterial Type VI Secretion Systems. Structure. 2016 Nov 1;24(11):1928-1935. doi: 10.1016/j.str.2016.08.013. Epub 2016 Sep 22. PMID: 27667692; PMCID: PMC5093050.
- Chen X, Scala G, Quinto I, Liu W, Chun TW, Justement JS, Cohen OJ, vanCott TC, Iwanicki M, Lewis MG, Greenhouse J, Barry T, Venzon D, Fauci AS. Protection of rhesus macaques against disease progression from pathogenic SHIV-89.6PD by vaccination with phage-displayed HIV-1 epitopes. Nat Med. 2001 Nov;7(11):1225-31. doi: 10.1038/nm1101-1225. PMID: 11689887.
- Winn RN, Norris MB, Brayer KJ, Torres C, Muller SL. Detection of mutations in transgenic fish carrying a bacteriophage lambda cII transgene target. Proc Natl Acad Sci U S A. 2000 Nov 7;97(23):12655-60. doi: 10.1073/pnas.220428097. PMID: 11035814; PMCID: PMC18819.
- Srinivasan R, Chaitanyakumar A, Subramanian P, Mageswari A, Gomathi A, Aswini V, Sankar AM, Ramya M, Gothandam KM. Recombinant engineered phage-derived enzybiotic in Pichia pastoris X-33 as whole cell biocatalyst for effective biocontrol of Vibrio parahaemolyticus in aquaculture. Int J Biol Macromol. 2020 Jul 1;154:1576-1585. doi: 10.1016/j.ijbiomac.2019.11.042. Epub 2019 Nov 9. PMID: 31715237.
- Oliveira H, Costa AR, Ferreira A, Konstantinides N, Santos SB, Boon M, Noben JP, Lavigne R, Azeredo J. Functional Analysis and Antivirulence Properties of a New Depolymerase from a Myovirus That Infects Acinetobacter baumannii Capsule K45. J Virol. 2019 Feb 5;93(4):e01163-18. doi: 10.1128/JVI.01163-18. Erratum in: J Virol. 2020 Apr 16;94(9): PMID: 30463964; PMCID: PMC6364002.
- Dodd IB, Shearwin KE, Sneppen K. Modelling transcriptional interference and DNA looping in gene regulation. J Mol Biol. 2007 Jun 22;369(5):1200-13. doi: 10.1016/j.jmb.2007.04.041. Epub 2007 Apr 20. PMID: 17498740.
- Paradis-Bleau C, Cloutier I, Lemieux L, Sanschagrin F, Laroche J, Auger M, Garnier A, Levesque RC. Peptidoglycan lytic activity of the Pseudomonas aeruginosa phage phiKZ gp144 lytic transglycosylase. FEMS Microbiol Lett. 2007 Jan;266(2):201-9. doi: 10.1111/j.1574-6968.2006.00523.x. PMID: 17233731.
- Freitag-Pohl S, Jasilionis A, Håkansson M, Svensson LA, Kovačič R, Welin M, Watzlawick H, Wang L, Altenbuchner J, Płotka M, Kaczorowska AK, Kaczorowski T, Nordberg Karlsson E, Al-Karadaghi S, Walse B, Aevarsson A, Pohl E. Crystal structures of the Bacillus subtilis prophage lytic cassette proteins XepA and YomS. Acta Crystallogr D Struct Biol. 2019 Nov 1;75(Pt 11):1028-1039. doi: 10.1107/S2059798319013330. Epub 2019 Nov 1. PMID: 31692476; PMCID: PMC6834076.
- Hernandez-Morales AC, Lessor LL, Wood TL, Migl D, Mijalis EM, Cahill J, Russell WK, Young RF, Gill JJ. Genomic and Biochemical Characterization of Acinetobacter Podophage Petty Reveals a Novel Lysis Mechanism and Tail-Associated Depolymerase Activity. J Virol. 2018 Feb 26;92(6):e01064-17. doi: 10.1128/JVI.01064-17. PMID: 29298884; PMCID: PMC5827379.
- Dunne M, Leicht S, Krichel B, Mertens HD, Thompson A, Krijgsveld J, Svergun DI, Gómez-Torres N, Garde S, Uetrecht C, Narbad A, Mayer MJ, Meijers R. Crystal Structure of the CTP1L Endolysin Reveals How Its Activity Is Regulated by a Secondary Translation Product. J Biol Chem. 2016 Mar 4;291(10):4882-93. doi: 10.1074/jbc.M115.671172. Epub 2015 Dec 18. PMID: 26683375; PMCID: PMC4777826.
- Schmelcher M, Donovan DM, Loessner MJ. Bacteriophage endolysins as novel antimicrobials. Future Microbiol. 2012 Oct;7(10):1147-71. doi: 10.2217/fmb.12.97. PMID: 23030422; PMCID: PMC3563964.
Content Alerts
SignUp to our
Content alerts.
 This work is licensed under a Creative Commons Attribution 4.0 International License.


